In this edition of the Value Seeker Report we analyze an investment opportunity in AT&T (NYSE: T) using fundamental and technical analysis.
Overview
- We utilize RIA Advisors’ Discounted Cash Flow (DCF) valuation model to evaluate the investment merits of AT&T (NYSE: T). Our model is based on our forecasts of free cash flow over the next ten years.
- Using what we view as conservative forecasts, we arrive at an intrinsic value of $38.09 per share for T’s Stock. The stock is currently trading at $29.82.
Pros
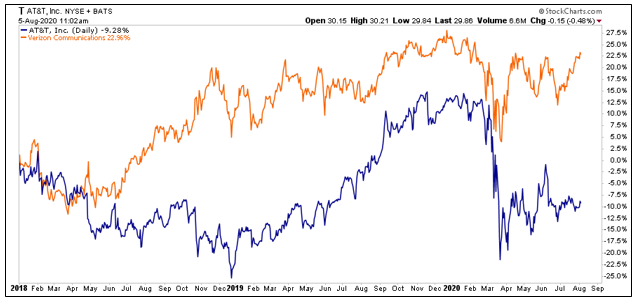
- T declined in line with the market in March, but its performance has lagged the market since the bottom. As a result, the dividend yield on this stock is currently hovering around 7%.
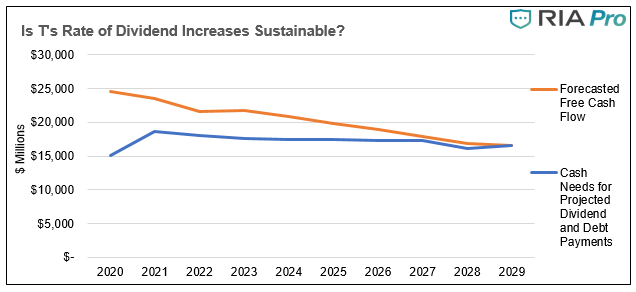
- T has increased its dividend for 15 consecutive years. In each of the last 11 years, they have increased the dividend by $0.04 per share.
- According to our forecasts, T will produce enough cash flow to continue this trend for the next ten years.
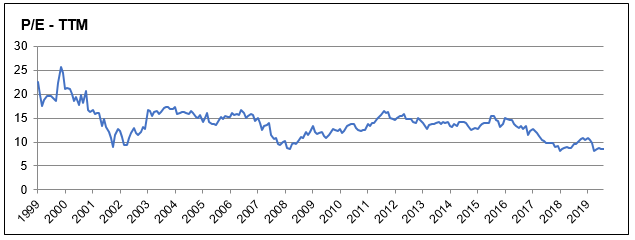
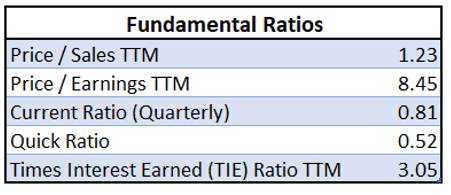
- T trades at a Price to Earnings (P/E) of 8.45, which is near the lowest it has been in at least 20 years.
Cons
- As shown below, the market feels a lack of enthusiasm towards T’s recent acquisitions of DirecTV in 2015 and Time Warner in 2018. Due to these acquisitions, the market is concerned that T will continue to make less-than-optimal investments and fall further behind in the race to deploy nationwide 5G coverage. This could lead to price stagnation for the stock until Investors see a reason to believe the firm can successfully roll out its 5G network.
Key Assumptions
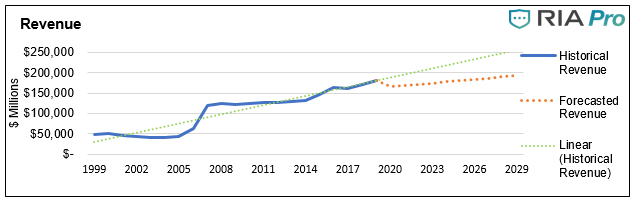
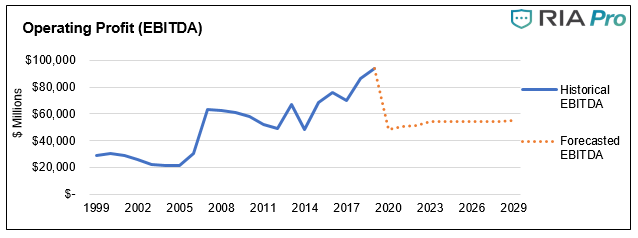
- Despite revenue growth of 5+% on an annualized basis over periods of the last 5-years and last 20-years, we conservatively assume negative growth in FY20 and muted growth in the following 9 years. The chart below compares our forecasts to a linear projection (green dotted line) based on historical revenue.
- T will have depressed profit margins in 2020, which should recover gradually. As the market for 5G coverage begins to mature, margins should trend down to our long-term forecast.
- Over the forecasted 10-year period, the firm will make the capital investments necessary to support the nationwide expansion of its 5G network.
Technical Snapshot
- T is about $4 a share above a critical support line going back over a decade. This is an important support and provides investors with a reasonable stop-loss if it is materially violated.
- On a short-term basis, T is set up to test resistance at the 50-day moving average. At the same time, we see money flow buy signals. We would need to see a sustained price move above the 50-day moving average before the uptrend is confirmed.
Value Seeker Report Conclusion On (T)
- According to our forecasts, T is currently 27.7% undervalued by the market.
- In an environment with high equity valuations and bonds yielding little, T represents a valuable investment opportunity due to its dividend yield and potential price appreciation. While there are certainly some pitfalls, we believe the discounted stock price and high dividend offer a margin of error that makes the investment worthwhile.

Nick Lane
Nick Lane Investment Analyst
A native of Kingwood, Texas Nick attended college at the University of Houston. He completed a BBA in Accounting and Finance and 2018 and then a Masters of Science in Finance in 2020. Outside of work, Nick enjoys both saltwater and freshwater fishing as well as following various professional sports leagues.
2020/08/06
Also Read