
The existing home sales market has been at a standstill. Buyers are turning away due to 7%+ mortgage rates and high prices. At the same, selling a house is equally difficult. Sellers do not want to get rid of low-rate mortgages and assume a much higher mortgage on a new purchase. Supply problems in the existing home market have aided sales of new homes. Homebuilders have enticed buyers via reduced mortgage rates. DH Horton claims about 60% of their closings use “rate buy downs.” Further, they have resorted to reducing prices via “introducing smaller product footprints, and de-amenitizing some of the homes a bit.” Based on recent NAHB (National Association of Homebuilders) data, new home sales are trending lower.
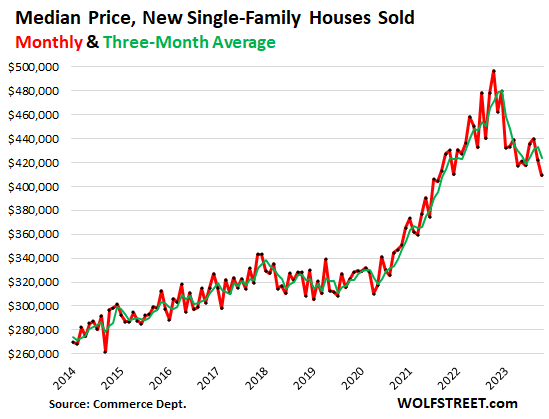
NAHB’s latest New Residential Sales Report shows that new home prices and sales are falling while inventory is rising. The graph below from Wolfstreet.com shows NAHB median new home prices are down nearly 20% from 2022 peaks, albeit still decently above pre-pandemic levels. While smaller houses and “de-amenitizing” result in lower prices, the rising inventory of new homes may further pressure new home prices. Per Wolfstreet- “Inventory for sale of new houses at all stages of construction rose to 449,000 houses in October, which translated into 8.8 months supply at the current rate of sales – more than ample inventory and supply, and homebuilders are motivated to make deals to move this inventory.”
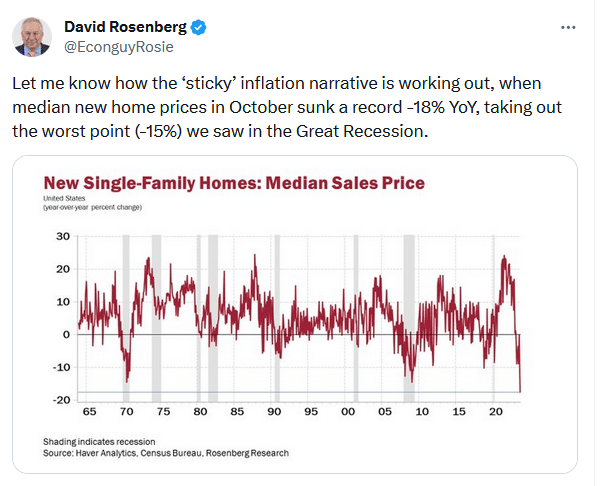
New and existing home sales greatly affect economic activity and significantly contribute to CPI inflation data. If recent trends continue, we should expect much lower inflation and weak economic activity. See our Tweet of the Day for David Rosenberg’s view on the NAHB median sales price index and sticky inflation.
What To Watch Today
Earnings

Economy

Market Trading Update
Yesterday, the market jumped higher out of the gate and looked set to try to push the recent highs. However, it failed at about mid-day and closed the day mostly unchanged. This action is not surprising given the current overbought nature of the market. As shown below, the accumulation/distribution line is starting to roll over as volume continues to contract since the beginning of the rally this month. This action suggests that the current consolidation/corrective action will continue until these signals reverse. However, given the current weakness, any pickup in selling pressure will be able to drag the market lower in the short term. Continue to trade cautiously for now. While there is no reason to be overly bearish at the moment, maintaining a little dry powder may prove opportunistic later in December.


The S&P 7 Are Reaching Peak Valuations
The predominant investment theme of 2023 was the gross outperformance of 7 S&P 500 stocks. 7 of the largest S&P 500 stocks have thus far accounted for nearly 100% of the year’s gains. Can the dominance of such a small handful of market leaders continue? The answer is absolutely, but for how long? At some point, likely coinciding with a bear market, the valuations of the 7 stocks will cause doubt in investors’ heads, as such instances have in the past.
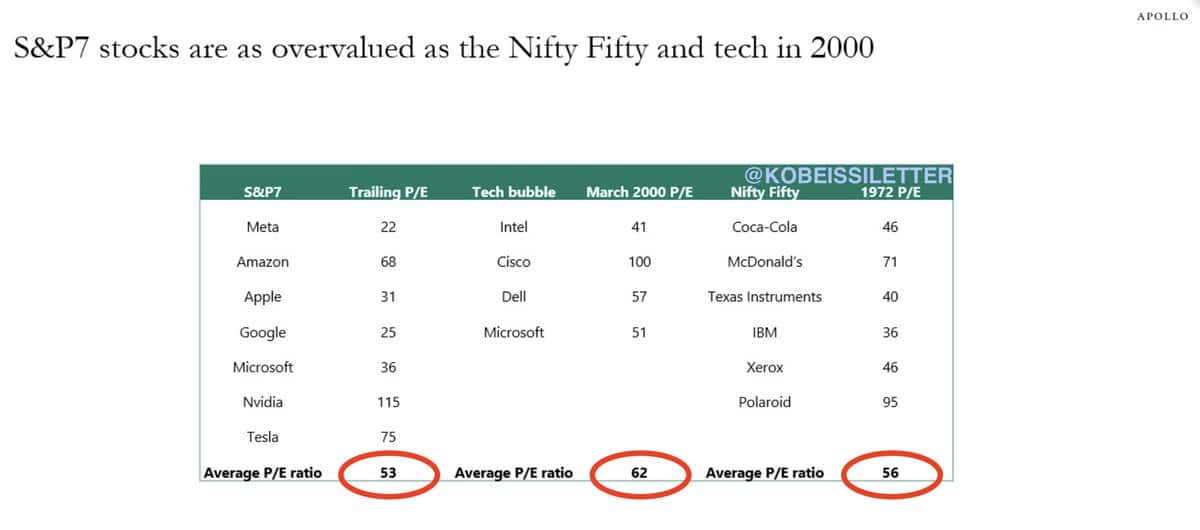
For a historical perspective on two other periods when a small number of stocks led markets higher, we share the graphic below from Apollo and the Kobeissi Letter. The table compares P/E valuations of the S&P 7 to the leaders of the late 90s tech bubble and the Nifty-Fifty blue chips stocks in the 1960s and 70s. The average P/E of the S&P 7 is over two times that of the S&P 500 and comparable to the prior instances in the table.
Once the Tech bubble popped, the market leaders fell precipitously, much more than the broader markets. It took many years, as shown below, for the four stocks and many other high-flying stocks to regain their prior highs.
- Intel: 18 years
- Cisco: 22 years
- Dell: Went private in 2013. At that time, it was down -75% from 12/31/99
- Microsoft: 13 years
Per Wikipedia, the popping of the Nifty Fifty bubble saw similar underperformance of the leaders:
The long bear market of the 1970s which began with the 1973–74 stock market crash and lasted until 1982 caused valuations of the nifty fifty to fall to low levels along with the rest of the market, with most of these stocks under-performing the broader market averages.
Passive investing may keep the S&P 7 stocks in favor for a while longer, but ultimately, high valuations are challenging to sustain, especially in bear markets.
Fed President Waller Prefers To Pause
This week, we are paying close attention to Fed speeches to see if the recent decline in yields and an uptick in stock prices concern them that easier financial conditions may force the Fed to hike rates. Based on comments of Fed Governor Chris Waller, it appears a hike is not likely.
“I’m increasingly confident that policy is currently well positioned to slow the economy & get inflation back to 2%. I’m encouraged by what we’ve learned in the past few weeks — something appears to be giving & it’s the pace of the economy”
“Policy is well positioned” alludes that current rates are doing their job of slowing the economy and reducing inflation. Waller, nor any Fed member will say the Fed is done, but his language certainly makes a case that chances are high we have seen the last rate hike of the cycle. As investors, we should address how long a pause may last before the Fed cuts rates. Importantly, how stocks and bonds have done during prior rate pausing and cutting cycles. We will have more on the topic and historical data in a coming article.
Tweet of the Day
Please subscribe to the daily commentary to receive these updates every morning before the opening bell.
If you found this blog useful, please send it to someone else, share it on social media, or contact us to set up a meeting.

