
Gold and Bitcoin have been among some of the best-performing assets recently, yet despite their outperformance, the companies that mine for gold and bitcoin lag well behind their respective products. The lower two graphs show the price ratio of gold versus gold miners and bitcoin versus bitcoin miners. Over the last two years, gold has outperformed gold miners by about 25%, while bitcoin has been beating its miners by over 50%. What gives?
Often, the performance of producers or miners of a good or commodity behaves vastly differently than the price of the goods. The product/commodity and the miners are two different investments. Miners use a great deal of resources to produce a good or commodity. Accordingly, they are subject to variable expenses. For example, interest rates are at fifteen-year highs, the cost of labor has risen significantly over the prior few years, and inflation has made the cost of machinery, tools, and transportation soar. Further, working against miners, they tend to be highly leveraged with debt. So, while a good or commodity being mined sells for a higher price, the cost of producing said good may have risen even more.
We advise that if you like gold or bitcoin, buy gold or bitcoin. Miners may be good investments, especially when the price of their product rises, but understand that the selling price of their product is just one of many aspects that account for their profitability.

What To Watch Today
Earnings

Economy

Market Trading Update
Since Michael touched on Bitcoin and gold miners, I wanted to share a section of today’s article on the speculative correlation in the market.
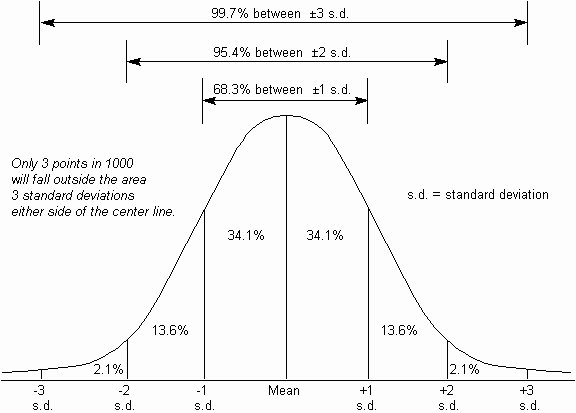
There are a couple of ways to measure exuberance in the assets. While sentiment measures examine the broad market, technical indicators can reflect exuberance on individual asset levels. However, before we get to our charts, we need a brief explanation of statistics, specifically, standard deviation.
As I discussed in “Revisiting Bob Farrell’s 10 Investing Rules”:
“Like a rubber band that has been stretched too far – it must be relaxed in order to be stretched again. This is exactly the same for stock prices that are anchored to their moving averages. Trends that get overextended in one direction, or another, always return to their long-term average. Even during a strong uptrend or strong downtrend, prices often move back (revert) to a long-term moving average.”
The idea of “stretching the rubber band” can be measured in several ways, but I will limit our discussion this week to Standard Deviation and measuring deviation with “Bollinger Bands.”
“Standard Deviation” is defined as:
“A measure of the dispersion of a set of data from its mean. The more spread apart the data, the higher the deviation. Standard deviation is calculated as the square root of the variance.”
In plain English, this means that the further away from the average that an event occurs, the more unlikely it becomes. As shown below, out of 1000 occurrences, only three will fall outside the area of 3 standard deviations. 95.4% of the time, events will occur within two standard deviations.
A second measure of “exuberance” is “relative strength.”
“In technical analysis, the relative strength index (RSI) is a momentum indicator that measures the magnitude of recent price changes to evaluate overbought or oversold conditions in the price of a stock or other asset. The RSI is displayed as an oscillator (a line graph that moves between two extremes) and can read from 0 to 100.
Traditional interpretation and usage of the RSI are that values of 70 or above indicate that a security is becoming overbought or overvalued and may be primed for a trend reversal or corrective pullback in price. An RSI reading of 30 or below indicates an oversold or undervalued condition.” – Investopedia
With those two measures, let’s look at Nvidia (NVDA), the poster child of speculative momentum trading in the markets. Nvidia trades more than 3 standard deviations above its moving average, and its RSI is 81. The last time this occurred was in July of 2023 when Nvidia consolidated and corrected prices through November.

Interestingly, gold also trades well into 3 standard deviation territory with an RSI reading of 75. Given that gold is supposed to be a “safe haven” or “risk off” asset, it is instead getting swept up in the current market exuberance.

The same is seen with digital currencies. Given the recent approval of spot, Bitcoin exchange-traded funds (ETFs), the panic bid to buy Bitcoin has pushed the price well into 3 standard deviation territory with an RSI of 73.

In other words, the stock market frenzy to “buy anything that is going up“ has spread from just a handful of stocks related to artificial intelligence to gold and digital currencies.

Japan Exiting Negative Interest Rates Risks Carry Trade Unwind
The Japanese yen and its 10-year bond yield continue to rise as there is growing speculation the BOJ may exit its negative interest rate policy shortly. The negotiation results will likely help the BOJ decide whether to hike rates next week or at the following meeting in late April. The Bloomberg graph below shows the BOJ has held its benchmark rate below zero since 2016 despite significant hikes by the Fed and ECB. In addition to possibly raising rates to zero percent or even a positive rate, there are rumors they may scrap its yield curve control program. The second graph shows that the yen has depreciated to its lowest levels compared to the dollar in the last 25 years.
For the last 20 years, investors have been borrowing yen, converting it to dollars, and investing in funds. The so-called yen-carry trade has worked out well, as their interest rates are below the U.S.’s, and the yen has declined. However, higher rates and the potential for the yen to appreciate versus the dollar may cause some investors to get out of the yen-carry trade. Such could have negative implications for those stocks and bonds investors have purchased with carry trade funds.


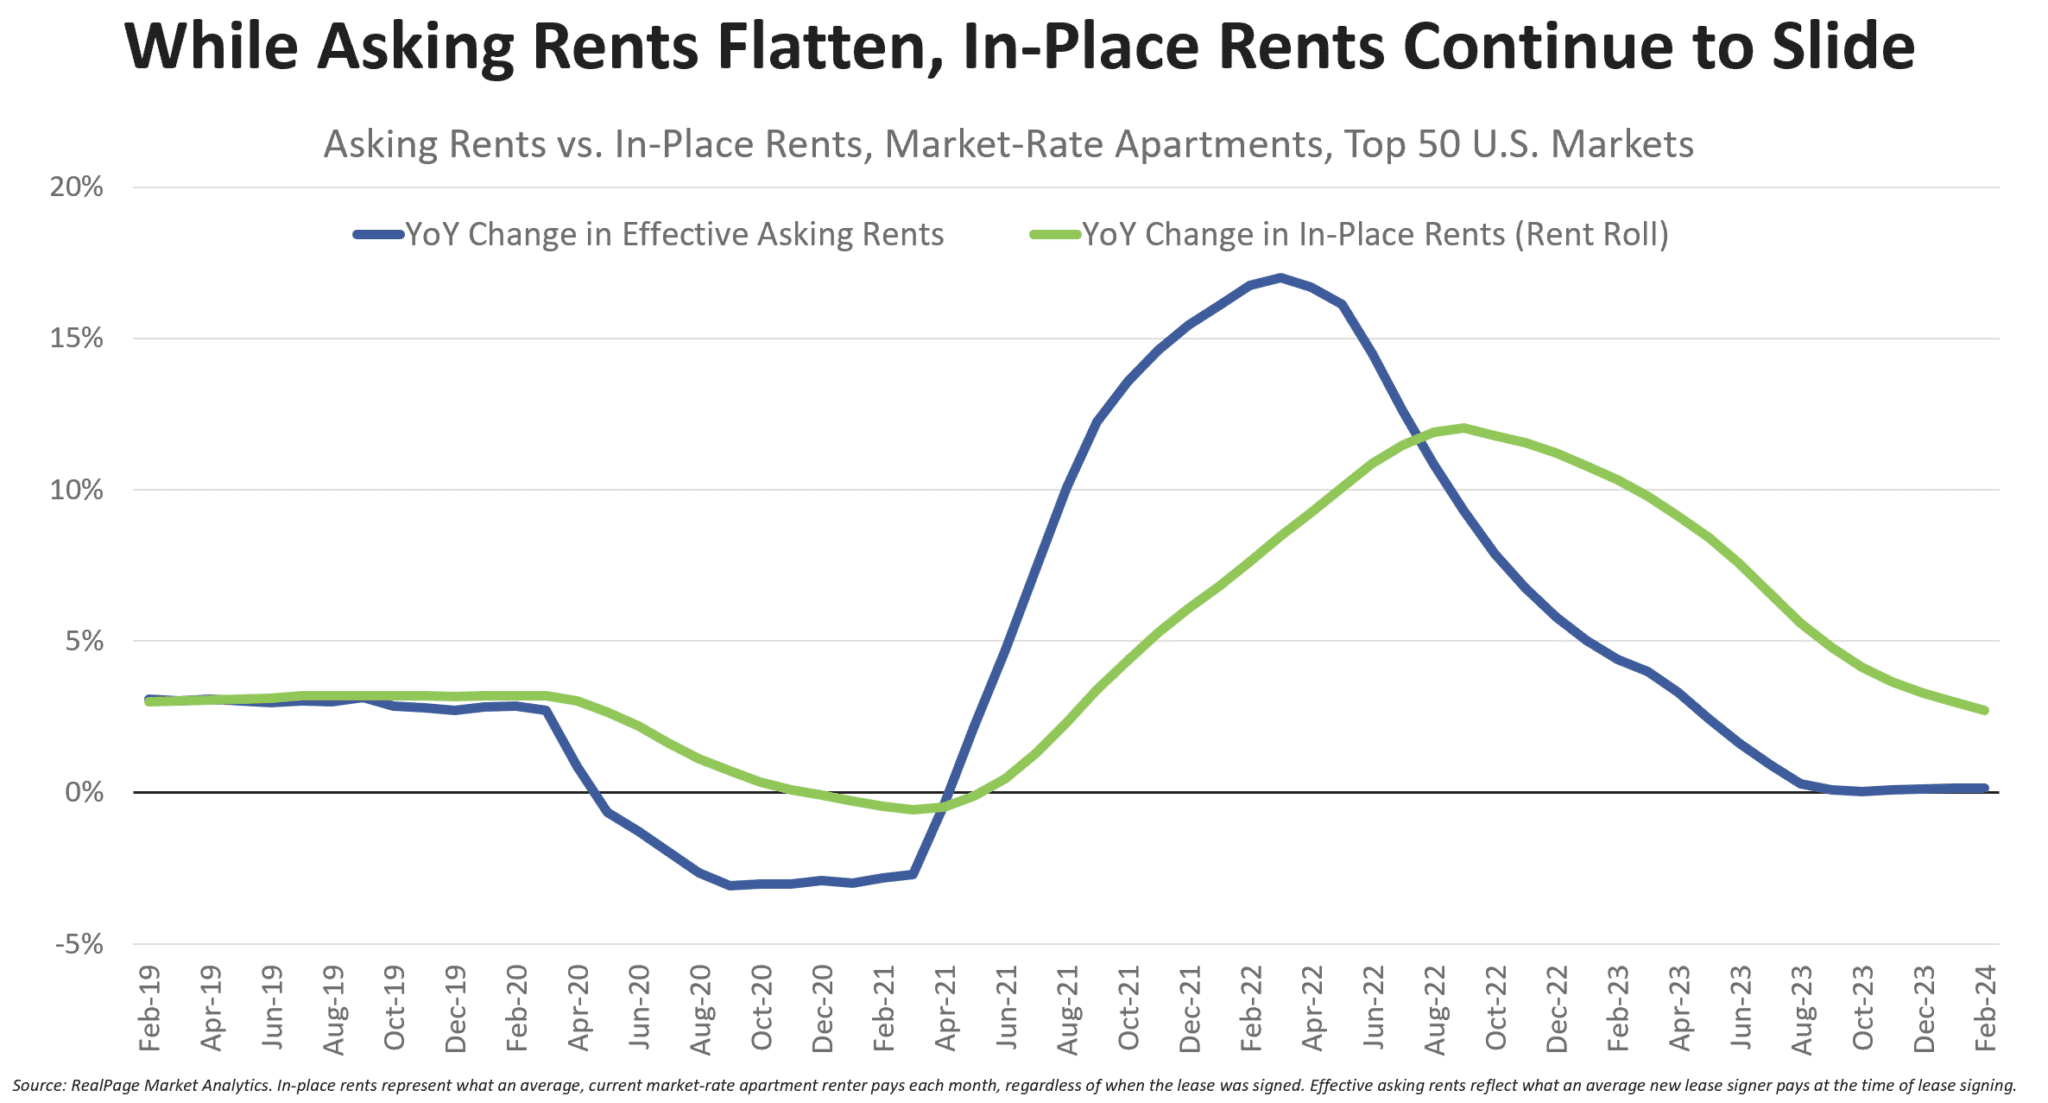
Asking Vs. In-Place Rents
In the current environment, CPI may be the most critical data point for the Fed and, therefore, markets. Therefore, it’s worth revisiting rental prices, which account for about 40% of the inflation number. We lean on Jay Parsons, a rental housing economist, to explain why CPI rental prices lag the market. The graph below goes a long way to understanding the difference. The asking rents are for new renters or those with expiring rents looking to roll their rent for a new term. In-place rents are the contractual rents being paid. They are based on existing agreements. The following commentary is from Jay.
Like the CPI’s shelter measure of “contract rents,” in-place rents lag asking rents because they include all active leases. And rents don’t change month-to-month for the vast majority of leases, so in-place rents will always lag asking rents. Ultimately, though, in-place rents have to follow asking rents (which is why we know CPI Shelter will trend further down).
As of Feb’24, in-place rents were up 2.7% year-over-year… meaning the average market-rate renter with an active lease was paying 2.7% more than the year earlier.
Compare that to this time a year ago, in Feb’23, in-place rents were up 10% YoY.
And in three major markets, in-place rents fell over the last year… meaning the average renter is paying LESS. That list: Austin, Phoenix and Las Vegas. And the list will grow– with a smattering of soft-demand California and high-supply Sun Belt markets nearing negative territory.
As in-place rents come up for renewal, new rental contracts will primarily be at similar prices or even lower. Consequently, rents, which account for 40% of the CPI number, will continue to decline, quite possibly to near zero percent growth.
Tweet of the Day

“Want to have better long-term success in managing your portfolio? Here are our 15-trading rules for managing market risks.”
Please subscribe to the daily commentary to receive these updates every morning before the opening bell.
If you found this blog useful, please send it to someone else, share it on social media, or contact us to set up a meeting.

