Wall Street wished stock investors a merry Christmas on Christmas Eve. The S&P closed Thursday over half a percent higher to set a new record high. Other than a good dose of holiday cheer, there was little news accounting for Thursday’s gains. Not surprisingly, the volume was very light on the day. After many fits and starts, it appears Wall Street was gifted yet another Santa rally and a Merry Christmas. Bond traders were not privy to the holiday cheers as bond yields rose across the yield curve in a holiday-shortened session.
We wish you and yours a merry Christmas and happy holidays!

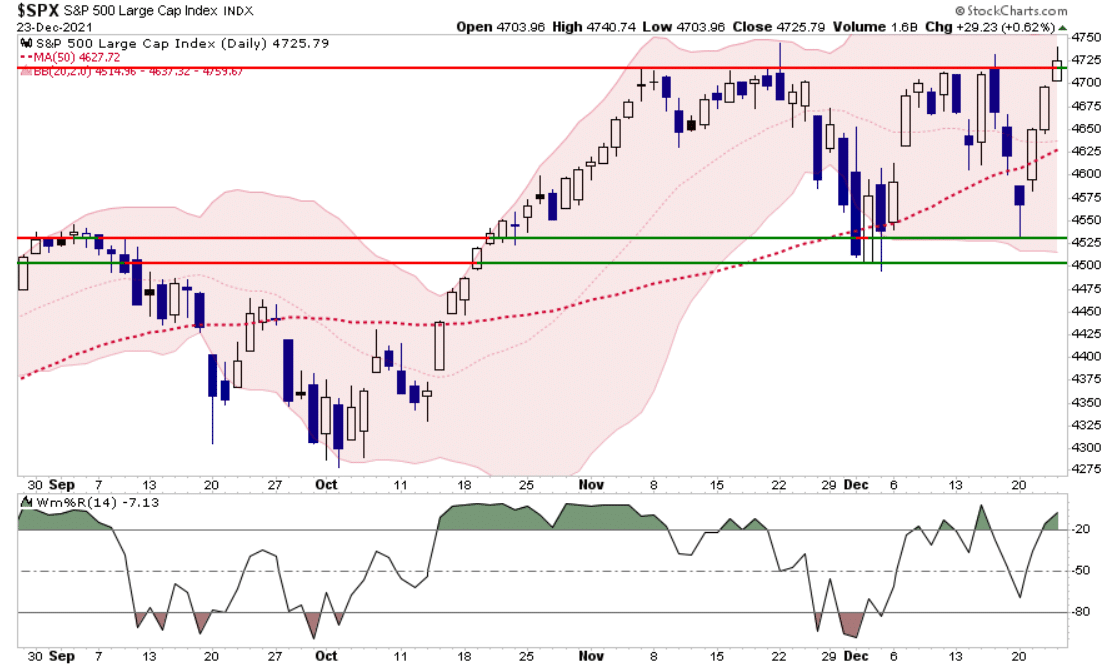
3-Days Down Erased By 3-Days Up
Well, that didn’t take long to play out. After increasing our equity exposure during the previous sell-off, the rapid 3-day sell-off was completely reversed in 3-days. Light volume rallies are not confidence-inspiring, but as we head into the last trading week of the year, further gains are not unlikely. With the market back to over-bought, we will look to take some gains and reduce our overweight equity exposure back to targets.
In the meantime, it has been a very nice “Merry Christmas” rally.
The Week Ahead
Another holiday-shortened week will likely lead to another quiet week. There is little economic data due this week. Of note will be the Chicago PMI report on Thursday. Expectations are for a slight increase, pointing to continued above-trend growth in the manufacturing industry. New Orders, Inventory, and prices will be closely followed for their effect on inflation. The Dallas Fed and Richmond Fed Indexes, reported today and tomorrow, may provide a few hints about the Chicago PMI report. We are expecting little from the Fed-speaking circuit.
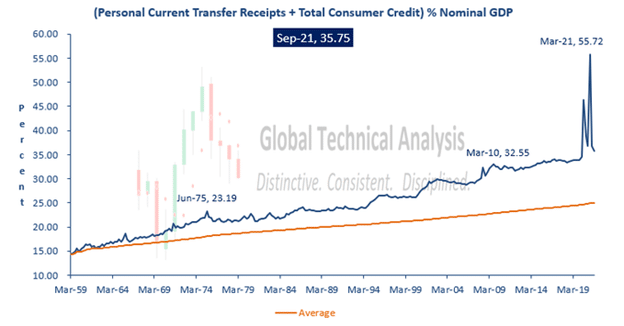
Incomes are Lagging Inflation
Personal Consumption makes up about two-thirds of GDP activity. As such, personal income and spending play a crucial role in forecasting GDP. Personal Income for November rose 0.4%, down 0.1% from October. Personal Consumption rose 0.6%, a decent decline from October’s 1.4%. The monthly PCE Price Index rose 0.6%. Essentially the rise in Consumption is 100% a function of inflation, not buying more goods and services. Further, with incomes rising less than Consumption, the latest report highlights that other sources of money, such as credit cards, savings, or home refinancings, are being used to support Consumption. The graph below from Brett Freeze provides context for the massive role fiscal stimulus and credit played over the last two years and how it is normalizing rapidly.
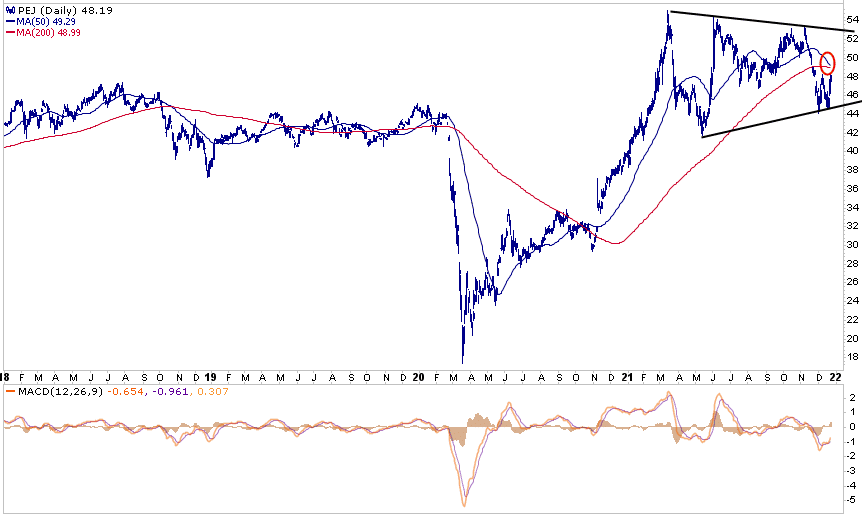
Tracking Market Sentiment of Omicron
Invesco’s Dynamic Leisure and Entertainment ETF (PEJ) provides a proxy for the hardest-hit industries from Covid and the associated lockdowns. We can follow it to help measure investor sentiment regarding the latest Omicron variant. As we show, it stumbled nearly 20% through November, but its price stabilized in December despite Omicron raging. The ETF is consolidating in a wedge pattern on a longer-term technical basis, following a sharp recovery to new highs in 2020 and early 2021. Barring more lockdowns due to Omicron or other variants, we suspect PEJ will oscillate in the wedge. A break above would be very bullish, while a break below bearish. Working against the near-term technicals is the 50 and 200 dmas are about to cross. Such “death crosses” are a bearish indicator. However, for the bulls, the MACD is turning up from low levels.
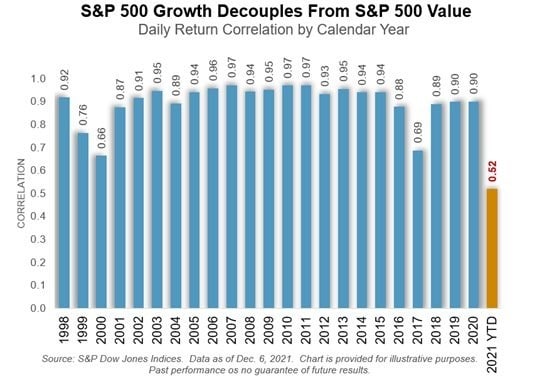
Is Value’s Day in the Sun Coming?
The graph below, courtesy of Callum Thomas, shows the correlation of value and growth stocks in 2021 is the lowest in 20 years. The last time it was near current levels was in 2017 and 1999/2000. In the late 90s, growth was grossly outperforming value. That reversed when the tech bubble burst in 2000. Value considerably outpaced growth in 2000. Per Callum- “I would actually consider this another extreme, and possibly another indicator of a prospective turning point.” The second graph comes from our article – An Investment Playbook for Thriving During the Next Market Crash. It shows growth stocks considerably outperformed value stocks in the late 90s. That outperformance was reversed in the following few years. The article compares value versus growth and how the dynamics are eerily similar today, as in the late 90s and early 2000s.

Please subscribe to the daily commentary to receive these updates every morning before the opening bell.
Also Read