


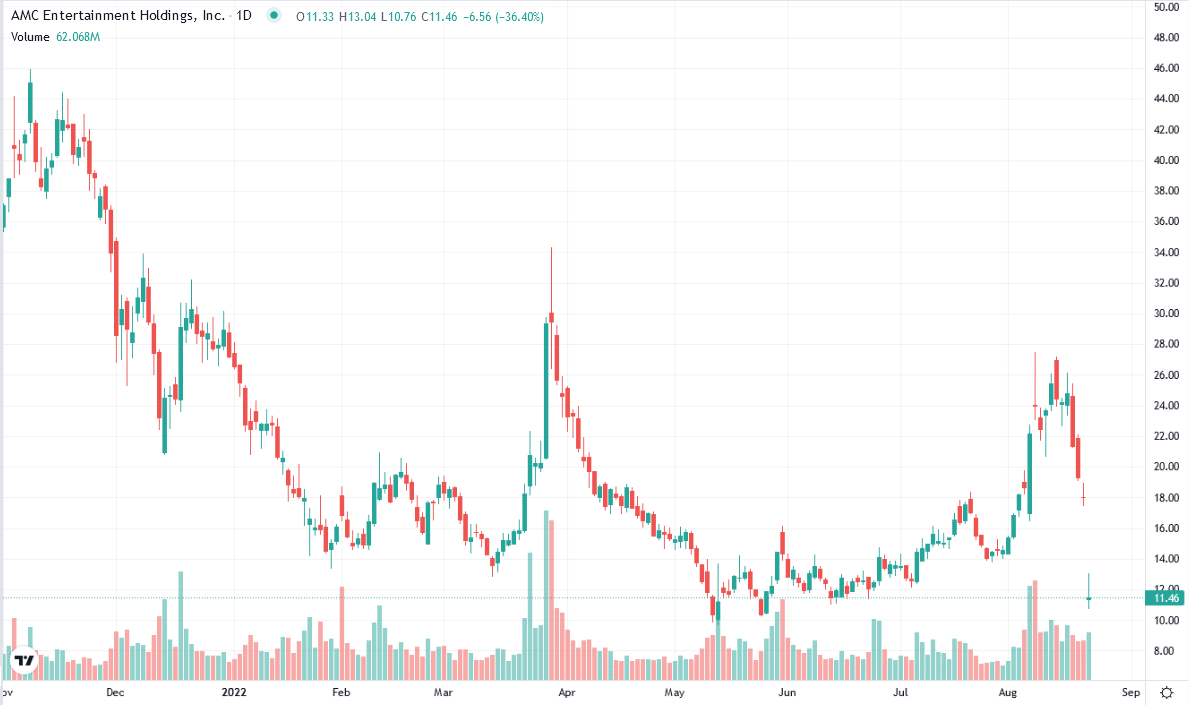
In Monday’s commentary, we discussed how Bed Bath & Beyond (BBBY) shares rose almost five-fold in the first two weeks of August only to give it back in the last few days. AMC, another popular “meme” stock, is following a very similar pattern. AMC closed the month of July at $14.56 a share. It nearly doubled in the two weeks following. Since then, AMC has plummeted back to two-month lows. AMC, BBBY, and other meme stocks are not fundamentally strong companies. In fact, it appears BBBY is struggling to get vital financing to avoid filing for bankruptcy. Meme stocks, like AMC and BBBY, are purely speculative plays. Hedge funds and retail traders are trying to outwit each other using options strategies to move the stocks violently.
While interesting from the sidelines, the benefit of watching the Meme stocks’ ups and downs is to help gauge sentiment. Sentiment appears to be shifting again toward more conservatism after FOMO, and wild meme speculation led the markets higher in June, July, and early August.

What To Watch Today
Economy
- S&P Global U.S. Manufacturing PMI, August preliminary (51.9 expected, 52.2 previously)
- S&P Global U.S. Services PMI, August preliminary (50 expected, 47.3 previously)
- Richmond Fed manufacturing index, August (-5 expected, 0 previously)
- New home sales, July (-2.5% expected, -8.1% previously)
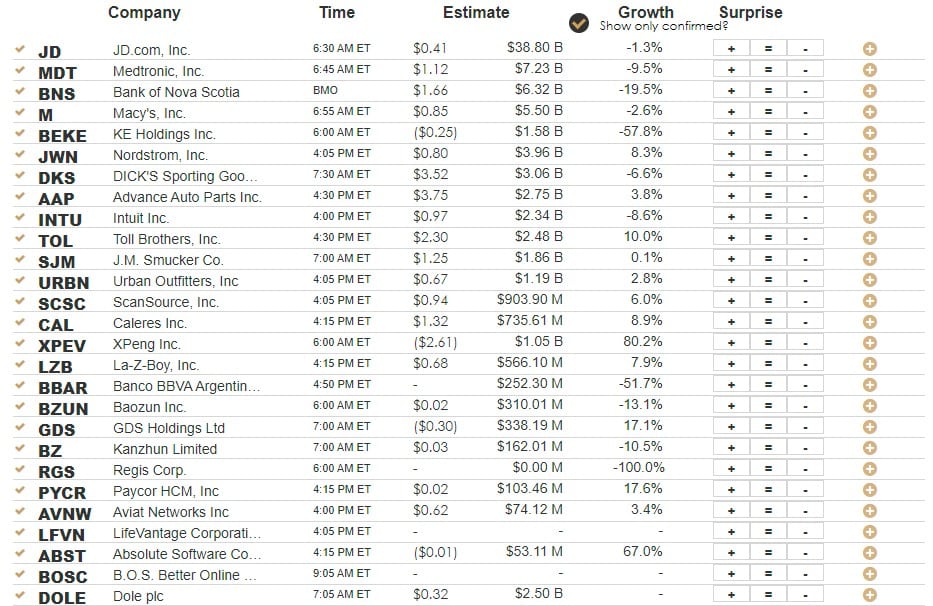
Earnings
Market Trading Update
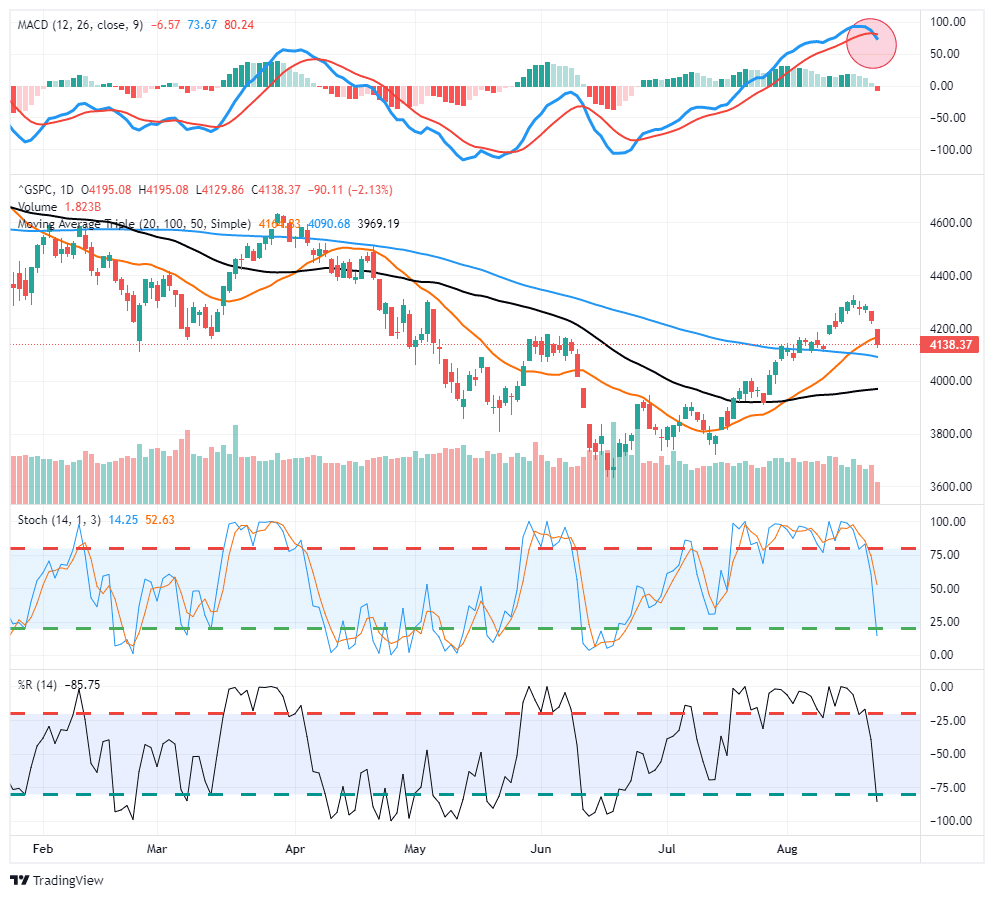
Last week, we discussed the extreme overbought condition of the market and that a pullback to support was needed. In Saturday’s Bull Bear Report (subscribe here), we laid out three levels of support for a pullback: 1) The 100-dma, 2) the 50-dma, and 3) the 50% retracement of the rally. Yesterday, the markets broke the short-term support at the 20dma and triggered a MACD sell signal. With markets not yet back to more extreme oversold levels and the MACD still very elevated, the test at the 100-dma will be important for the market to hold. As noted previously, a break of the 50-dma and the markets will retrace to the previous lows.
What’s Leading the Industrials Sector
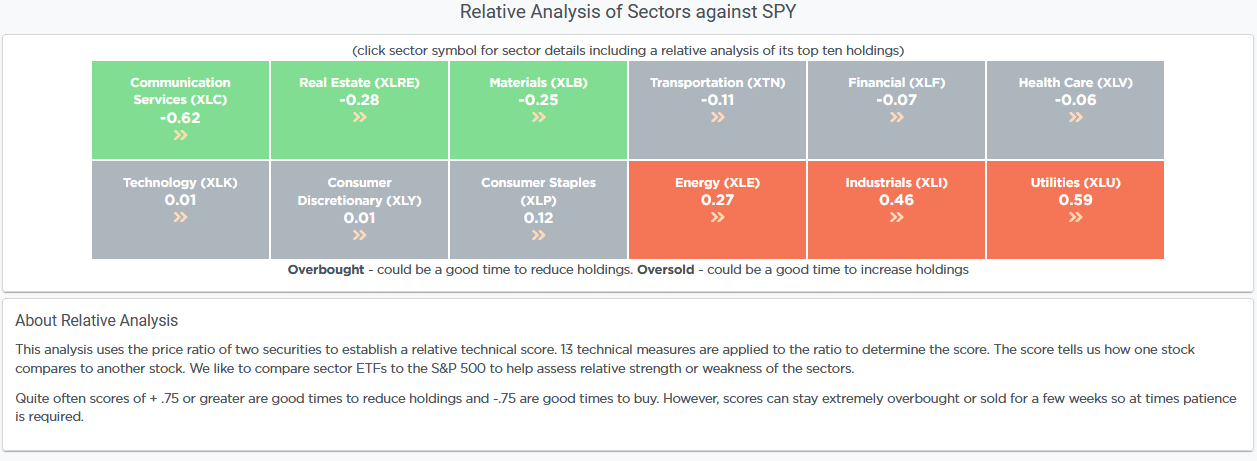
With the market declining, the usual conservative sectors like staples and utilities continue outperforming. Interestingly, Industrials have been doing better on a relative basis as well. In SimpleVisor, we just introduced a new comparative analysis tool to help us see which sectors are out or underperforming the S&P 500. The analysis also digs into each sector’s top holdings to better appreciate what drives the sectors.
The graphic below shows which sectors are overbought (red) versus the S&P 500, which are neutral (gray), and which are oversold (green). As we show, Industrial is the second most overbought sector.
The following table breaks down the top ten Industrials ETF (XLI) holdings and compares each stock against each other and against the XLI ETF. Reading horizontally across the table, you will find that MMM, as compared to Deere (DE), is the most oversold pair in this analysis. Also, UPS is overbought against six of the nine other stocks. DE appears to be the most overbought stock as every other stock is oversold against it. While this analysis is just one of many tools we use, it helps us highlight sectors and their holdings trading at extremes to the market or other stocks within their sector. We also added a tool that allows users to compare any two stocks, ETFs, mutual funds, and indices.
We have been successfully using this tool internally for a while and are thrilled to roll it out to SimpleVisor subscribers. The tool is still in Beta mode as we add more functionality to it in the coming weeks.

Bear Market Rallies
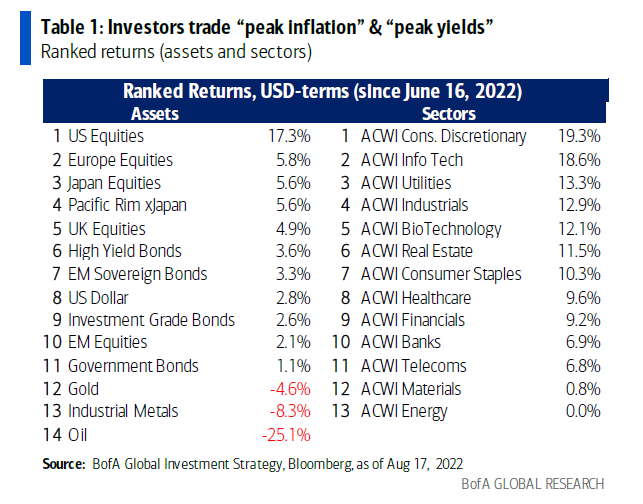
The question vexing investors is whether or not we are in a bear market rally or still in a longer-term bull market. The table below from BofA helps put the current rally into proper historical context. BofA studied 43 bear market rallies (>10%) and found that since 1929 the average gain was 17.3%, lasting 39 days. The current rally is very average, peaking at 17.4% in 41 days. Bear market rallies tend to be “narrow” or led by only a few stocks, markets, and sectors. Consider that in this rally, just four stocks (AAPL, MSFT, AMZN, TSLA) contributed 30% of the S&P 500 gain. Six of the sectors had returns of half or less of the S&P 500, and foreign market returns were in the mid-single digits at best. So far, the current rally meets all of the qualifications of a typical bear market rally.
Tweet of the Day

Please subscribe to the daily commentary to receive these updates every morning before the opening bell.
If you found this blog useful, please send it to someone else, share it on social media, or contact us to set up a meeting.
Also Read


