


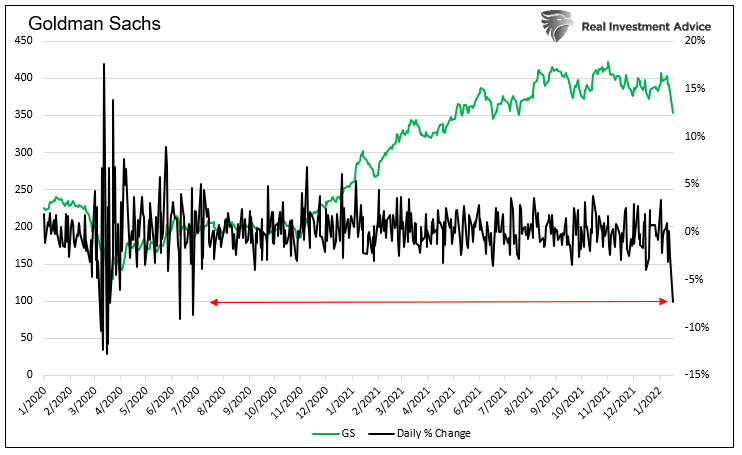
Shares of Goldman Sachs tumbled Tuesday as earnings fell $1.30 short of expectations and were flat versus last year’s earnings. The 7% decline in its shares is the largest since June 2020, as shown below. Goldman Sachs shares follow JPM’s 5% tumble last week on its weaker than expected earnings.
Like some other large banks such as JPM and Citi, operating expenses are weighing on earnings. Goldman Sachs expenses soared 33% last year, with compensation and benefits being the largest contributor. Expenses would have declined 9% without the changes in wages. We suspect many more companies will fall short on earnings as they can’t offset rising wages with revenue.

What To Watch Today
Economy
- 7:00 a.m. ET: MBA Mortgage Applications, week ended January 14 (1.4% during prior week)
- 8:30 a.m. ET: Building Permits, month-over-month, December (-0.8% expected, 3.6% during prior month, upwardly revised to 3.9%)
- 8:30 a.m. ET: Housing Starts, month-over-month, December (-1.7% expected, 11.8% during prior month)
Earnings
Pre-market
- 5:55 a.m. ET: UnitedHealth (UNH) to report adjusted earnings of $4.31 on revenue of $72.95 billion
- 6:45 a.m. ET: Bank of America (BAC) to report adjusted earnings of 76 cents on revenue of $22.23 billion
- 7:00 a.m. ET: Procter & Gamble (PG) to report adjusted earnings of $1.65 on revenue of $30.35 billion
- 7:30 a.m. ET: Morgan Stanley (MS) to report adjusted earnings of $1.94 on revenue of $14.44 billion
- 7:30 a.m. ET: State Street (STT) to report adjusted earnings of $1.88 on revenue of $3.00 billion
Post-market
- 4:20 p.m. ET: Discover Financial (DFS) to report adjusted earnings of $3.76 on revenue of $3.01 billion
- 4:30 p.m. ET: United Airlines (UAL) to report adjusted losses of $2.11 on revenue of $7.95 billion
Be Careful Selling The Dip
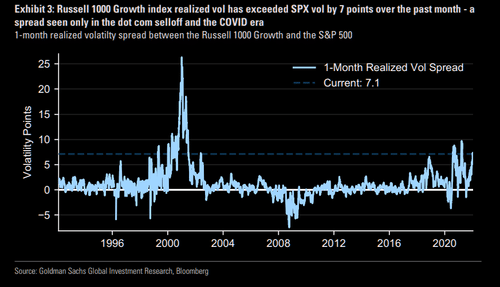
Despite the tumble in Goldman Sachs shares, and banks in general, as well as most everything else particularly in the tech space, be careful not to panic sell the dip. As shown below, via TheMarketEar, the extreme spread between Russell 1000 growth and SPX realized volatility is extreme. The current level was only seen during the COVID era and the 2000 bubble.
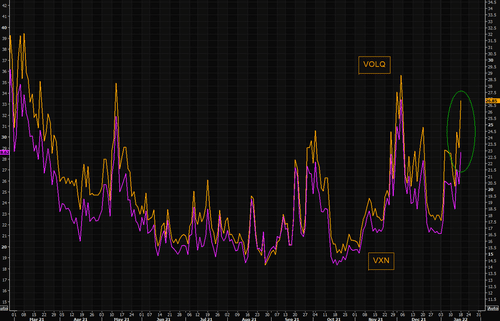
Furthermore, the Nasdaq is very stressed and volatility is at levels normally where at least a short-term bottom forms. The chart is based on “at the money” options (the two nearest in-the-money and out-of-the-money puts and calls for the next four weekly expirations). This is how VIX was calculated “back in the days” and it is trading very squeezed again. (H/t TheMarketEar)
Another Sign of a Bubble
The graph below from Charles Schwab shows that 15% of the S&P 500 companies have a price-to-sales ratio of greater than 10. That is nearly double the number from before the pandemic and the peak of the dot com bubble in 1999.
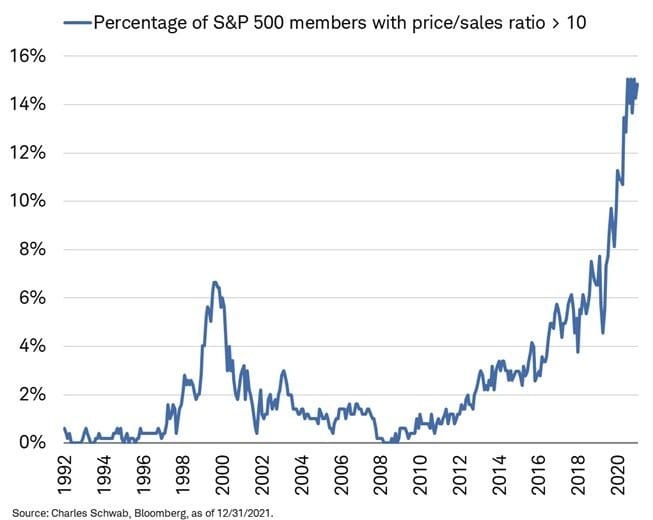
To highlight what a P/S ratio of 10 entails, we quote Scott McNeely, the CEO of Sun Microsystems, from 1999.
“At 10 times revenues, to give you a 10-year payback, I have to pay you 100% of revenues for 10 straight years in dividends. That assumes I can get that by my shareholders. It assumes I have zero cost of goods sold, which is very hard for a computer company. That assumes zero expenses, which is really hard with 39,000 employees. That assumes I pay no taxes, which is very hard. And that assumes you pay no taxes on your dividends, which is kind of illegal. And that assumes with zero R&D for the next 10 years, I can maintain the current revenue run rate. Now, having done that, would any of you like to buy my stock at $64? Do you realize how ridiculous those basic assumptions are?”
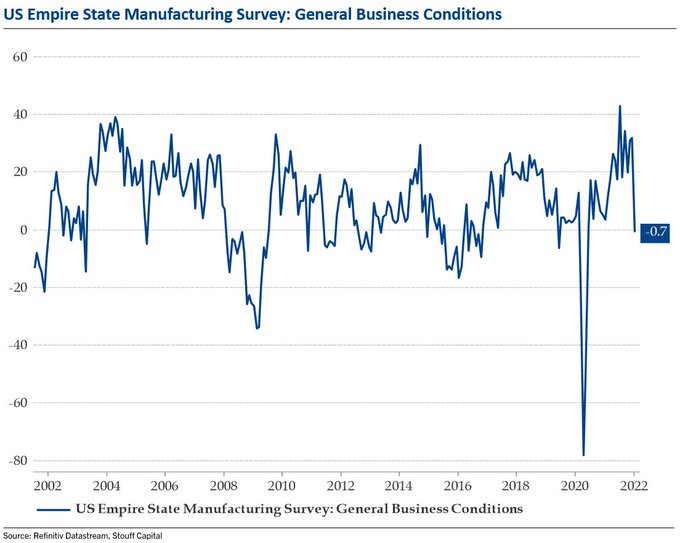
Empire State Is In Contraction
The New York Fed’s U.S. Empire State Manufacturing Index fell to -0.7 and is pointing to economic contraction as it’s now below 0. The sharp decline from 31.9, as shown below, is the third-largest monthly drop since the early 2000s. New Orders, a key factor driving future growth, slumped to contraction at -5.0. Prices paid and prices received fell slightly but remained at very high levels. Future expectations for both price gauges rose.
While the report appears dour, forward expectations remain high at 35.1. We guess that Omicron may be the cause for the sharp decline in the current index.
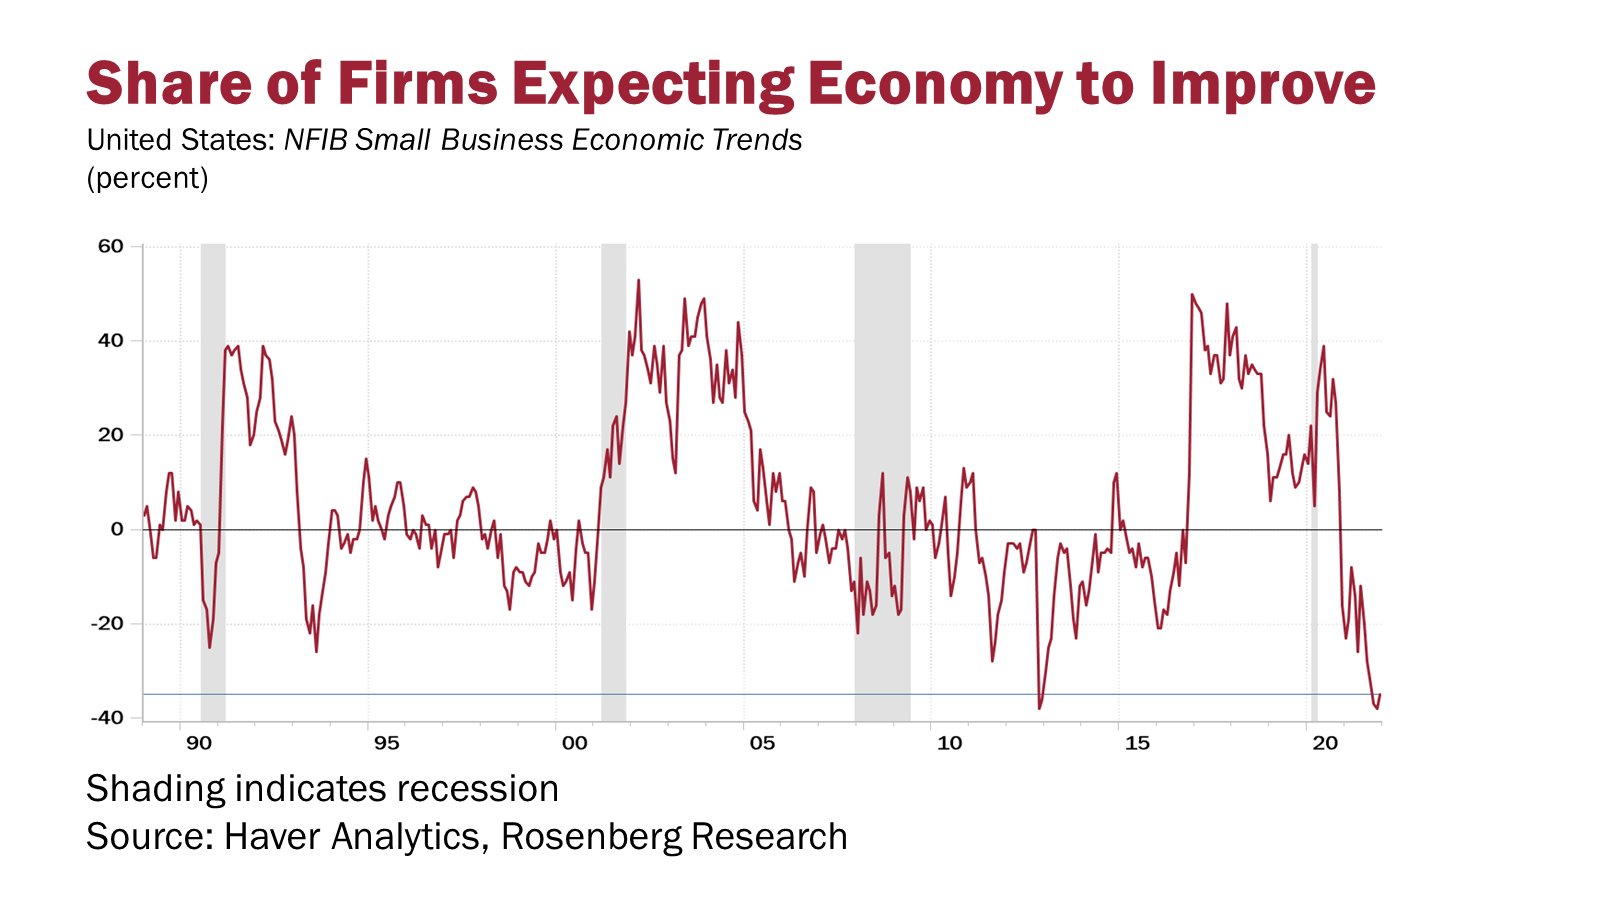
Small Businesses Have Weak Expectations
The following quote and graph come courtesy of David Rosenberg.
“I was watching former Fed VC Alan Blinder struggle on CNBC to explain how Treasury yields could have the temerity to stay so low. I wanted to send him this chart. Econ expectations from the small-biz sector are lower today than at the trough of all 5 prior recessions!”
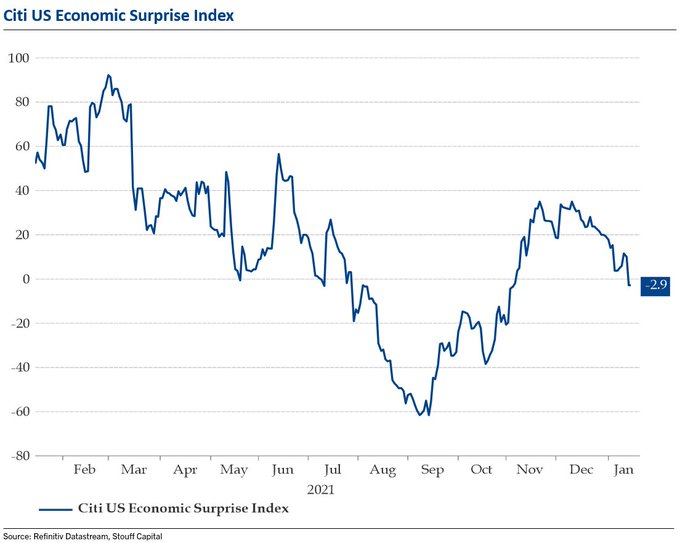
Surprise Surprise
As we show below, the Citi Economic Surprise Index is back below zero. The index measures how economists aggregated economic data forecasts fared versus the actual data. A declining index means they are overestimating economic growth. To wit, recent ISM, Payrolls, and Retail Sales data were well below expectations. The index tends to oscillate over time as economists over or underestimate economic activity.
Please subscribe to the daily commentary to receive these updates every morning before the opening bell.
Also Read


