


The Fed pays a lot of attention to financial stability or market functioning, and they will take action in the event of financial instability. Given the lessons learned in 2008 and the massive leverage within the markets and economy, the Fed’s radar for financial instability is particularly sensitive. It is not necessarily yield levels that alert the Fed but yield spreads.
Spreads are the differences between non-treasury bond yields and Treasury yields. The graph below shows financial instability is potentially starting to occur. Junk bond spreads to Treasuries have increased recently. In historical context, the recent move is minor, but it can change quickly, as we saw in 2008 and 2020. Corporate and municipal yield spreads bear watching closely.


What To Watch Today
Economy
- No notable reports are scheduled for release
Earnings
Pre-market
- Booz Allen (BAH) to report adjusted earnings of 85 cents on revenue of $2.2 billion
- Deere (DE) to report adjusted earnings of $6.70 on revenue of $13.24 billion
- Foot Locker (FL) to report adjusted earnings of $1.53 on revenue of $2.19 billion
Post-market
- No notable reports are scheduled for release
Market Trading Update – Holding Lows Is Good News.
Speaking of financial instability, Wednesday was a brutal beating after the previous advance. However, the market held its previous lows and rallied at one point turning positive for the day. There are a lot of “trapped longs” that are getting very frustrated and selling every rally. Eventually, we will exhaust the majority of sellers and a broader reflexive rally will take hold. However, for now, the trend is down, and stocks continue to face stiff resistance on every rally. Use opportunities to raise cash and rebalance risks accordingly.

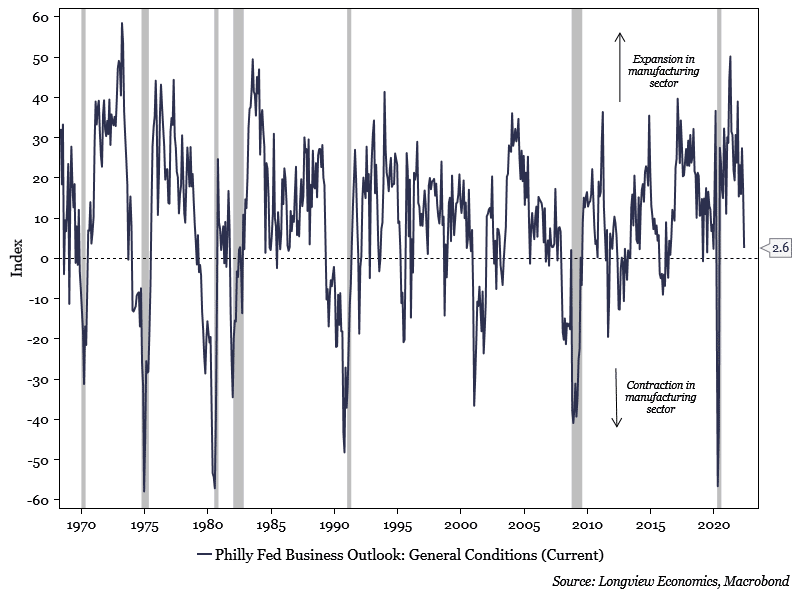
Another Poor Regional Survey
The Philadelphia Fed Manufacturing Index, like the Empire State Index, came in well short of expectations. The index is now 2.6, down from 17.6 and expectations of 16.5. As shown below, the index still signals manufacturing expansion, but just barely so. The index fell to its lowest level in two years. The good news within the survey is that prices paid fell; however, they remain at a very high level. Unlike most other surveys, new orders also rose. The bad news is that employment fell sharply from 41.4 to 25.5.
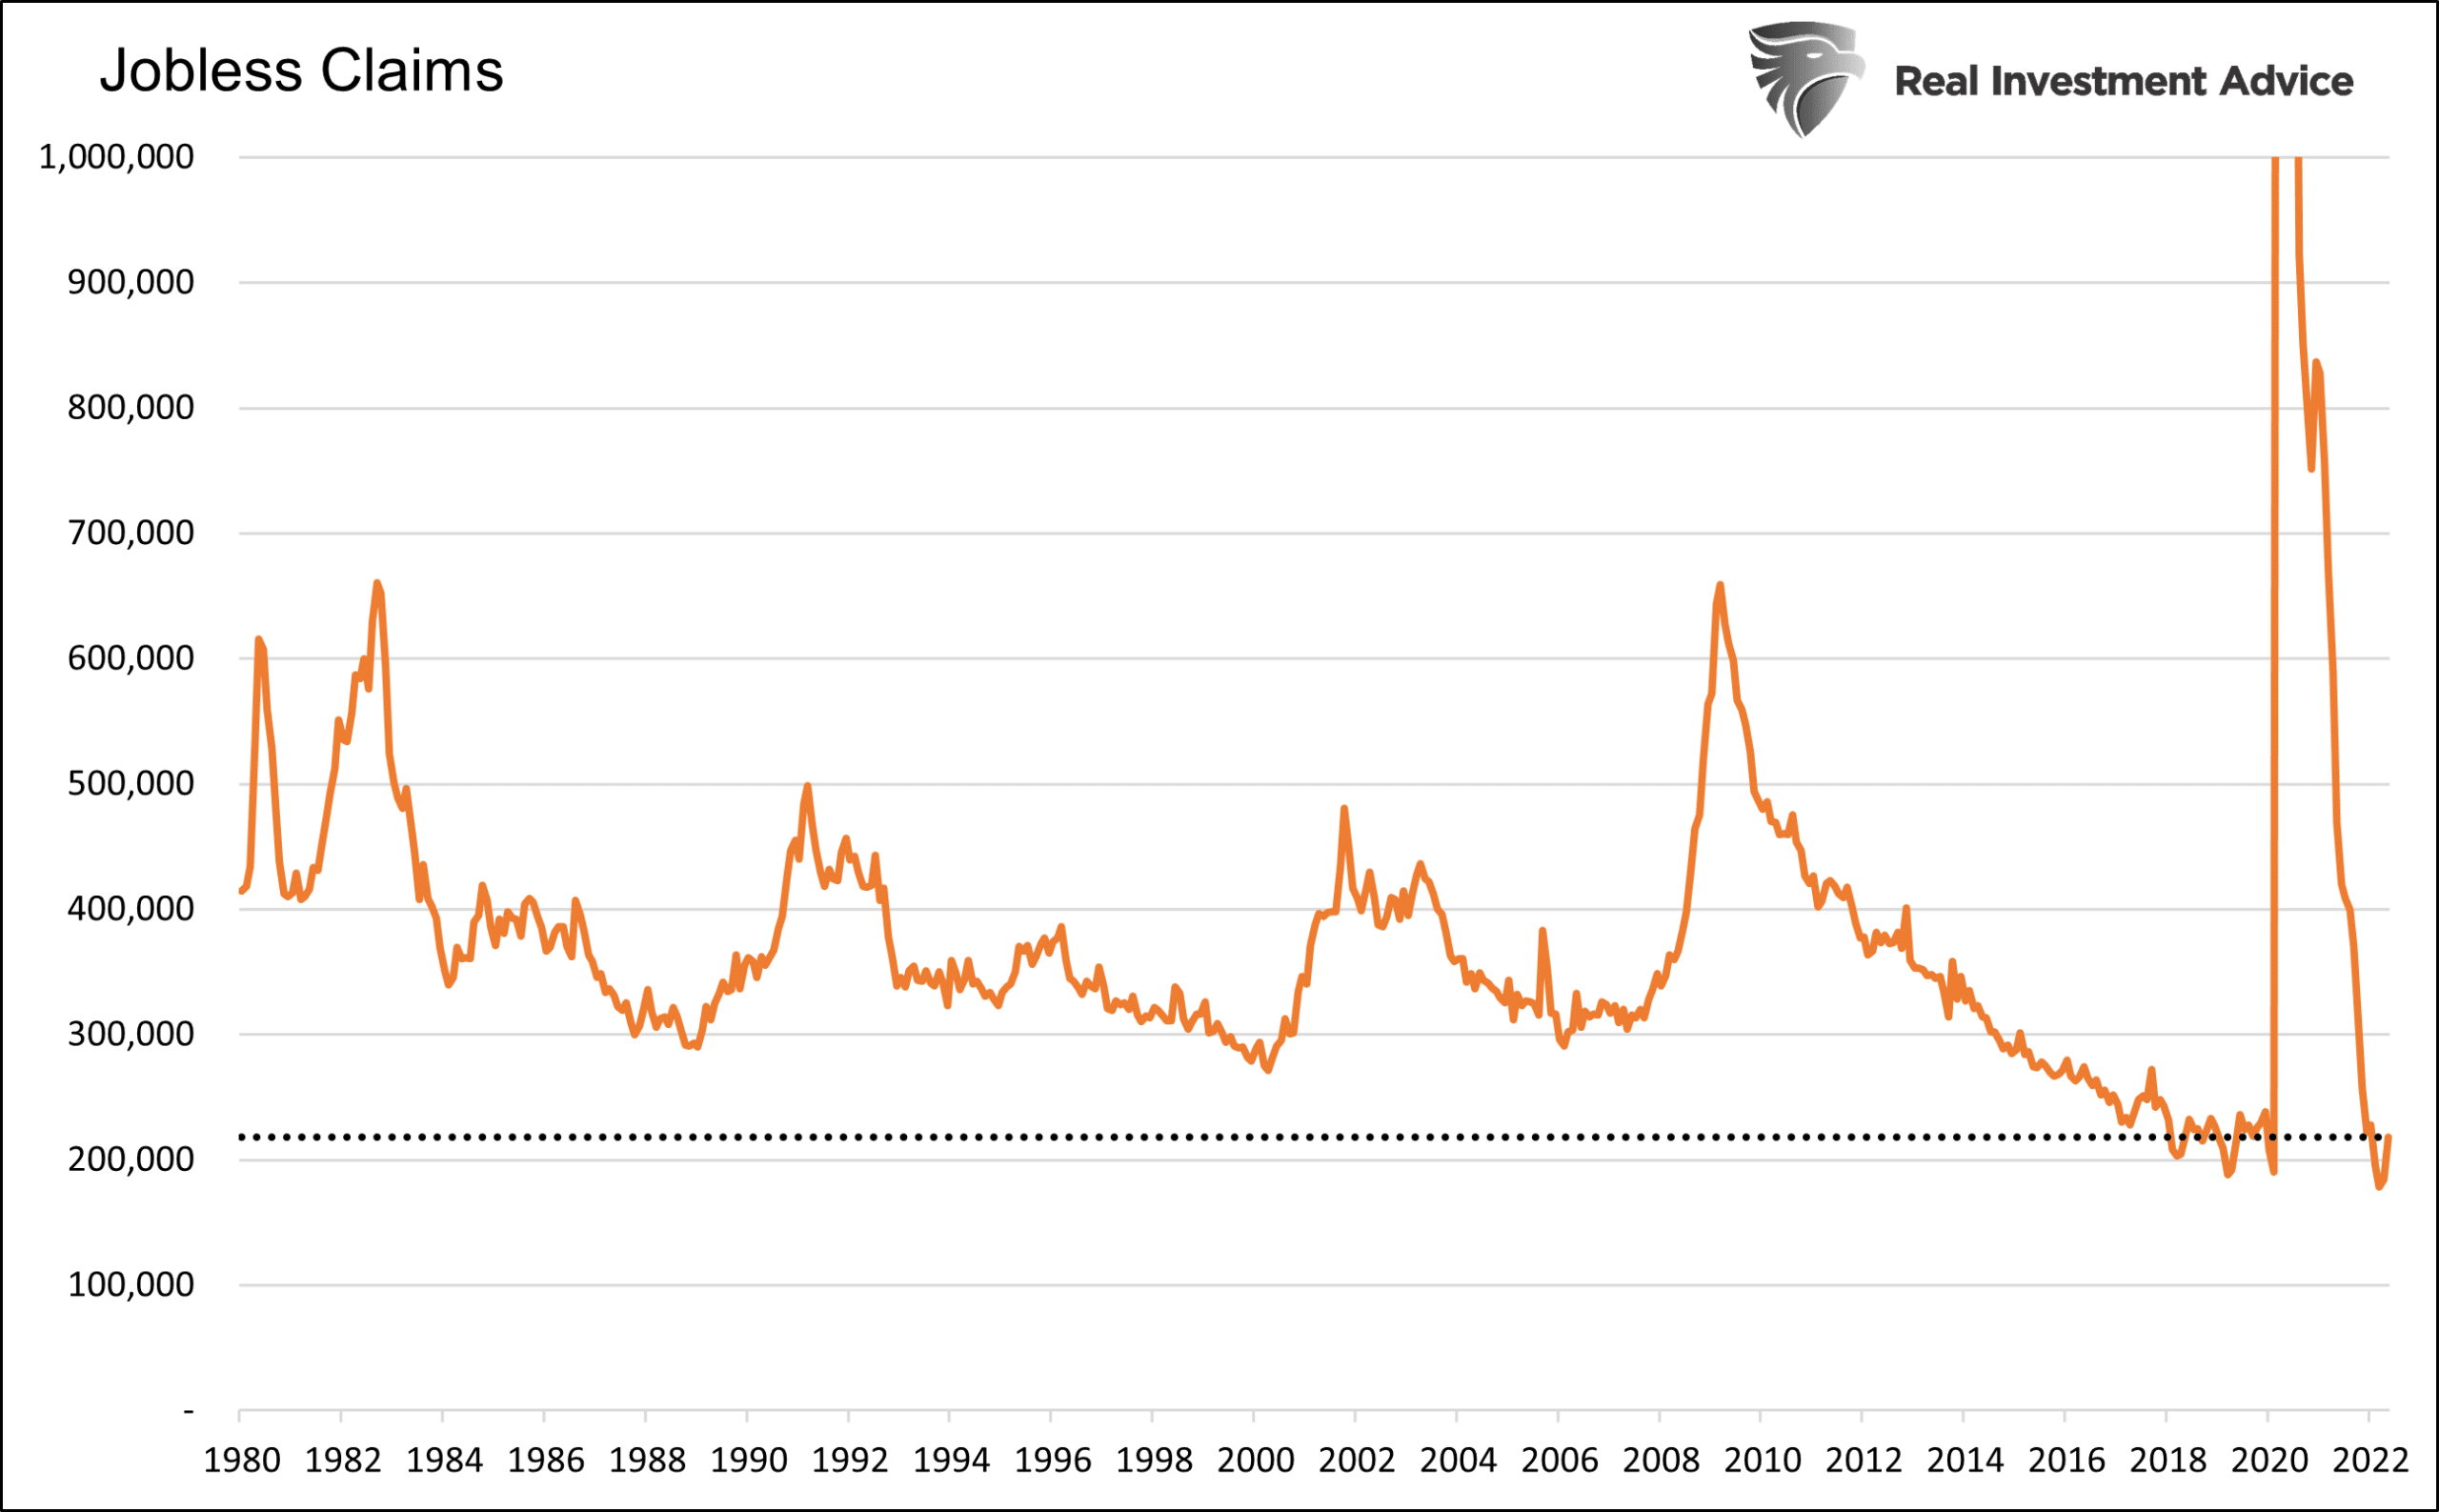
Initial Jobless Claims
Weekly jobless claims data can be a good indicator of economic activity. Layoffs tend to occur before recessions as employers react to declining sales. In this environment, jobless claims data may be tougher to decipher. For starters, it has been exceedingly difficult for employers to hire over the last year. As such, they may hold onto employees longer than is typical. Second, jobless claims a month ago were at levels last seen 50 years ago and remain well below pre-pandemic averages. An uptick in a good economic environment would not necessarily be a warning but a normalization.
On Thursday, jobless claims rose to their highest level (218k) in the past three months. We present the graph below to help put some perspective on the recent increase in jobless claims. As shown, it has upticked, but it’s still much lower than most instances in the last 40 years. That said it is back in line with the pre-pandemic (2018-2019) averages.
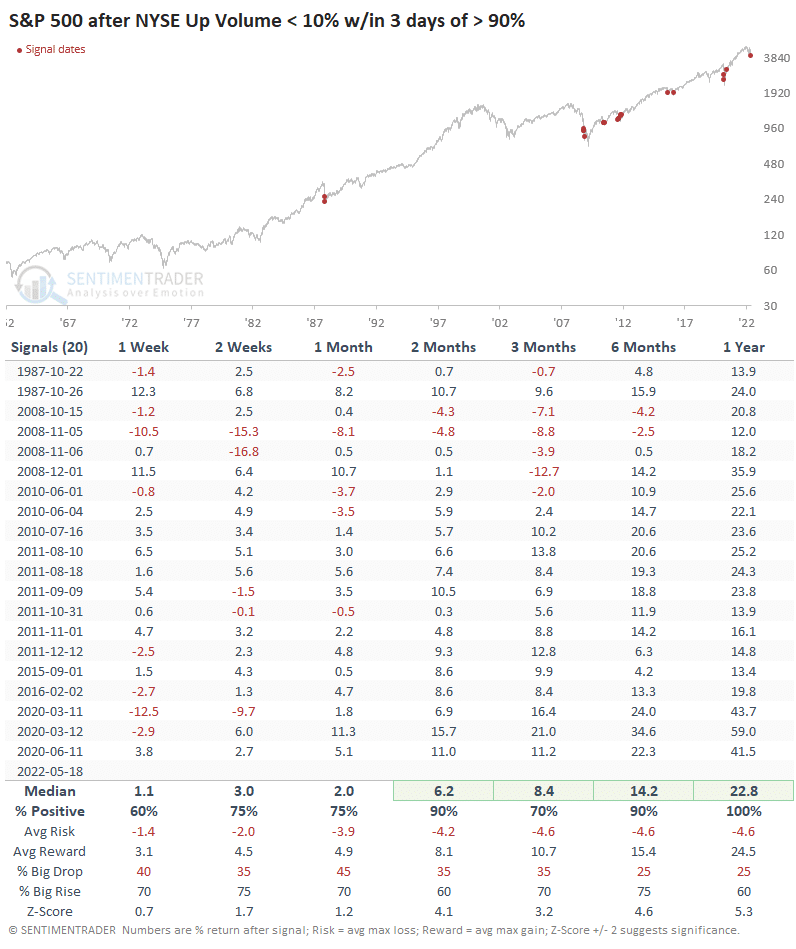
A Historic Cluster Of Selling Pressure
“This is probably the most brutal market I’ve encountered in 20 years of publishing, 30 years of investing, and 80 years of data history. The 1930s were more consistently and more egregiously difficult, and maybe the 1970s could rival it. But in terms of value destruction and lack of alternative investments holding value, this will rank among the worst several months for investors ever.
The sheer overwhelming selling pressure has been remarkable. When stocks drop, almost everything drops. And volume has been almost entirely one-sided. Wednesday marked the third session in ten days when less than 10% of NYSE volume flowed into advancing securities.” – Sentiment Trader
How Oversold is the Market
Jeff Marcus from TPA provides SimpleVisor clients with his unique brand of analysis. Today he writes the following about the market’s current oversold condition.
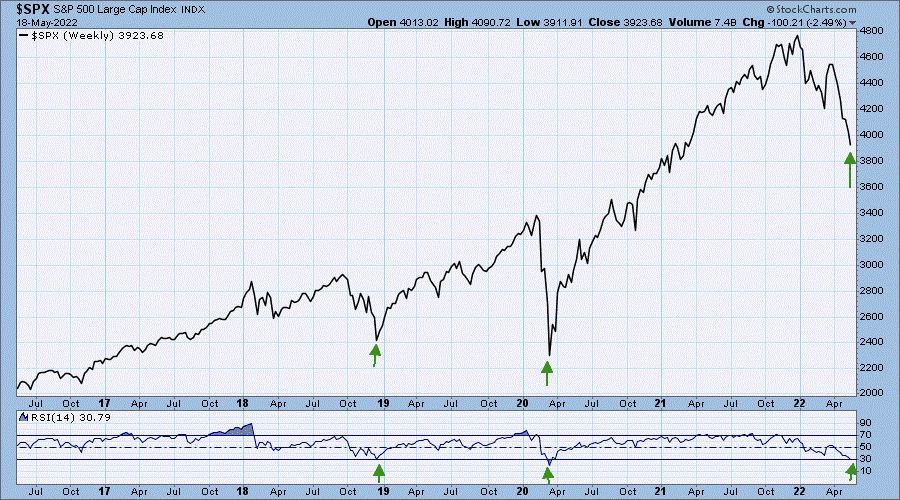
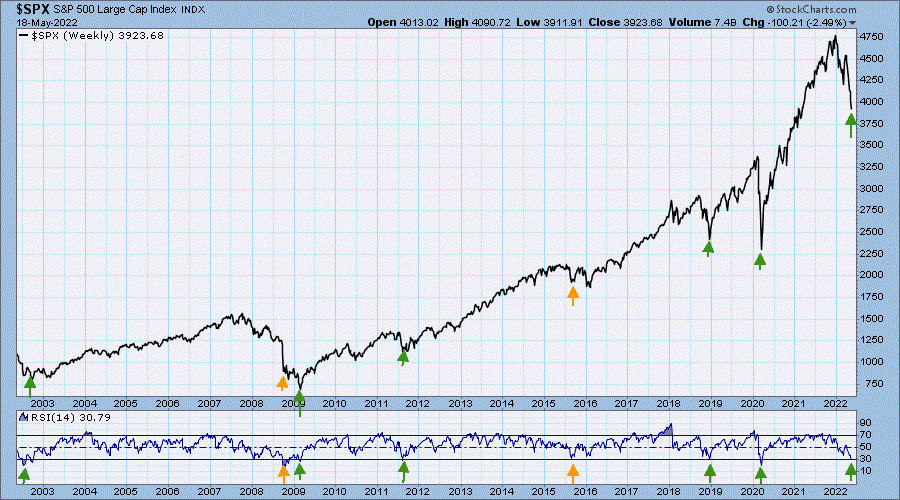
The S&P500 is Oversold on a Long-Term Basis
The S&P500 has hit an oversold milestone on a long-term basis. The 14-week RSI of the S&P500 is now 30.79. The chart below shows that the S&P500 has only had a 14-week RSI of 30 or lower 2 other times in the past 5 years; the end of 2018 and March 2020. Both of those milestones provided buying opportunities for investors.
Chart 2 goes back 20 years to look at the S&P500 and its long-term RSI. 5 of the previous 7 or 71% of the time, those oversold conditions were buy signals. Even when the signal did not work immediately, it signaled proximity to a market low.
Please subscribe to the daily commentary to receive these updates every morning before the opening bell.
If you found this blog useful, please send it to someone else, share it on social media, or contact us to set up a meeting.
Also Read


