


Thanks to the FAANG stocks, the S&P 500 and NASDAQ were higher on the day. AMZN (+4.15%), AAPL (+2.85%), and GOOGL (+1.22%) led the charge for the FAANG stocks. Most other stocks were not so lucky. The Dow, equal-weighted S&P (RSP), and the Russell 2000 closed in the red. As we show below, the market’s breadth was poor. 10 of the 11 S&P sectors were lower, and five of them fell by about half a percent or more. Further, two-thirds of S&P 500 stocks are down on the day despite a .35% gain. Bad breadth in an upward trending market can signal weakness ahead, so stay tuned.


What To Watch Today
Economy
- No notable reports scheduled for release
Earnings
- No notable reports scheduled for release
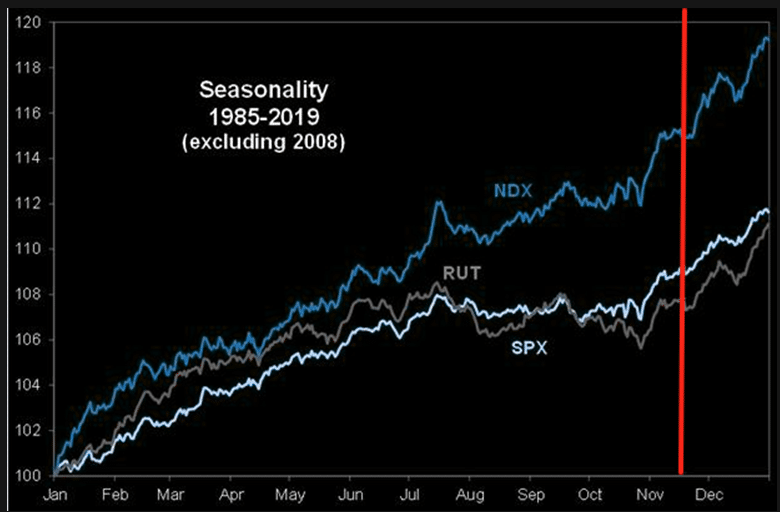
Seasonality Is Strong But Watch The First Two Weeks Of December
Seasonality has certainly held strong this year as stocks continue to push higher. As shown in the chart below, such bodes well for an end-of-the-year “Santa Claus Rally.” However, before we get these, note that the first couple of weeks of December tend to sport a correction as Mutual Funds distribute their capital gains, interest, and dividends for the year. That pullback will set the market up for the traditional rally to close out the year on a strong note.
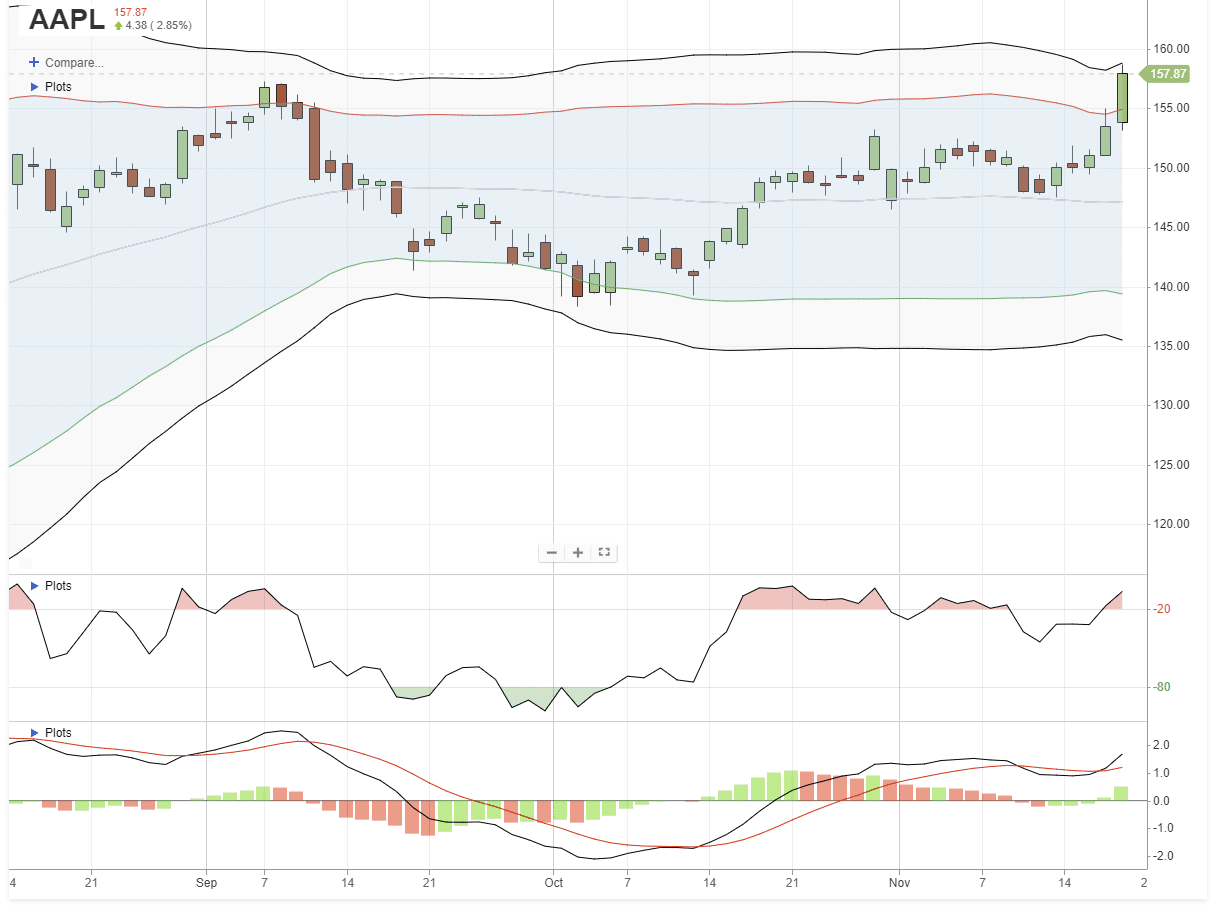
APPLE (AAPL) Surges To New Highs
Apple surged to new highs yesterday on the news they would enter the Electric Vehicle market by 2025. Of course, given the recent performance chase of other EV automakers, the surge was of no surprise.
However, the following note from @TheMarketEar brings up an interesting point about what has been supporting Apple’s stock price in recent years. Of course, this holds true for all of the FAANG stocks in particular.
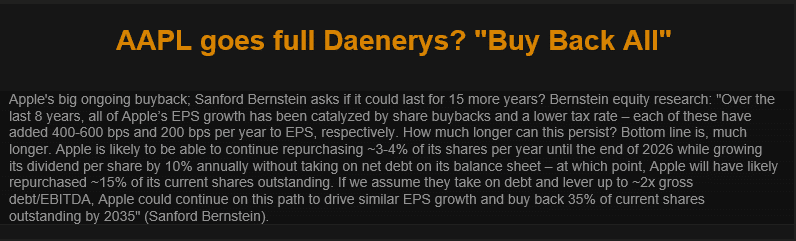
In other words, Apple would not be trading at current levels, without the benefit of its massive stock buyback programs. Of course, given that 40% of the S&P 500’s advance since 2011 is from buybacks along, such should not be a surprise.
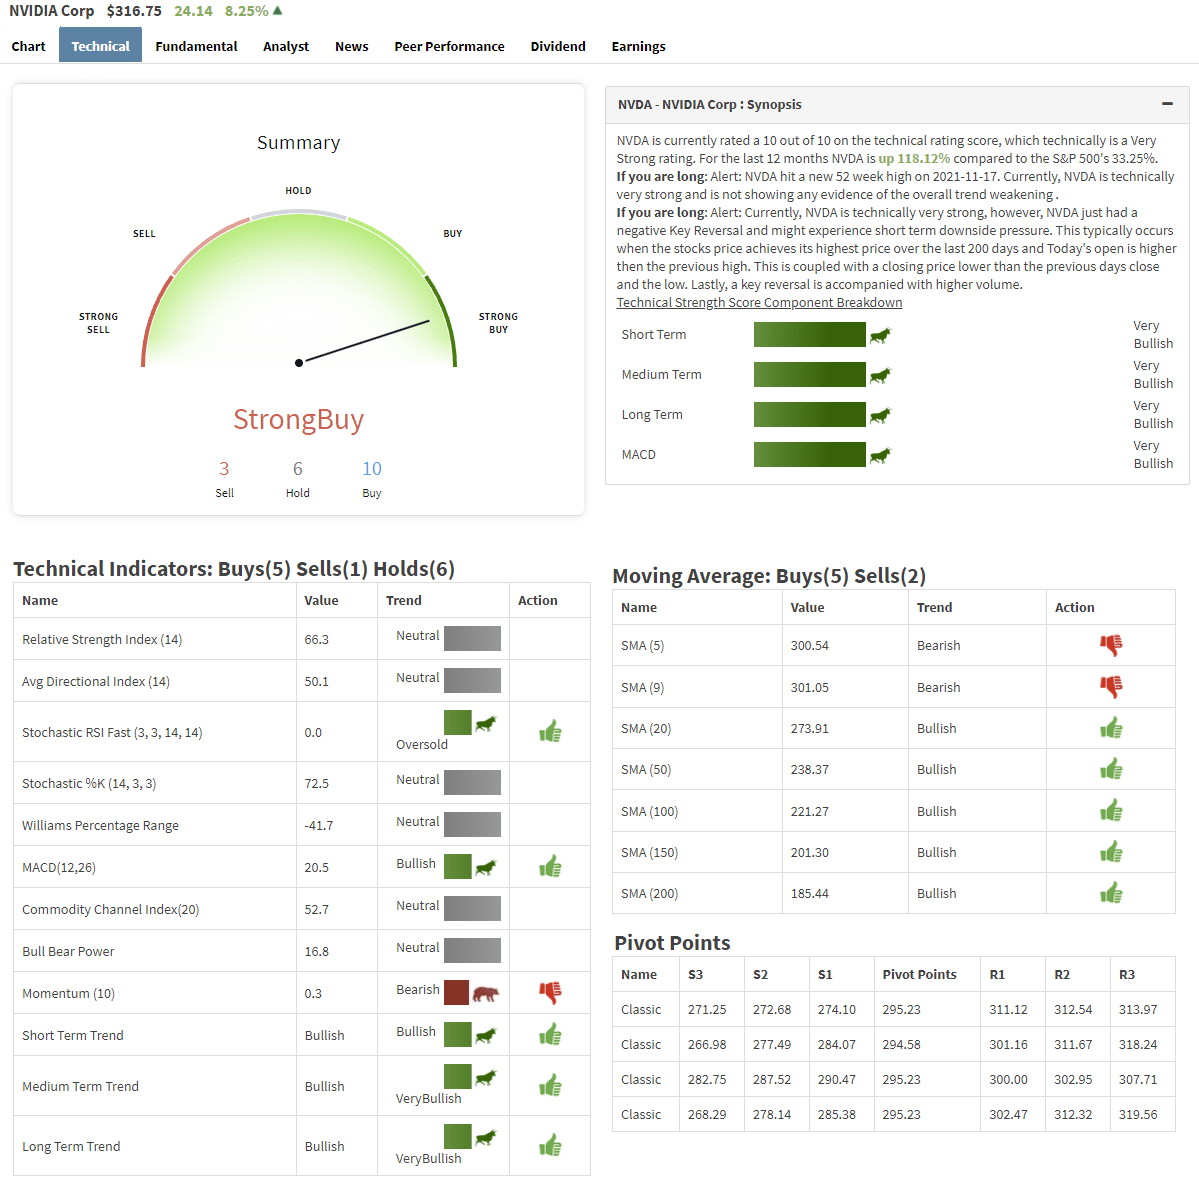
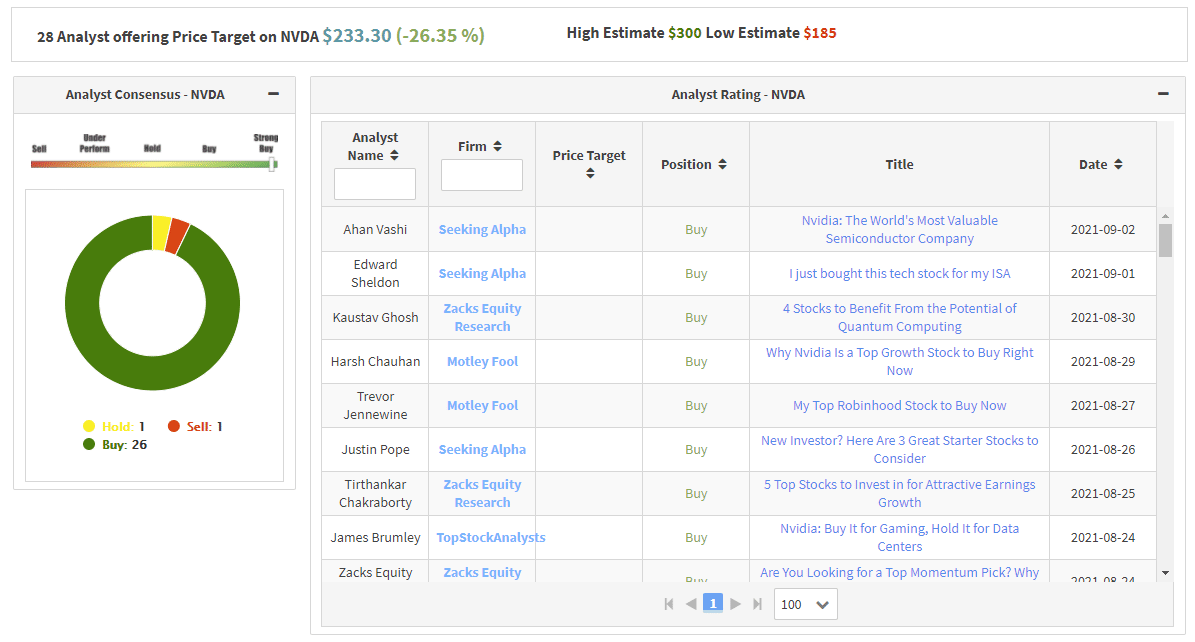
NVIDIA (NVDA) Earnings
NVDA GAAP EPS of $0.97 easily tops the consensus estimate of $0.86, thanks to strong demand and favorable product mix. Gross margins increased +2.6% YoY to reach 65.2% in the third quarter. Revenue of $7.1B (+50.1% YoY) modestly beat expectations of $6.8B. Revenue is driven by record sales in the Gaming (+42% YoY) and Data Center (+55% YoY) segments.
Management set guidance for Q4 revenue at $7.4B plus or minus 2%, above expectations of $6.9B. In addition, they guide for gross margin to remain steady at 65.3% plus or minus 50 bps. Investors love the report as the stock is trading +10%. We hold a 1.75% position in the Equity Model and have taken profits in it twice in the last month. NVDA is not a FAANG stock but certainly acted like one!
Charts courtesy of RIAPRO.NET
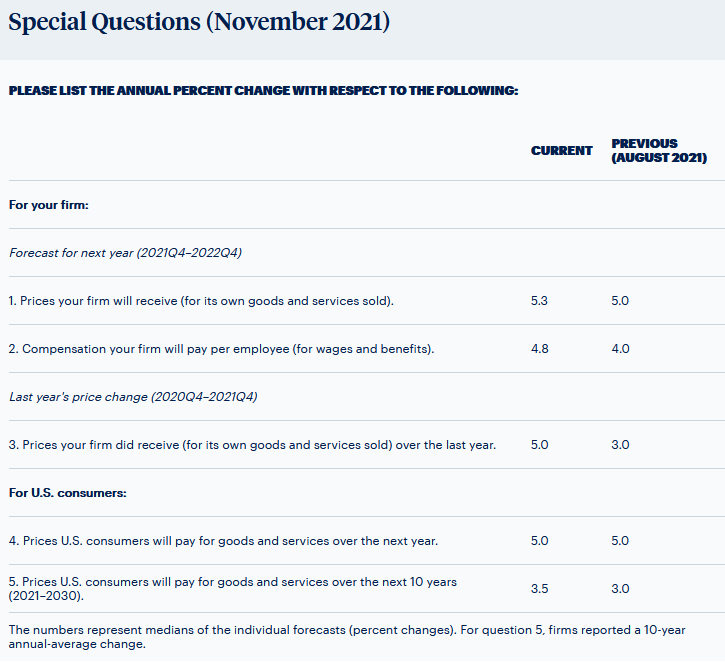
Higher Prices in Philly
The Philadelphia Fed Economic Survey, showing current economic conditions in the mid-Atlantic, points to robust activity. The index rose to 39, its highest level since April. Prices also continue to rise with the prices paid index rising to 80, just a hair below 80.7 in June, a 42 year high. A score of 80 means that 80% of those surveyed witnessed higher prices in November than October. Price received rose as well to its highest reading since 1974. The bottom line is that companies are paying more for input goods but can pass the higher costs to consumers.
The most important part of this survey is this month’s special question. Per the Fed: In this month’s special questions, the firms were asked to forecast the changes in the prices of their own products and for U.S. consumers over the next four quarters. Firms are bracing for more inflation in the prices of goods they sell and higher wage expenses. More telling, their longer-term inflation forecast rose by half a percent to 3.5%.
Are We Due For A Santa Claus Rally?

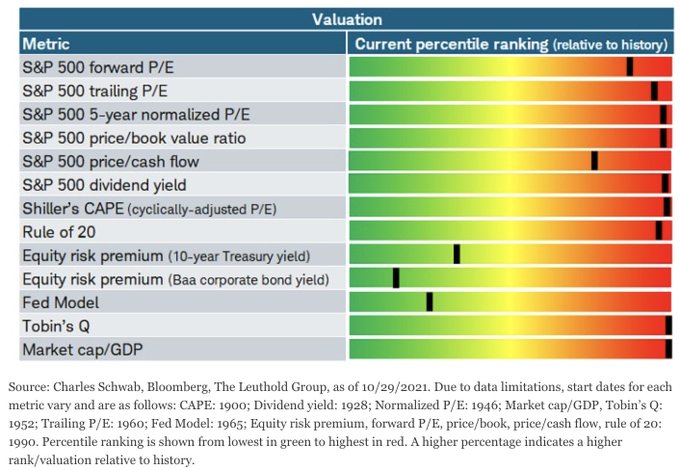
Stocks are Expensive
The chart below from the Leuthold Group shows that stocks are extremely expensive by all measures except those that compare valuations to interest rates. The Fed model and the two equity risk premium valuations are relatively cheap because interest rates are so low. The problem we have with those models is that interest rates are so low in part because future economic growth and therefore earnings growth are also trending lower.
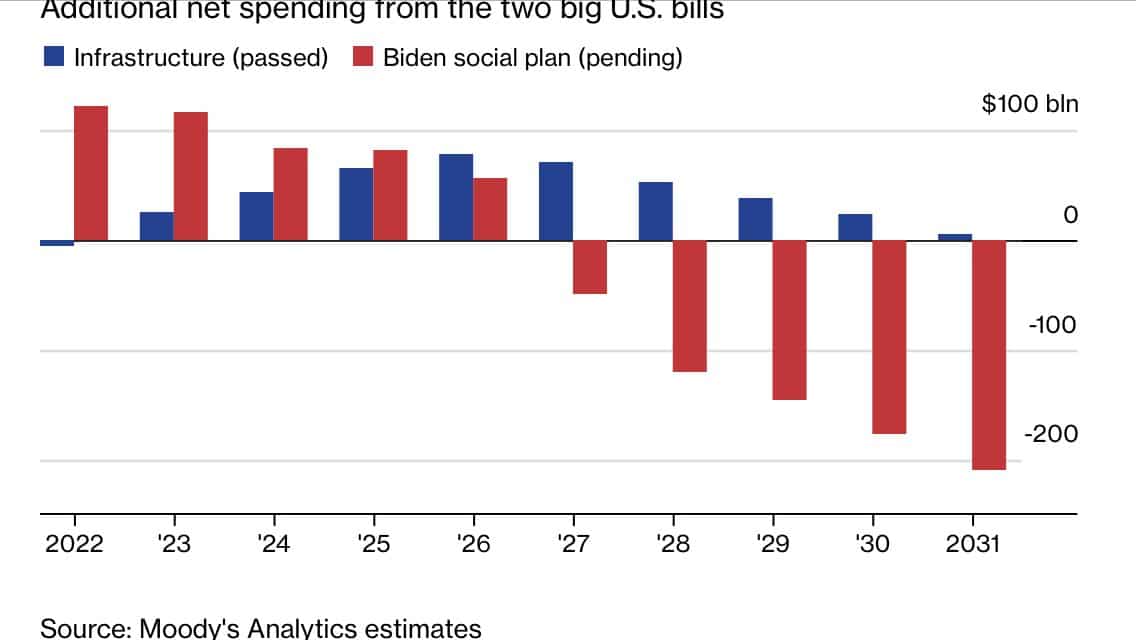
Infrastructure Spending Forecasts
The graph below from Moody’s shows net spending from the recently passed infrastructure bill and the current proposal for the social infrastructure bill. Currently, nominal GDP is over $23 trillion. If we assume the social bill passes, as it is currently written, additional government spending from both bills will peak in 2025 at about $150 billion. That amount would add approximately .60% to GDP. While somewhat meaningful, we must also consider net government spending from the two bills in aggregate decline in the years 2028 and beyond.
Please subscribe to the daily commentary to receive these updates every morning before the opening bell.


Michael Lebowitz, CFA is an Investment Analyst and Portfolio Manager for RIA Advisors. specializing in macroeconomic research, valuations, asset allocation, and risk management. RIA Contributing Editor and Research Director. CFA is an Investment Analyst and Portfolio Manager; Co-founder of 720 Global Research.
Follow Michael on Twitter or go to 720global.com for more research and analysis.
Customer Relationship Summary (Form CRS)
Also Read


