


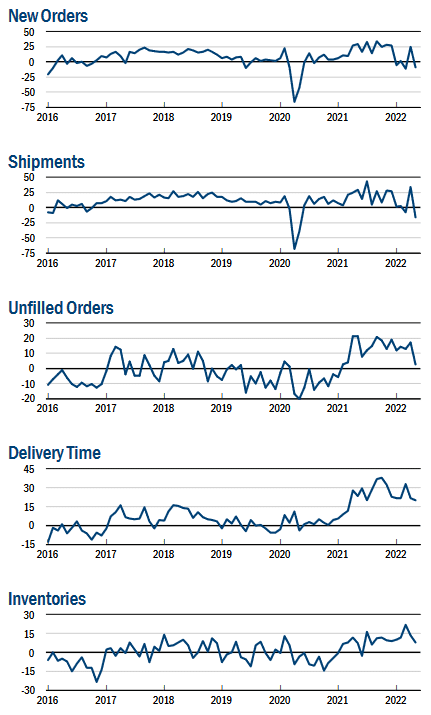
The May New York Fed Empire State Manufacturing Survey fell sharply into economic contraction levels at -11.6. Last month the Empire index stood at +24.6. Leading the Empire index lower are New Orders, Unfilled Orders, Inventories, and Shipments. All four sub-indexes point to a normalization of supply lines and reduction of shortages. These readings should bode well for inflation in the coming months. The prices paid and received indexes fell but remained grossly elevated from historical norms. Employment increased despite a broad weakening of activity, and the average workweek held steady.
While the survey is regional and covers a relatively small area, these surveys have a high correlation to national economic activity. Further, they are as close to real-time data as is available. This Empire survey occurred between May 2 and May 9.

What To Watch Today
Economy
- 8:30 a.m. ET: Retail Sales Advance, month-over-month, April (1.0% expected, 0.5% during prior month, upwardly revised to 0.7%)
- 8:30 a.m. ET: Retail Sales excluding autos, month-over-month, April (0.4% expected, 1.1% during prior month, upwardly revised 1.4%)
- 8:30 a.m. ET: Retail Sales excluding autos and gas, month-over-month, April (0.7% expected, 0.2% during prior month, upwardly revised to 0.7%)
- 8:30 a.m. ET: Retail Sales Control Group, April (0.8% expected, -0.1% during prior month, upwardly revised to 0.7%)
- 9:15 a.m. ET: Industrial Production, month-over-month, April (0.5% expected, 0.9% during prior month)
- 9:15 a.m. ET: Capacity Utilization, April (78.6% expected, 78.3% during prior month)
- 9:15 a.m. ET: Manufacturing (SIC) Production, April (0.4% expected, 0.9% during prior month)
- 10:00 a.m. ET: Business Inventories, March (1.9% expected, 1.5% during prior month)
- 10:00 a.m. ET: NAHB Housing Market Index, May (75 expected, 77 during prior month)
Earnings
Pre-market
- Walmart (WMT) to report adjusted earnings of $1.48 on revenue of $139.09 billion
- Home Depot (HD) to report adjusted earnings of $3.71 on revenue of $36.83 billion
- JD.com (JD) to report adjusted earnings of 1.35 yuan on revenue of 236.73 billion yuan
- Vodafone (VOD) to report adjusted earnings of €1.01 on revenue of €45.39 billion
- Trip.com (TCOM) to report adjusted earnings of $0.26 on revenue of $390 million
Post-market
- No notable reports are scheduled for release
Market Trading Update – Timid Buying Keeps Rally Alive
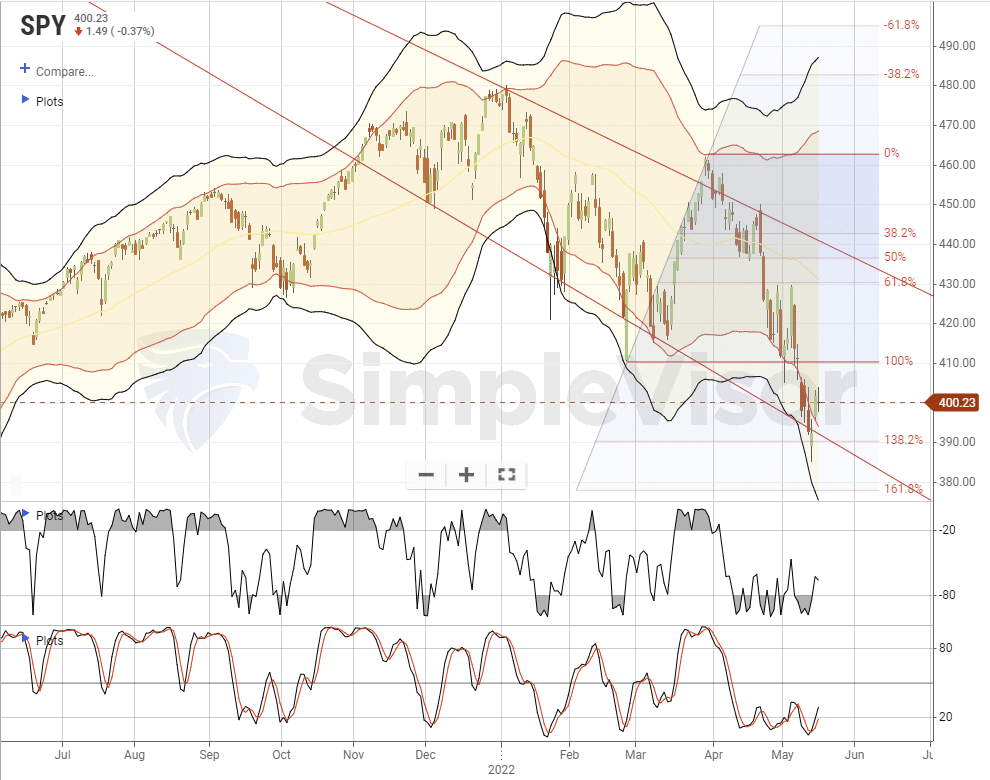
While the Empire Index came in weak, there was still some buying action coming into the market yesterday to build on Friday’s rally. If the market can rally enough to begin to squeeze investors who are short the market, we could see this rally follow through. If not, we will likely retest lows.
For now, the market remains well oversold, and as discussed this morning a rally to the 20-dma seems the most obvious. Any rally to previous resistance should be used as an opportunity to increase cash, reduce risk, and rebalance allocations accordingly.
Everybody Is Bearish – Near Record Options Betting AGAINST A Rally
“Small traders are getting awfully nervous. And now they’re willing to pay up for the right to protect against a crash.
For only the 7th time in 22 years, last week, the smallest options traders spent 30% or more of their volume buying put options to open. Between that spike in put buying and an increase in implied volatility, the premiums that small traders paid for protection were more than 10% higher than the premiums they paid for call options.
It’s extremely rare for retail traders to pay more in premiums for put protection than for speculating on rallies. The data shows that the S&P 500 rallied over the next year after every time they did so, averaging a healthy return of 21%. The only precedents are all-out market crashes, so there was a lot of volatility in the short term.” – Sentiment Trader

Did the Equity Market Finally Capitulate
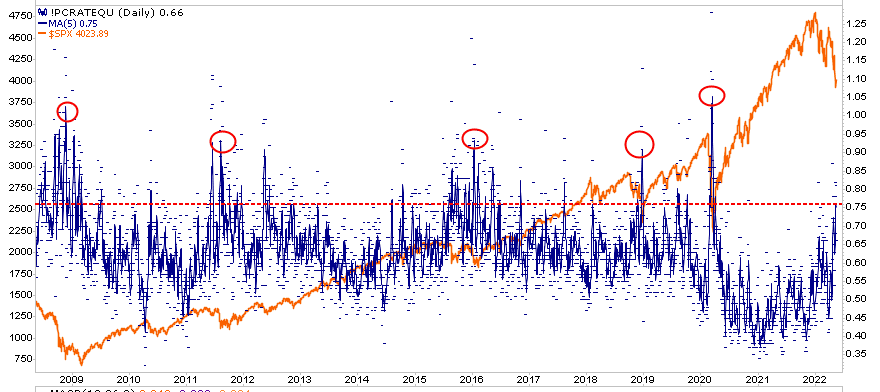
Traders and investors often witness a “capitulation” trade at significant bottoms. Capitulation events are sharp declines fueled by panic. Capitulation can be defined using many quantitative and sentiment gauges. Below, we present a popular technical capitulation indicator. The put-call ratio measures the volume of put options versus call options. The dots represent the ratio for each day, and the blue line smooths them into a five-day moving average. Prior capitulation events, as circled, occurred when the moving average approached 1.00. As shown, the ratio is not quite there yet, which doubts whether a sizable bounce has started.
It’s worth considering the 2008/09 experiences. It shows numerous times the ratio neared 1.00 before the market put the final low in place. Bear markets tend to have strong countertrend rallies and periods of sharp declines. If this is a bear market, this indicator can help us assess if a sharp decline is finished and a reflexive bounce is in store.
There Is Still Risk In Tech Stocks
While there are plenty of indications suggesting a short-term rally, there is still risk in Technology stocks as noted this weekend by Chartr. To wit:
“We’ve combed through 50 years of daily data on the NASDAQ Composite Index, a tech-heavy index comprised of more than 2,500 companies, to get some perspective on how bad this crash has been… and how bad it could get.
So far the NASDAQ is down 29% from its previous peak. That puts it in bear market territory, but it isn’t even close to the 75-80% drop that was seen during the bursting of the dotcom bubble in 2000 or the depths of the Global Financial Crisis of 2008/09. Things could get a lot worse before they get better as inflation, slowing growth and geopolitical uncertainty take their toll or this could turn out to be one of the many 20-30% drops that markets have lived through over the last 50 years, without turning into a complete capitulation.”

No Worries in Corporate Bond Markets
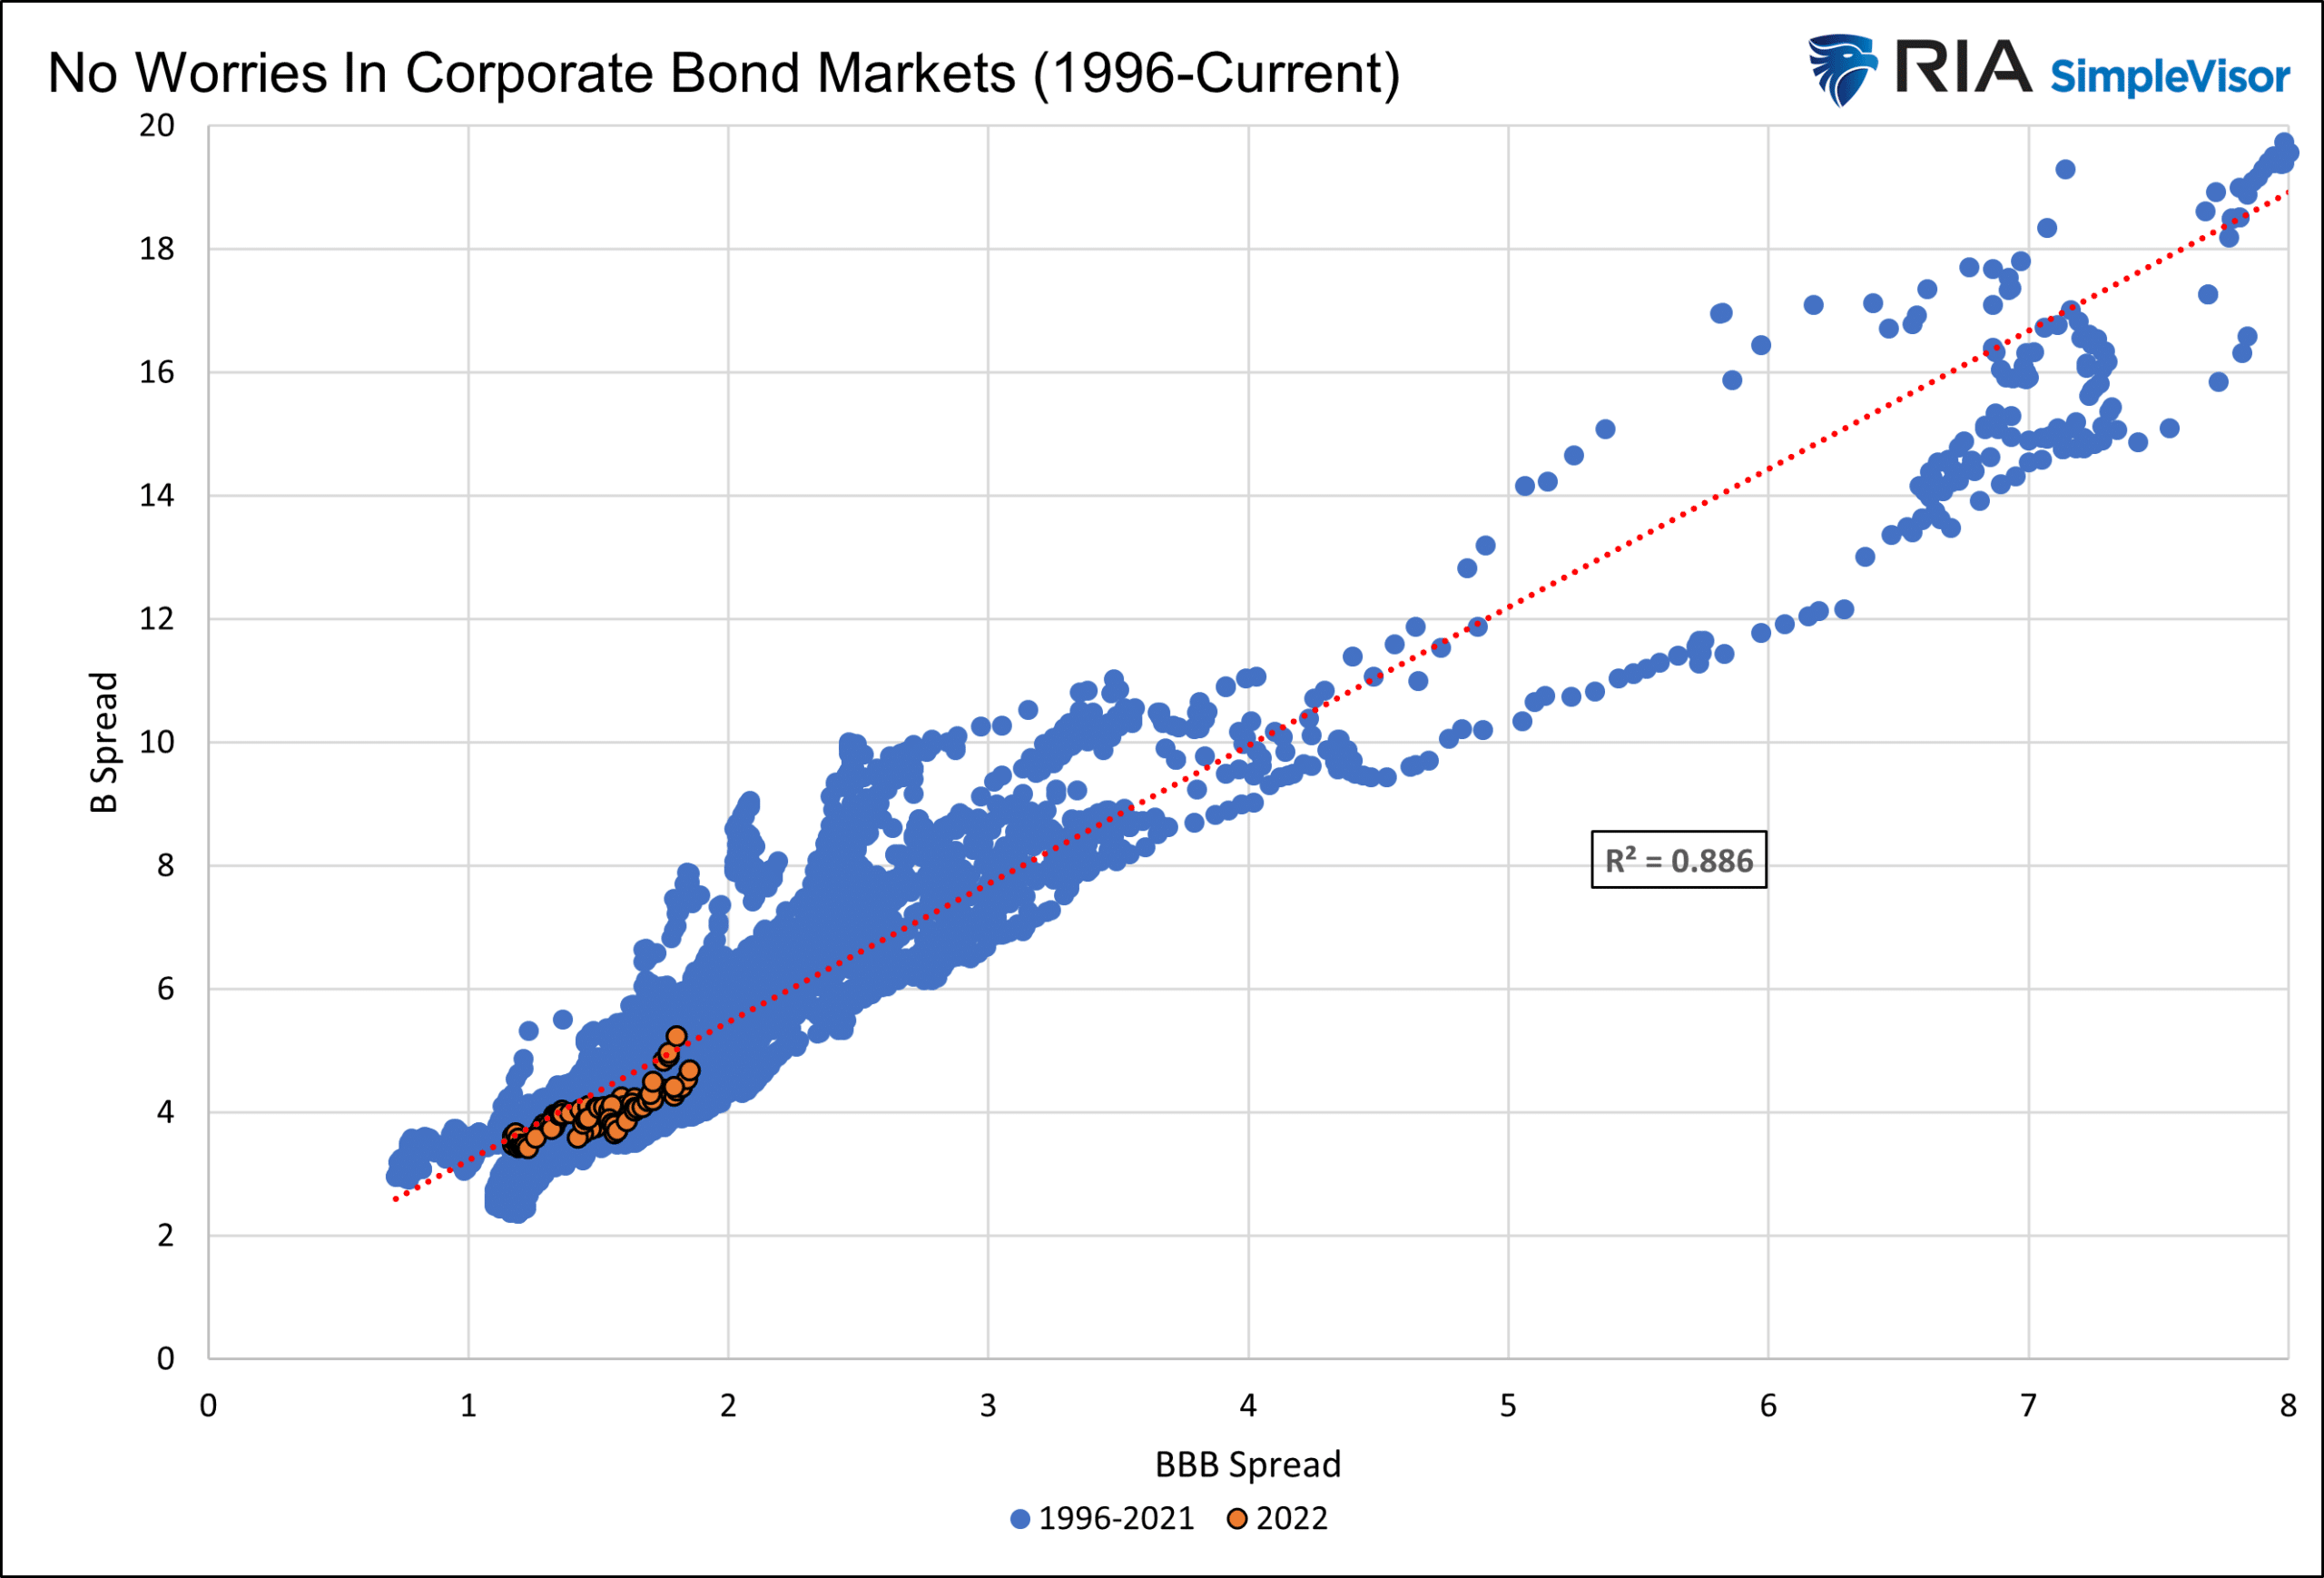
The yield spreads between junk and investment-grade corporate bonds and Treasury bonds remain at relatively low levels. Such tells us that there is not much financial stress in the system. Simply, companies are not having much trouble accessing the capital markets. The graph below compares yield spreads of Junk B-rated corporate bonds to Investment Grade BBB-rated bonds. The orange dots are the 2022 comparisons.
The first takeaway is that yield spreads remain extremely low based on data covering the last 25+ years. Second, given recession odds are increasing, as in the Empire index, we should expect higher spreads and junk spreads to feel the pressure more than investment grade. Most of the orange dots are below the trend line signifying little stress within the corporate bond market.
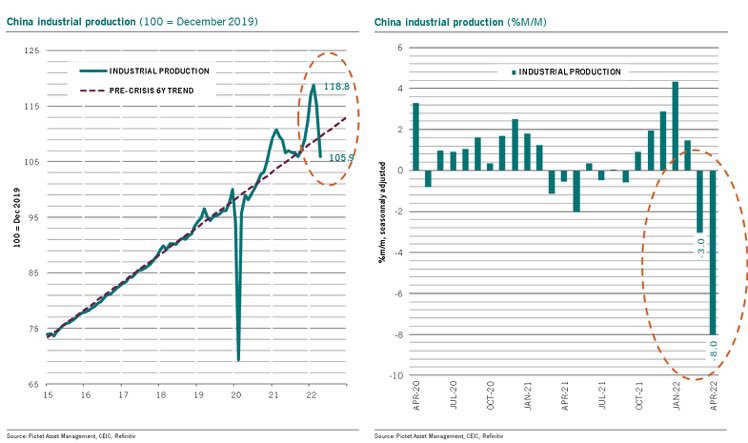
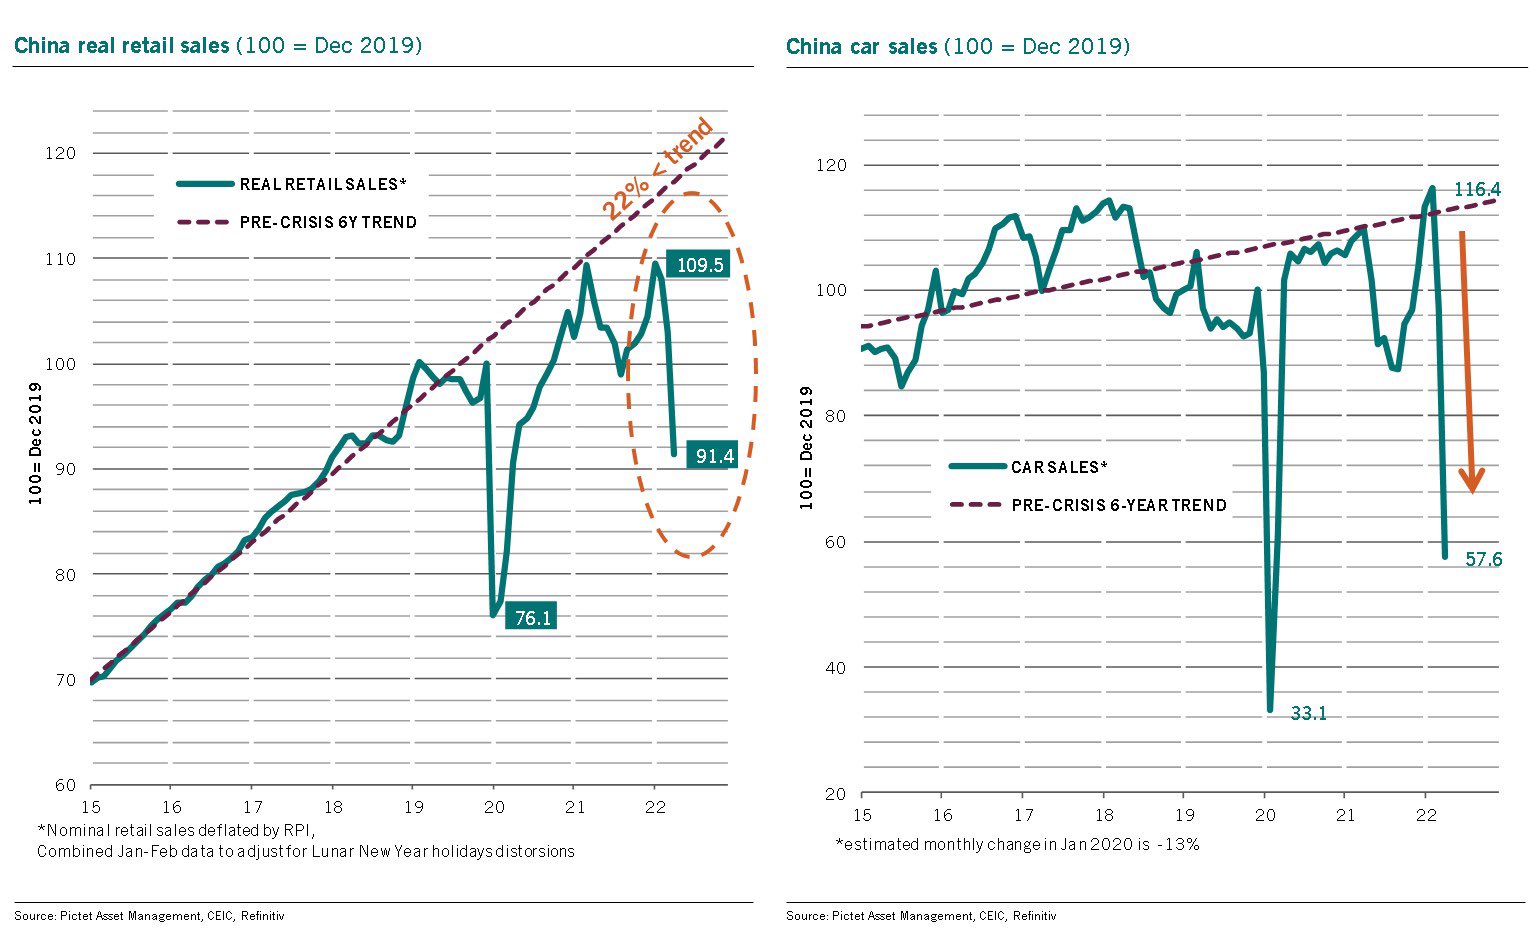
China’s Economy is Slumping Rapidly
The series of charts below from Pictet Asset Management shows a rapid decline in China’s economic activity. Some of the weaknesses are attributable to a good percentage of the country re-entering Covid lockdown protocols over the last two months. China has a zero Covid policy, and lockdowns are tough on the economy. From an American perspective, the slumping activity is crimping China’s exports which introduces an inflationary bias. Further, China is the second-largest economy in the world. Accordingly, their weakness will negatively affect the U.S. and the global economy.

Please subscribe to the daily commentary to receive these updates every morning before the opening bell.
If you found this blog useful, please send it to someone else, share it on social media, or contact us to set up a meeting.
Also Read


