


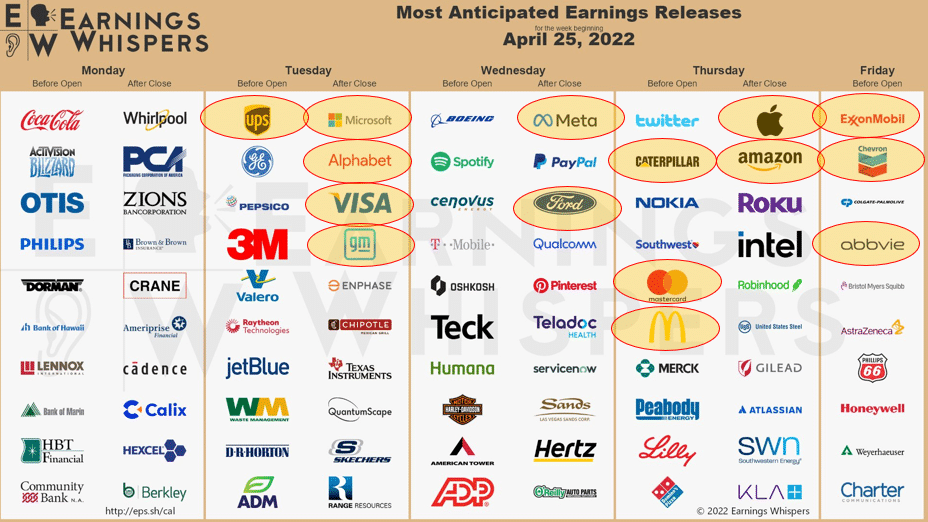
Many companies, including the largest in the United States, will release Q1 earnings this week. The table below circles some of the earnings releases we will closely follow. In some cases, we will do so because we hold the companies in our portfolios. For the remainder, we think they will potentially provide important forward-looking statements and outlooks regarding inflation, sales, and wages. The guidance will help us better appreciate which companies, industries, and sectors are more adept at managing inflationary pressures and weakening sales growth. They can also likely provide a little more detail about how quickly the economy has slowed in the past month.

What To Watch Today
Economy
- 8:30 a.m. ET: Durable Goods Orders, March preliminary (1.0% expected, -2.1% during prior month)
- 8:30 a.m. ET: Durable Goods Orders Excluding Transportation, March preliminary (0.6% expected, -0.6% during prior month)
- 8:30 a.m. ET: Capital Goods Orders Non-defense Excluding Aircrafts, March preliminary (0.5% expected, -0.2% during prior month)
- 9:00 a.m. ET: Capital Goods Shipments Non-defense Excluding Aircrafts, March preliminary (0.5% expected, 0.3% during prior month)
- 9:00 a.m. ET: FHFA House Pricing Index, month-over-month, February (1.5% expected, 1.6% during prior month)
- 9:00 a.m. ET: S&P CoreLogic Case-Shiller 20-City Composite, month-over-month, February (1.50% expected, 1.79% during prior month)
- 9:00 a.m. ET: S&P CoreLogic Case-Shiller 20-City Composite, year-over-year, February (19.20% expected, 19.10% during prior month)
- 9:00 a.m. ET: S&P CoreLogic Case-Shiller U.S. National Home Price Index, year-over-year, February (19.17% during prior month)
- 10:00 a.m. ET: Conference Board Consumer Confidence, April (108.2 expected, 107.2 during prior month)
- 10:00 a.m. ET: Conference Board Present Situation, April (153.0 during prior month)
- 10:00 a.m. ET: Conference Board Expectations, April (76.6 during prior read)
- 10:00 a.m. ET: Richmond Fed Manufacturing Index, April (9 expected, 13 during prior month)
- 10:00 a.m. ET: New home sales, March (768,000 expected, 772,000 during prior month)
- 10:00 a.m. ET: New home sales, month-over-month, March (-0.6% expected, -2.0% during prior month)
Earnings Releases
Pre-market
- PepsiCo (PEP) to report adjusted earnings of $1.23 on revenue of $15.57 billion
- UPS (UPS) to report adjusted earnings of $2.88 on revenue of $23.80 billion
- Centene (CNC) to report adjusted earnings of $1.69 on revenue of $34.30 billion
- Warner Bros. Discovery (WBD) to report adjusted earnings of $0.57 on revenue of $3.17 billion
- General Electric (GE) to report adjusted earnings of $0.20 on revenue of $17.04 billion
Post-market
- General Motors (GM) to report adjusted earnings of $1.69 on revenue of $37.39 billion
- Chipotle (CMG) to report adjusted earnings of $5.67 on revenue of $2.01 billion
- Capital One (COF) to report adjusted earnings of $5.46 on revenue of $8.03 billion
- Alphabet (GOOG, GOOGL) to report adjusted earnings of $25.71 on revenue of $56.66 billion
- Microsoft (MSFT) to report adjusted earnings of $2.19 on revenue of $49.04 billion
- Visa (V) to report adjusted earnings of $1.66 on revenue of $6.84 billion
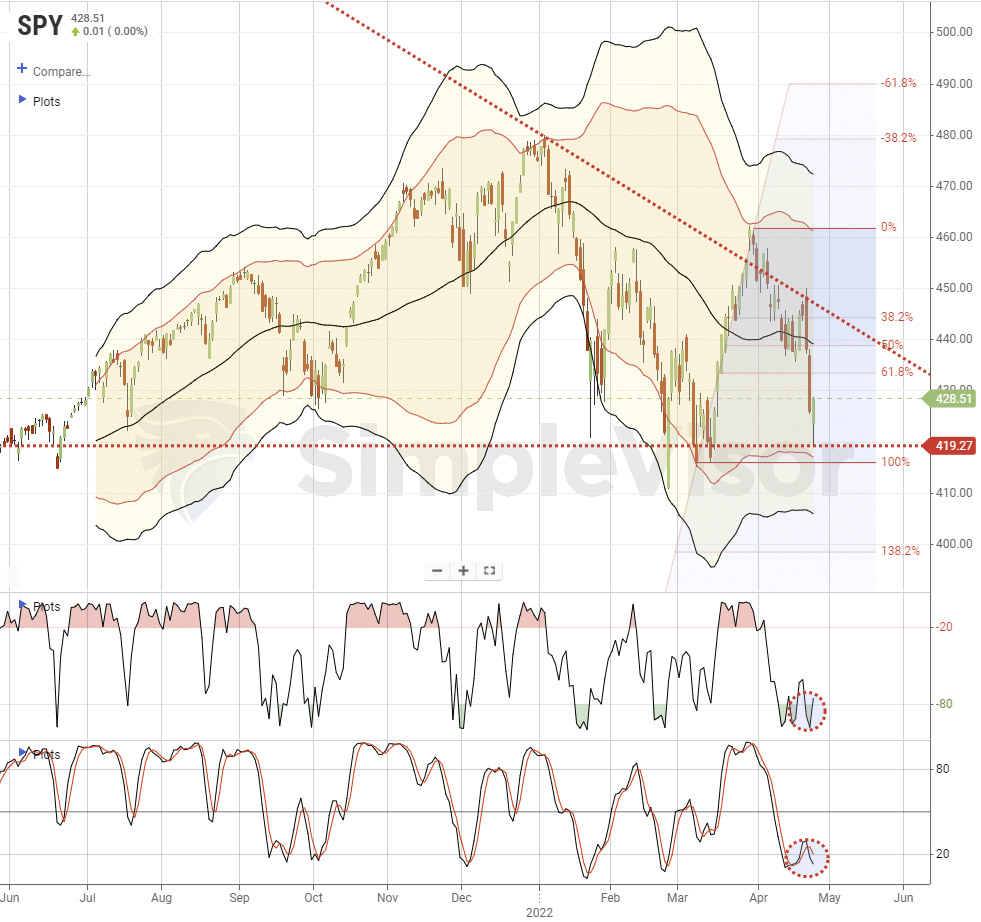
Market Trading Update – Bottom Holds
As discussed yesterday, we noted that a retest of the March lows was likely. That occurred at the open and then the market rallied the rest of the day to finish positive with growth stocks leading the way, and the “inflation trade” taking a beating. Depending on how the rest of this week goes, a rally back to the declining trend line is a good first target to sell into and reduce some risk. With a lot of earnings releases this week and next, volatility will likely remain a daily adventure.
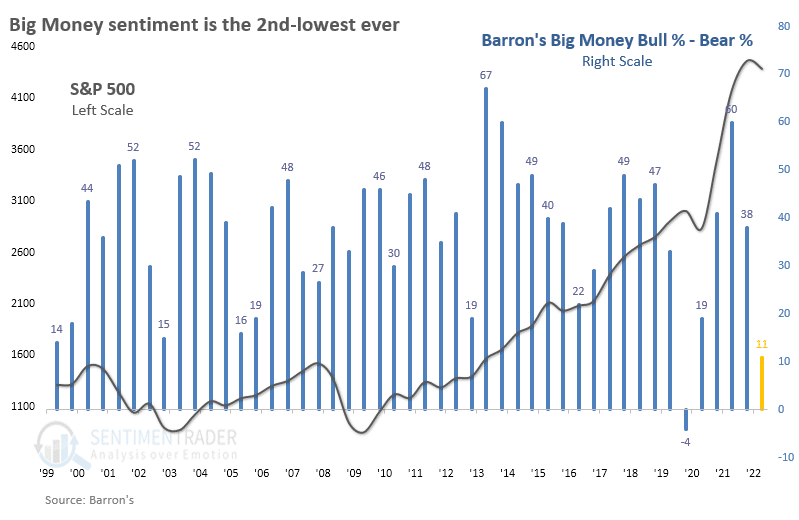
Big Money Has Left The Stock Market
The latest semi-annual poll of large money managers from Barron’s showed a sharp drop in bulls. The survey represents the attitudes of hundreds of managers with influence over hundreds of billions of dollars under management.
While half of them were optimistic about the prospects for stocks last October, only a third of them are now. That’s the 2nd-lowest percentage of bulls in the survey’s history, next to October 2019, when only 27% of managers were bullish.
Even though they’re not optimistic, they still expect the S&P 500 to gain nearly 9% from mid-April through December. That’s par for the course – they almost always expect the S&P to gain about 7% over the next six months.
The percentage of bears rose, so the net difference between bullish and bearish managers plunged from +38% to only +11%, again the 2nd-lowest reading in 23 years. – Sentiment Trader
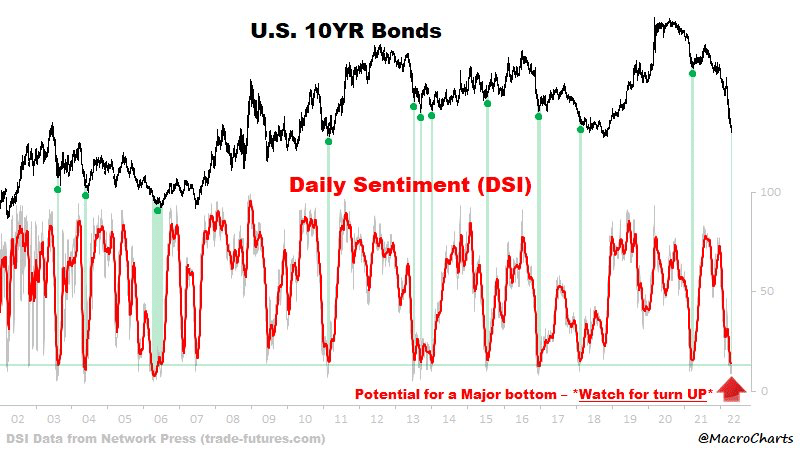
Bonds- “Potential For a Major Bottom”
The graph below shows the Daily Sentiment Index (DSI) for 10-year Treasury futures is at record low levels. The DSI measures the sentiment of small traders. Per futures expert Jake Bernstein- “The primary difference between all other market sentiment indicators and the DSI is that the DSI is available within one hour and that the DSI gathers the opinion of the small retail trader who is most likely to be WRONG at market turning points.” Further- “By examining small trader sentiment, we can arrive at a very valid measure of contrary opinion that has had an uncanny record of accuracy for many years.”
If the low DSI is again predictive, bond prices should be in for a decent bounce. That, however, doesn’t mean bond investors are out of the woods. As the graph shows, a very low DSI reading likely results in a bounce but not necessarily and change in trend.
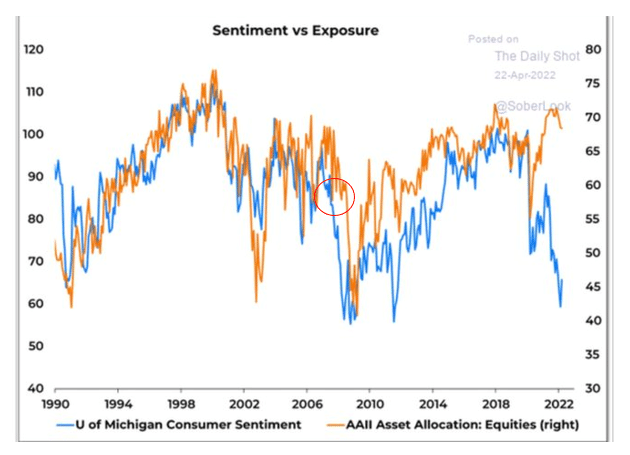
Look Out Below!
The graph below, courtesy of the Daily Shot, provides a stark warning for equity investors. As it shows, the correlation between the University of Michigan Consumer Sentiment Index and the equity allocation of institutional investors is robust. Recently, however, the two indicators have diverged. The sentiment index is near 30-year lows portending weak personal consumption in the months ahead and possibly a recession. At the same time, institutional investors have only barely reduced their allocations to stocks. The red circle shows the last time a similar divergence occurred. Ultimately, at that time, the divergence vanished as investors reduced allocations in the 2008 bear market.
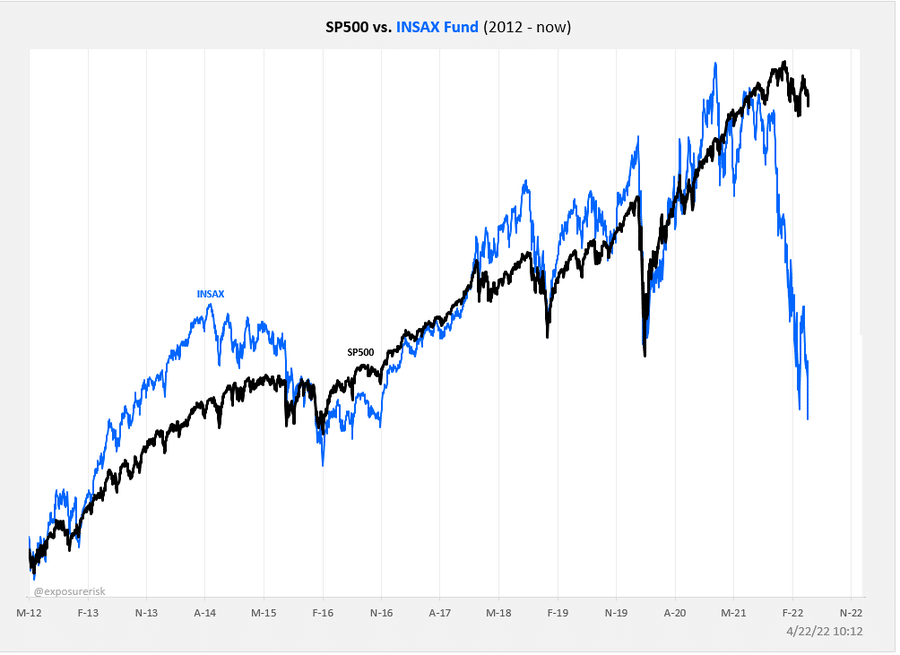
Are Insiders Smarter?
After sharing the bearish graph above, we thought it might be helpful to provide the following chart from Callum Thomas highlighting a potential opportunity in the equity market. His graph compares the S&P 500 to the Catalyst INSAX fund. Per Catalyst’s website, “INSAX seeks to offer investors an opportunity to invest in large-capitalization U.S. companies experiencing significant insider buying.”
Corporate insiders know their companies better than outsiders. As such, the companies held by the fund may offer potential looking forward. INSAX is down over 30% this year due, in part, to its largest holding, Facebook. Executives in some of these companies are likely buying stock on what they deem to be cheap levels. It may be worth following their lead in some cases. Pay note to earnings releases which will give you some clues as to which companies may be a better bet.
Please subscribe to the daily commentary to receive these updates every morning before the opening bell.
Also Read


