


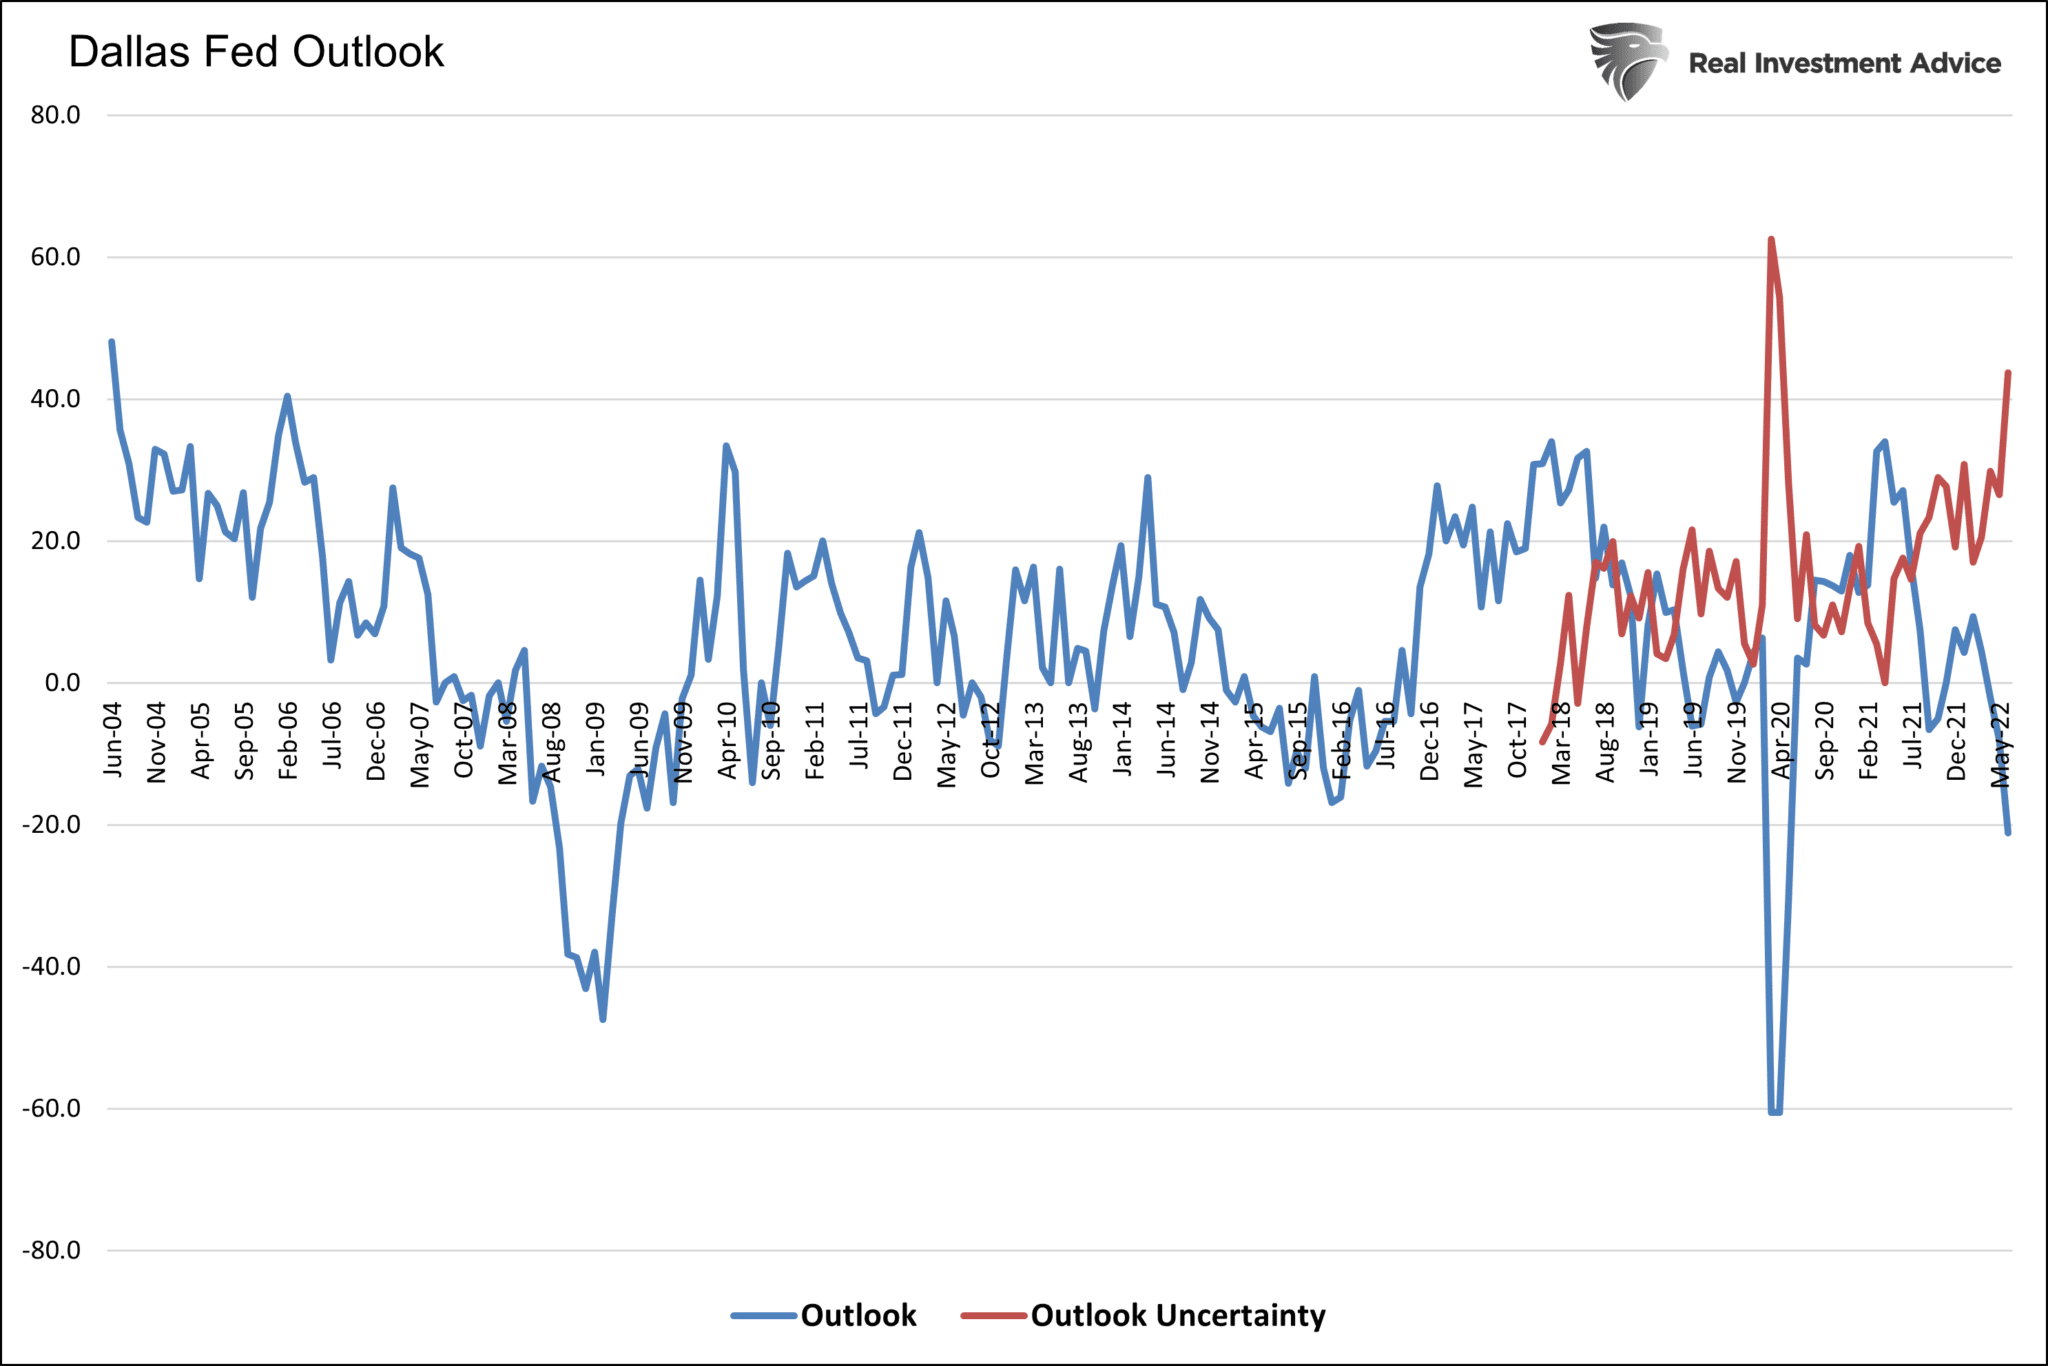
Yet another regional Fed manufacturing survey warns of economic contraction. On Monday, the Dallas Fed manufacturing index fell further into the contractionary economic territory at -17.7. More concerning, the Dallas Fed reports that manufacturers’ outlooks and the degree of uncertainty in their outlooks are deteriorating rapidly. Within the Dallas Fed survey, employment and prices are coming under pressure. While the Dallas Fed survey data may be recessionary, the silver lining is that inflationary pressures and prices seem to be easing. The Dallas Fed survey is another reason the market is starting to think the Fed may not tighten as much as was previously thought. Over the past few days, the June 2023 Fed Funds futures contract has fallen from 3.75% to 3.50%.

What To Watch Today
Economy
- 8:30 a.m. ET: Advance Goods Trade Balance, May (-$105.4 billion expected, -$105.9 billion prior, revised to -$106.7 billion)
- 8:30 a.m. ET: Wholesale Inventories, MoM, May preliminary (2.1% expected, 2.2% prior)
- 8:30 a.m. ET: Retail Inventories, month-over-month, May (1.6% expected, 0.7% prior)
- 9:00 a.m. ET: FHFA Housing Pricing Index, April (1.6% expected, 1.5% prior)
- 9:00 a.m. ET: S&P CoreLogic Case-Shiller 20-City Composite, MoM, April (1.85% expected, 2.42% prior)
- 9:00 a.m. ET: S&P CoreLogic Case-Shiller 20-City Composite, YoY, April (21.20% expected, 21.17% prior)
- 9:00 a.m. ET: S&P CoreLogic Case-Shiller U.S. National Home Price Index, year-over-year, April (20.55% prior)
- 10:00 a.m. ET: Conference Board Consumer Confidence, June (100 expected, 106.4 prior)
- 10:00 a.m. ET: Richmond Fed Manufacturing Index, June (-5 expected, -9 prior)
Earnings
Pre-market
- No notable companies are expected to report.
Post-market
- AeroVironment (AVAV) to report adjusted earnings of 39 cents on revenue of $134.43 million
Market Rally Stalls As SEC Talks Crypto Regulation
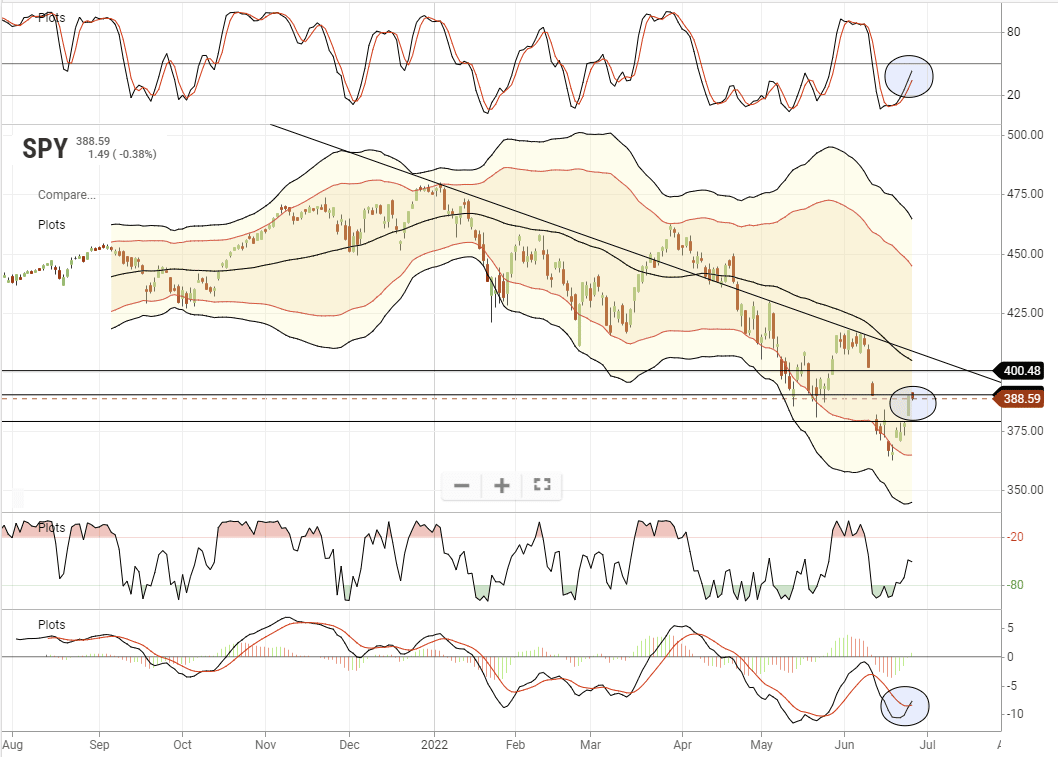
While the Dallas Fed report didn’t help market confidence, tough talk from the SEC put the brakes on an early morning rally. However, for the day, the market held its ground after a strong rally last week. With this week pushing a $30 billion quarter-end rebalancing, we added a little exposure today to capture both a potential for a rally to the 50-dma and a rebound in energy stocks after a sharp sell-off. We are maintaining very tight stop losses on the trade.
Markets are oversold and buy signals have triggered suggesting a short-term bullish bias. This is still very likely a bear market rally, so any rally should be sold as overhead resistance approaches.
Someone Is Going To Be Very Wrong
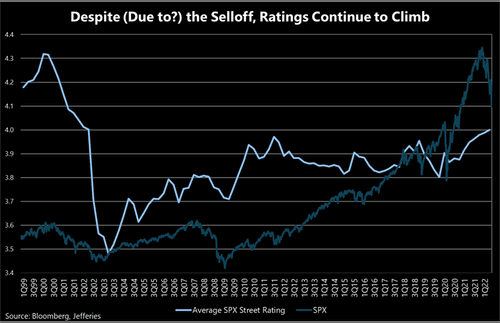
Consumers are the most bearish since the financial crisis. However, despite their bearish outlooks, they are maintaining near-record asset allocation levels. On the other side of the coin, as noted by The Market Ear, Wall Street is the most bullish in exactly 20 years.
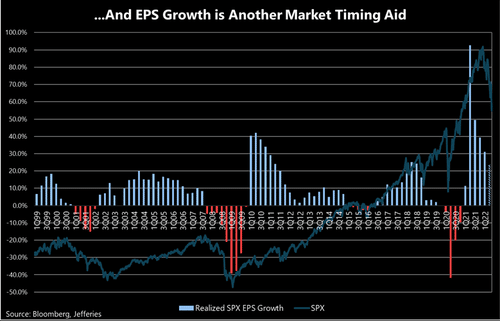
“Maybe due to falling valuations, or perhaps since consumption repeatedly surprised to the upside, Wall Street ratings are up – way up – YTD. Though investor sentiment has rarely been lower, its been exactly 20Y since the Street has been this bullish. It’s possible that much like prior cycles, there is just a bit of a delayed reaction. But either way, someone is going to be proven wrong.”
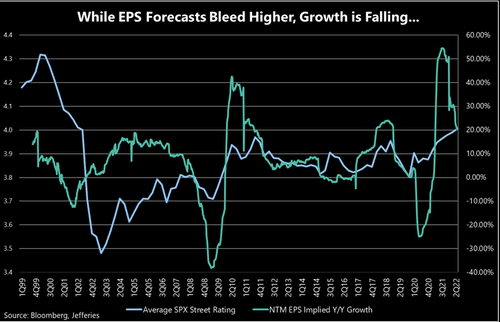
“While EPS forecasts have also risen in aggregate YTD, as shown below, EPS growth projections have fallen out of the stratosphere and are back into the normal range. Importantly, this has been one of the better indicators for timing a bottom in equities, shown below in the early ’00s, ’09, ’15/’16, 1Q19 and early 2020. Without a steep drop, or a dip into EPS contraction, its hard to give an all-clear.”
The Cure for High Inflation is High Inflation
Fears are rising that the current bout of high inflation will be lasting. However, history teaches us that high inflation is the cure for high inflation. The graph below shows that since 1950, the U.S. has experienced four bouts of significant inflationary periods, as highlighted in red. The prior three periods lasted between 22 and 28 months. The current episode is 25 months old.
As we have seen in the past, high inflation levels tend to occur quickly and end equally quickly. The three prior episodes lasted two to two and a half years before turning back lower. The current price surge is now over two years old. High prices crush consumer sentiment and force people to reduce their spending. Weakened demand due to higher prices ultimately helps bring prices down. If history is a guide, we should expect inflation to fall back to very low levels by the summer of 2024.

What Capitulation?
The commentary and graph below from @GunjanJS and Callum Thomas show that despite the recent drawdown, equity fund inflows remain stable. As Thomas notes, might equity investors be unfazed by the recent decline and instead, use it to dollar cost average (DCA) their holdings at lower prices.

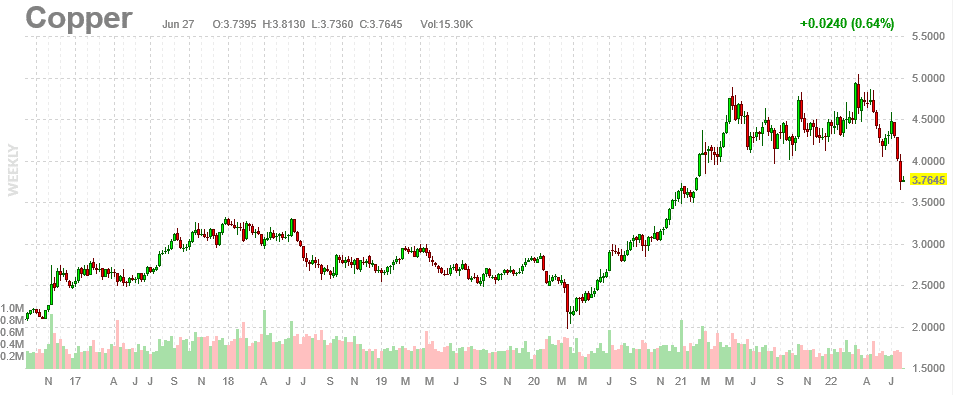
Doctor Copper Warns
The graph below shows that Copper futures prices have recently collapsed by about 25% from recent highs. However, they remain about 35% above pre-pandemic norms. Copper, often called Doctor Copper, as its price tends to track economic activity well, provides yet another warning of an economic slowdown. Copper isn’t the only metal falling rapidly in price. Nickel is down about 50% from its recent high, and aluminum is down 36% from its high. Joining copper with a 25% price decline is zinc and iron ore. If lower prices are sustained, PPI and ultimately CPI will likely follow suit.
Please subscribe to the daily commentary to receive these updates every morning before the opening bell.
If you found this blog useful, please send it to someone else, share it on social media, or contact us to set up a meeting.
Also Read


