


J. Brett Freeze and his firm Global Technical Analysis (GTA) provides RIA Pro subscribers Cartography Corner on a monthly basis. Brett’s analysis offers readers a truly unique brand of technical insight and risk framework. We personally rely on Brett’s research to help better gauge market trends, their durability, and support and resistance price levels.
GTA presents their monthly analysis on a wide range of asset classes, indices, and securities. At times the analysis may agree with RIA Pro technical opinions, and other times it will run contrary to our thoughts. Our goal is not to push a single view or opinion, but provide research to help you better understand the markets. Please contact us with any questions or comments. If you are interested in learning more about GTA’s services, please connect with them through the links provided in the article.
The link below penned by GTA provides a user’s guide and a sample of his analysis.
The Cartography Corner
October 2021
By: J. Brett Freeze, CFA
www.globaltechnicalanalysis.com
September 2021 Review
E-Mini S&P 500 Futures
We begin with a review of E-Mini S&P 500 Futures (ESZ1) during September 2021. In our September 2021 edition of The Cartography Corner, we wrote the following:
In isolation, monthly support and resistance levels for September are:
o M4 4860.50
o M1 4662.00
o M3 4651.50
o PMH 4542.25
o Close 4520.50
o M2 4471.50
o MTrend 4350.67
o PML 4347.75
o M5 4273.00
Active traders can use PMH: 4542.25 as the pivot, maintaining a long position above that level and a flat or short position below it.
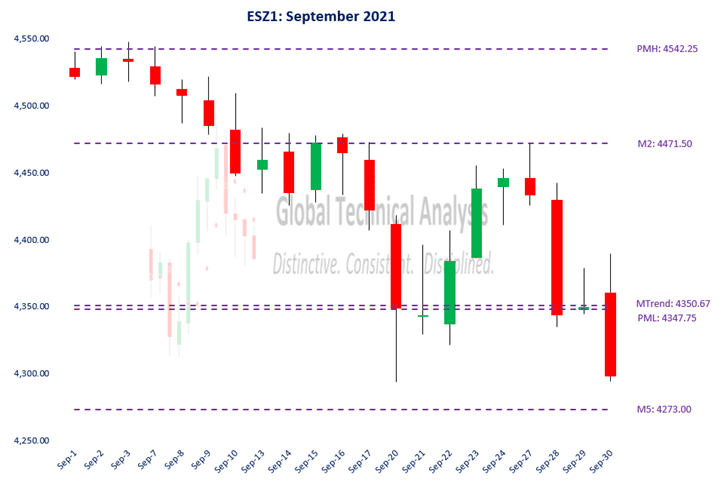
Figure 1 below displays the daily price action for September 2021 in a candlestick chart, with support and resistance levels isolated by our methodology represented as dashed lines. The intra-session highs of the first four trading sessions tested, and exceeded on September 3rd, our isolated pivot level at PMH: 4542.25. However, the market price never settled above that level.
Over the following three trading sessions, the market price declined to, and through, our first isolated support level at M2: 4471.50. That support level acted as a magnet for the next four sessions, with the intra-session highs exceeding it yet settling below. Energy was building for the next move. On September 17th, the market price began a (3.82%, close-to-low) two-session descent. The intra-session low of September 20th stopped 0.48% short of our isolated Monthly Downside Exhaustion level at M5: 4273.00. The market price settled that session amid our isolated clustered support levels at MTrend: 4350.67 and PML: 4347.75. (If bearishly inclined, not achieving the Downside Exhaustion Level is a good outcome. The reason is that the signal was not triggered to anticipate a two-month high over the following four to six months.)
Over the following five trading sessions, the market price rallied 1.95% close-to-close. The intra-session high at the peak of the rally on September 27th was on top of our first isolated support level at M2: 4471.50, now acting as resistance. Hmmm.
The final three trading sessions saw the market price roll over again, pausing at clustered support levels at MTrend: 4350.67 and PML: 4347.75, before descending again towards our isolated Monthly Downside Exhaustion level at M5: 4273.00.
Figure 1:
Random Length Lumber
We continue with a review of Random Length Lumber Futures (LBX1) during September 2021. In our September 2021 edition of The Cartography Corner, we wrote the following:
In isolation, monthly support and resistance levels for September are:
o M4 800.00
o MTrend 700.37
o PMH 650.00
o Close 533.40
o WTrend 504.48
o PML 462.00
o M1 447.60
o M3 445.60
o M2 424.00
o M5 71.60
Active traders can use WTrend: 504.48 as the initial pivot, maintaining a long position above that level and a flat or short position below it. As the weeks of September progress, continue to use the updated Weekly Trend as the pivot. A retracement up to Monthly Trend is the initial target.
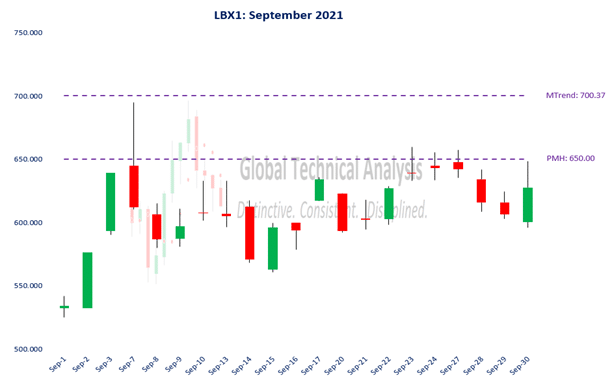
Figure 2 below displays the daily price action for September 2021 in a candlestick chart, with support and resistance levels isolated by our methodology represented as dashed lines. The first four trading sessions in September saw the market price ascend to 695.00, just shy of our isolated target at MTrend: 700.37. Also, for the entirety of September, the market price did not have a weekly settlement below Weekly Trend.
The remainder of September saw the market price consolidate within a 97-point range.
Figure 2:
October 2021 Analysis
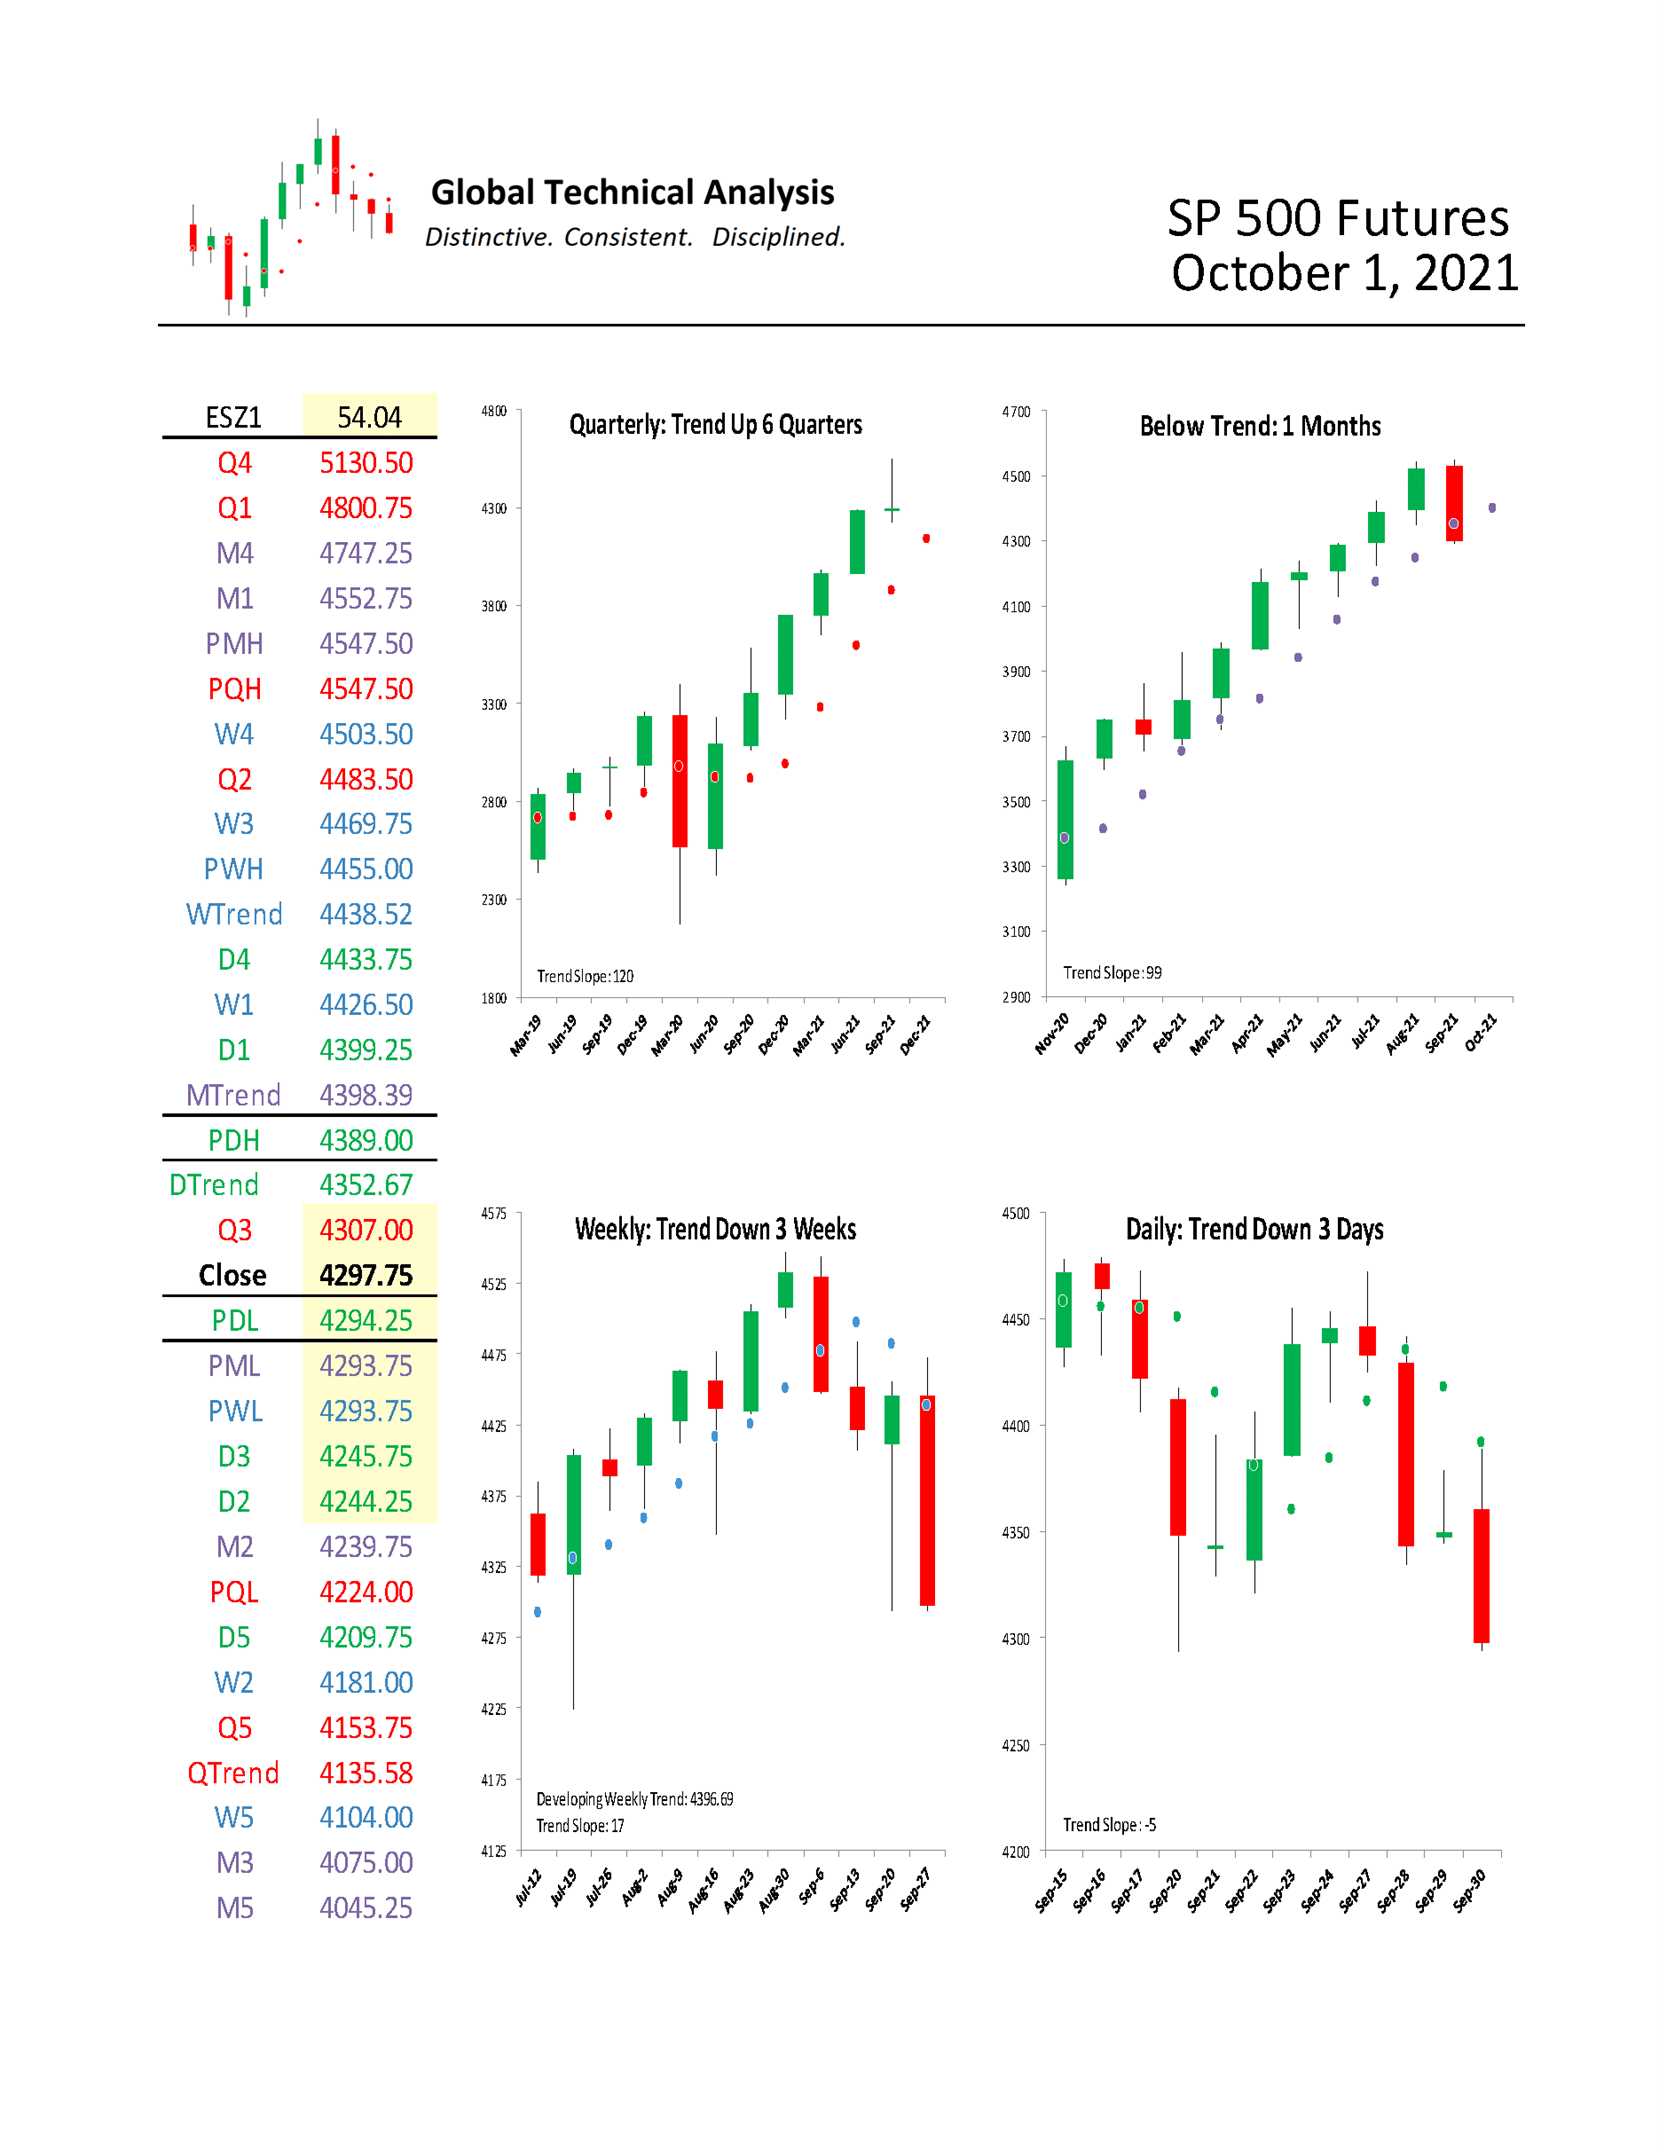
We begin by providing a monthly time-period analysis of E-Mini S&P 500 Futures (ESZ1). The same analysis can be completed for any time-period or in aggregate.
Trends:
o Weekly Trend 4438.52
o Monthly Trend 4398.39
o Daily Trend 4352.67
o Current Settle 4297.75
o Quarterly Trend 4135.58
The relative positioning of the Trend Levels is bearish. Think of the relative positioning of the Trend Levels like you would a moving-average cross. In the quarterly time-period, the chart shows that E-Mini S&P 500 Futures are “Trend Up”, having settled above Quarterly Trend for six quarters. Stepping down one time-period, the monthly chart shows that E-Mini S&P 500 Futures are “Below Trend: 1 Months”, settling below Monthly Trend for the first time in eleven months. Stepping down to the weekly time-period, the chart shows that E-Mini S&P 500 Futures are “Trend Down”, with three consecutive closes below Weekly Trend.
Is the bull market over? Within our framework, only Quarterly Trend prevents us from answering “yes”. Given the 20-day Average True Range of 54.04 points, Quarterly Trend can be broken in the next three trading sessions. Is that highly probable, no, but it gives the correct context of just how close the market price is. Our fundamental work on growth, the inverse relationship between P/E multiples and inflation, and the immediate path of monetary policy (domestic and international), collectively, affirm the recent price action… as if an inflection point has been crossed.
Support/Resistance:
In isolation, monthly support and resistance levels for October are:
o M4 4747.25
o M1 4552.75
o PMH 4547.50
o MTrend 4398.39
o Close 4297.75
o PML 4293.75
o M2 4239.75
o M3 4075.00
o M5 4045.25
Active traders can use MTrend: 4398.39 as the pivot, maintaining a long position above that level and a flat or short position below it.
Bitcoin Futures
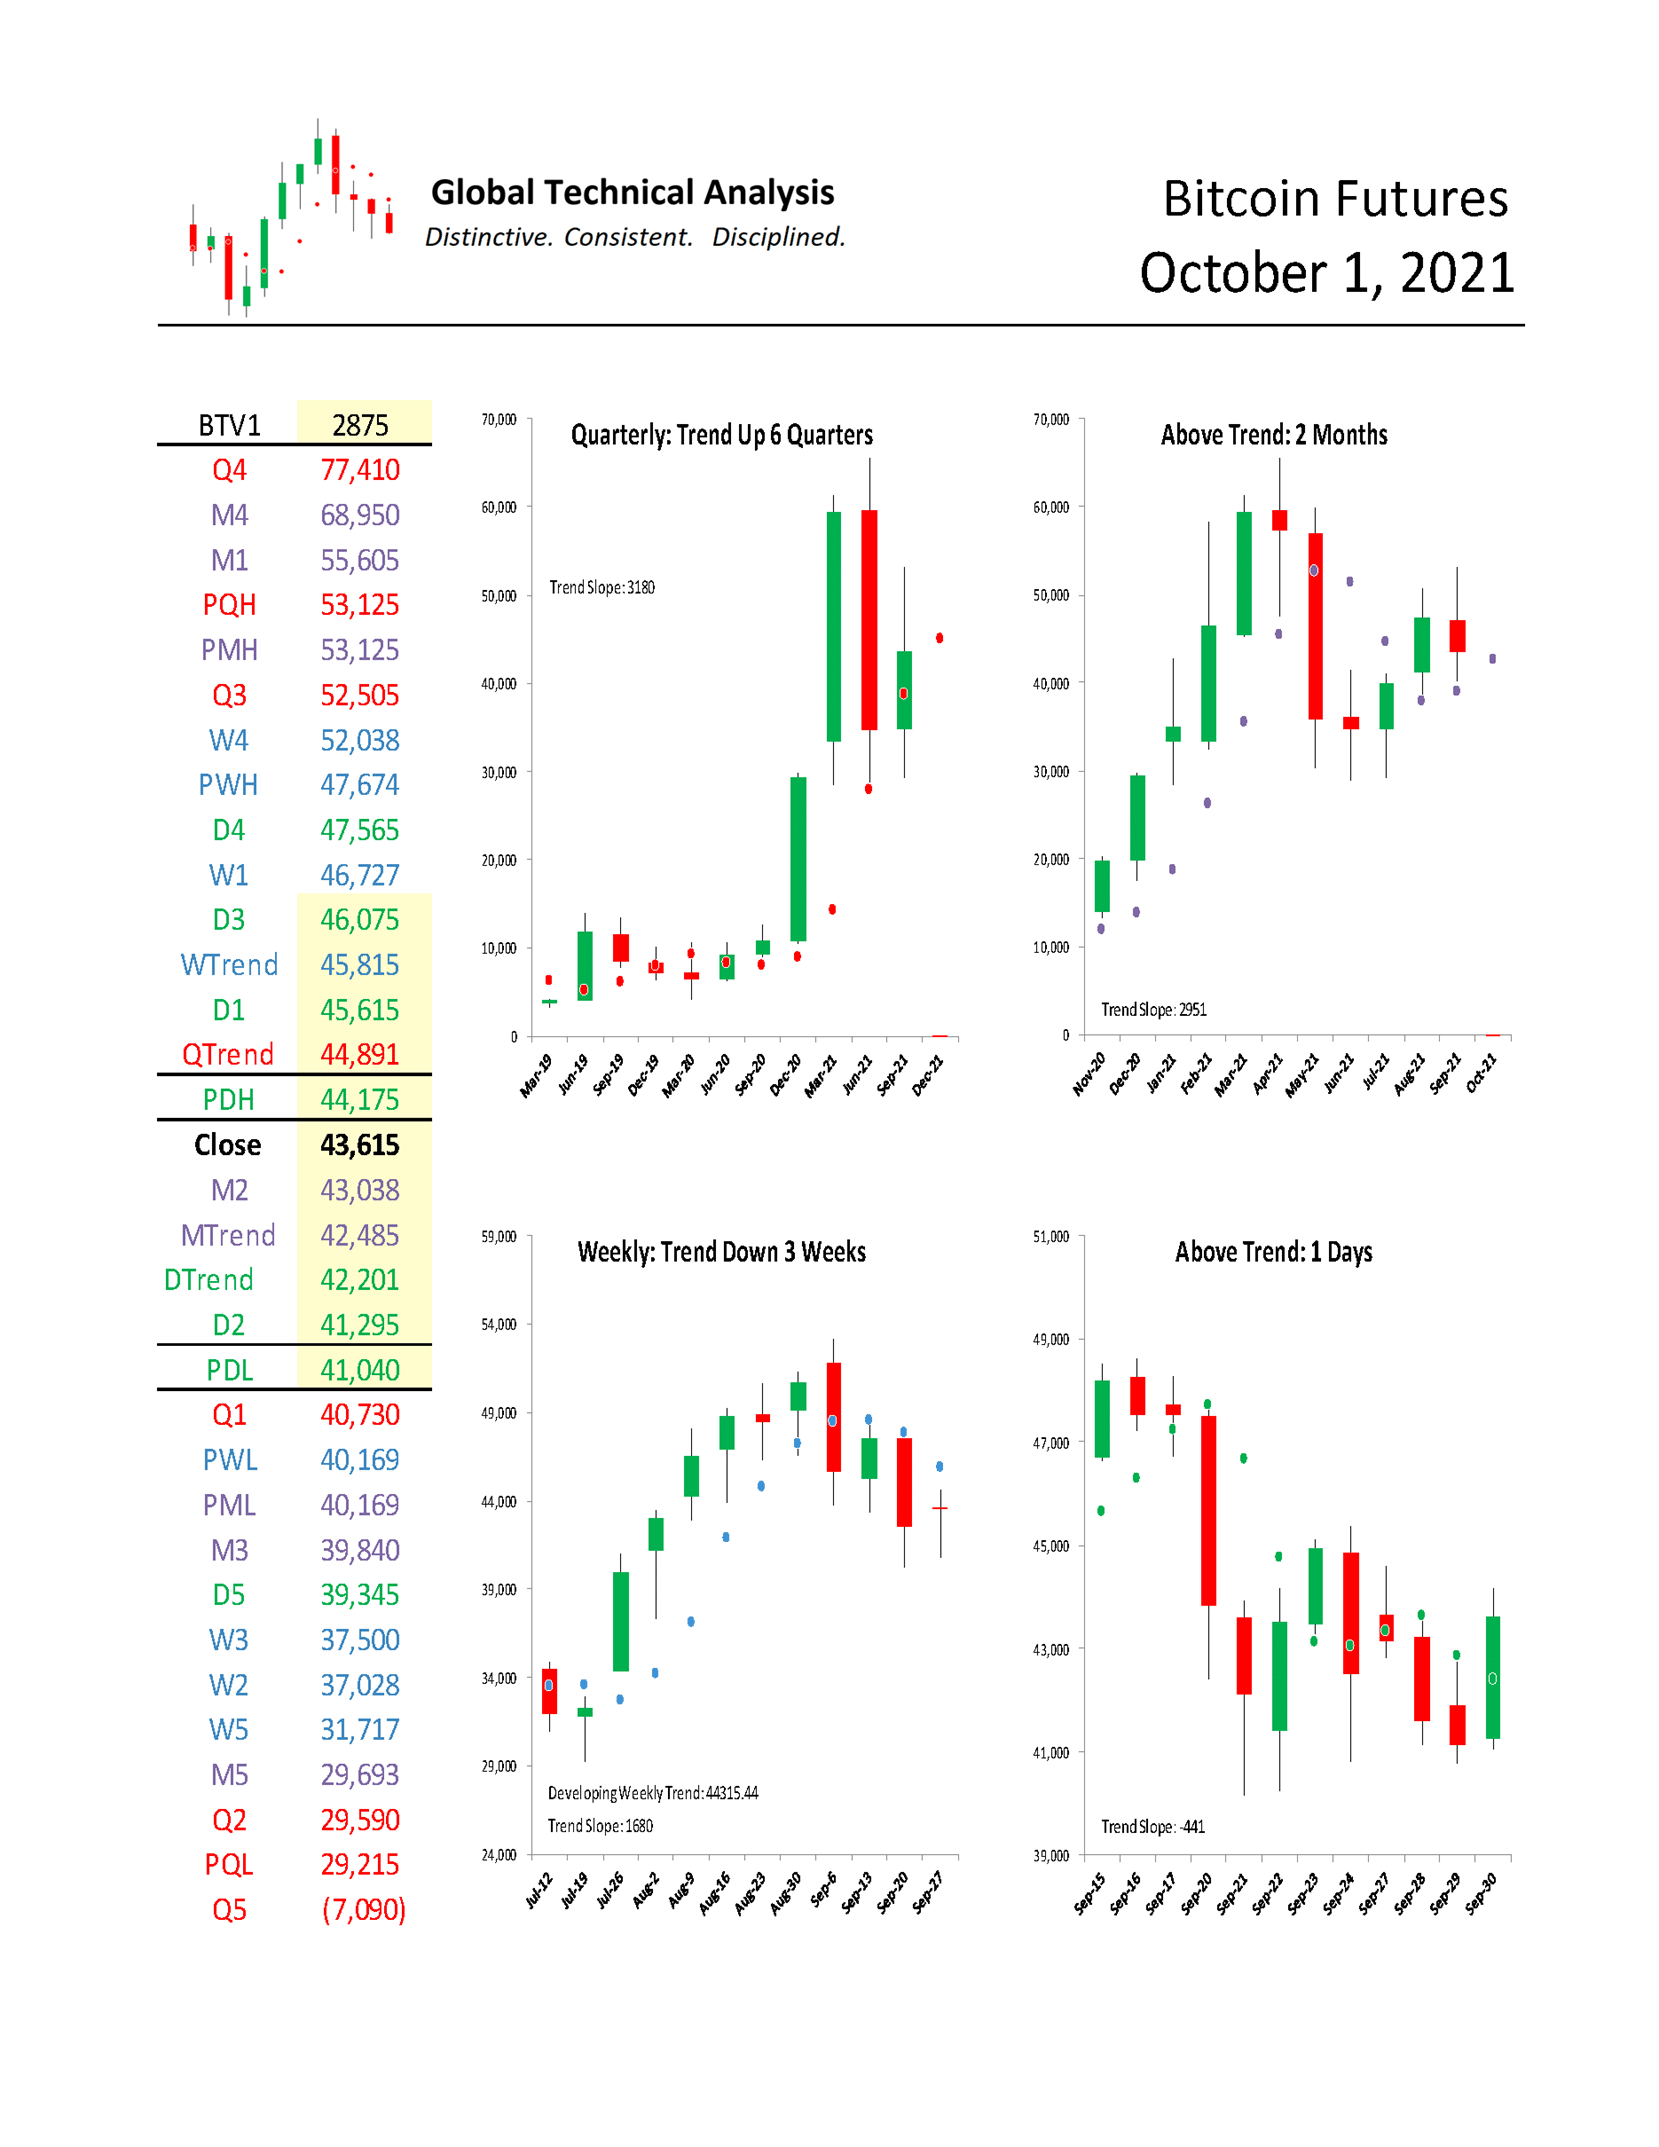
For October, we focus on Bitcoin Futures. We provide a monthly time-period analysis of BTV1. The same analysis can be completed for any time-period or in aggregate.
Trends:
o Weekly Trend 45,815
o Quarterly Trend 44,891
o Current Settle 43,615
o Monthly Trend 42,485
o Daily Trend 42,201
The relative positioning of the Trend Levels is in the early stages of transitioning from bullish to bearish. Think of the relative positioning of the Trend Levels like you would a moving-average cross. As can be seen in the quarterly chart below, bitcoin is “Trend Up”, having settled six quarters above Quarterly Trend. Stepping down one time-period, the monthly chart shows that bitcoin is “Above Trend: 2 Months”, having settled two months above Monthly Trend. Stepping down to the weekly time-period, the chart shows that bitcoin is “Trend Down”, having settled below Weekly Trend for three weeks.
One rule we have is to anticipate a two-period high (low), within the following four to six periods, after a Downside (Upside) Exhaustion level has been reached. The signal was given the month of May to anticipate a two-month high within the next four to six months. That high was achieved in August. The signal was given in 1Q2021 to anticipate a two-quarter low within the next four to six quarters (now two to four). That low can be achieved this quarter with a trade below 28,840. The Quarterly Downside Exhaustion level for this quarter is effectively zero. As you snicker… the last time our work suggested a negative Downside Exhaustion level, WTI Crude Oil traded negative. Is that highly probable, no, but we keep an open mind.
It appears that the pressure on “risk” assets is increasing. While we are not certain that the bull market is complete, we do warn a regime change is looking more probable from our technical viewpoint as well as from a fundamental perspective.
Support/Resistance:
In isolation, monthly support and resistance levels for October are:
o M4 68,950
o M1 55,605
o PMH 53,125
o Close 43,615
o M2 43,038
o MTrend 42,485
o PML 40,169
o M3 39,840
o M5 29,693
Active traders can use MTrend: 42,485 as the initial pivot, maintaining a long position above that level and a flat or short position below it.
Summary
The power of technical analysis is in its ability to reduce multi-dimensional markets into a filtered two-dimensional space of price and time. Our methodology applies a consistent framework that identifies key measures of trend, distinct levels of support and resistance, and identification of potential trading ranges. Our methodology can be applied to any security or index, across markets, for which we can attain a reliable price history. We look forward to bringing you our unique brand of technical analysis and insight into many different markets. If you are a professional market participant and are open to discovering more, please connect with us. We are not asking for a subscription; we are asking you to listen.


Also Read


