J. Brett Freeze and his firm Global Technical Analysis (GTA) provides RIA Pro subscribers Cartography Corner on a monthly basis. Brett’s analysis offers readers a truly unique brand of technical insight and risk framework. We personally rely on Brett’s research to help better gauge market trends, their durability, and support and resistance price levels.
GTA presents their monthly analysis on a wide range of asset classes, indices, and securities. At times the analysis may agree with RIA Pro technical opinions, and other times it will run contrary to our thoughts. Our goal is not to push a single view or opinion, but provide research to help you better understand the markets. Please contact us with any questions or comments. If you are interested in learning more about GTA’s services, please connect with them through the links provided in the article.
The link below penned by GTA provides a user’s guide and a sample of his analysis.
March 2021 Review
E-Mini S&P 500 Futures
We begin with a review of E-Mini S&P 500 Futures (ESM1) during March 2021. In our March 2021 edition of The Cartography Corner, we wrote the following:
In isolation, monthly support and resistance levels for March are:
o M4 4266.00
o M1 4056.25
o PMH 3959.25
o M3 3913.25
o Close 3809.25
o MTrend 3749.19
o M2 3660.50
o PML 3656.50
o M5 3450.75
Active traders can use MTrend: 3749.19 as the pivot, maintaining a long position above that level and a flat or short position below it.
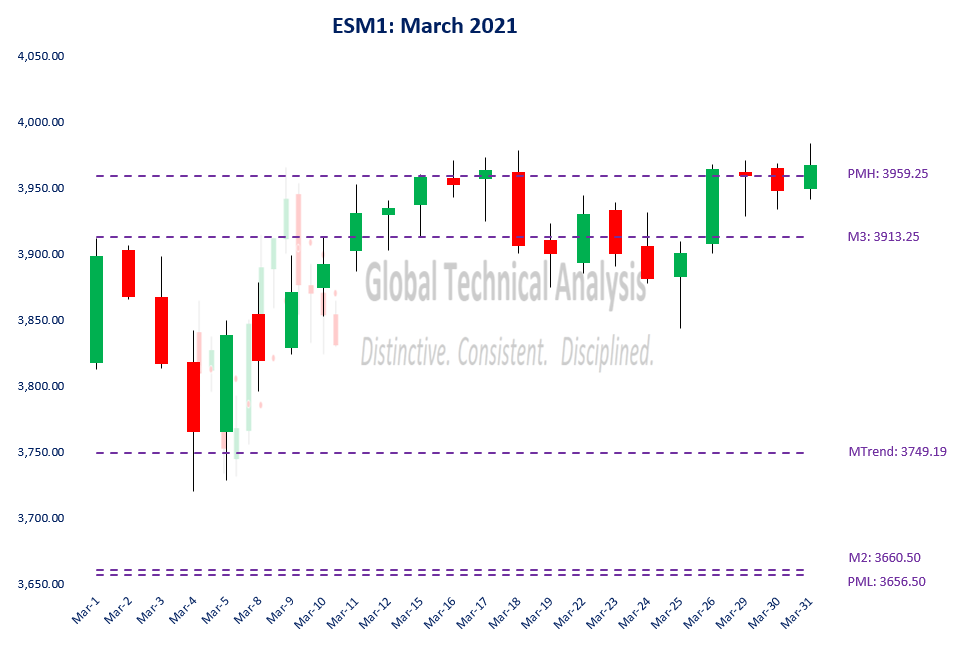
Figure 1 below displays the daily price action for March 2021 in a candlestick chart, with support and resistance levels isolated by our methodology represented as dashed lines. Our isolated levels at MTrend: 3749.19 and PMH: 3959.25 essentially contained the realized range (settlement basis).
The first trading session of March conjured memories of the first trading session of February. The market price rallied 89.50 points, 2.35%. Sellers appeared in front of our isolated resistance level at M3: 3913.25, with the high for that session, realized at 3912.00.
Over the following three trading sessions, the market price declined 4.57% (March 4th intra-session low). It achieved and exceeded our isolated pivot level at MTrend: 3749.19. However, importantly, the market price did not settle below MTrend.
The following seven trading sessions saw the market price rally, reaching our second isolated resistance level at PMH: 3959.25. A cumulative rally from its low of 239.75 points, or 6.44%, amidst an interest rate environment that saw yields continue to rise. Market participants appear to have forgotten about the inverse relationship between discount rates and the present value of long-dated cash flows, but I digress.
Over the final twelve trading sessions of March, the market price essentially range traded between PMH: 3959.25 and M3: 3913.25. Conservatively, active traders who bought against MTrend: 3749.19 realized a gain of 5.15%.
Figure 1:
10-Year Treasury Note Futures
We continue with a review of 10-Year Treasury Note Futures (TYM1) during March 2021. In our March 2021 edition of The Cartography Corner, we wrote the following:
In isolation, monthly support and resistance levels for March are:
o M4 138-18
o PMH 137-10
o M1 136-13
o MTrend 136-10
o Close 132-23
o PML 131-31
o M3 128-13
o M2 127-29
o M5 125-24
Active traders can use PML: 131-31 as the pivot, maintaining a long position above that level and a flat or short position below it.
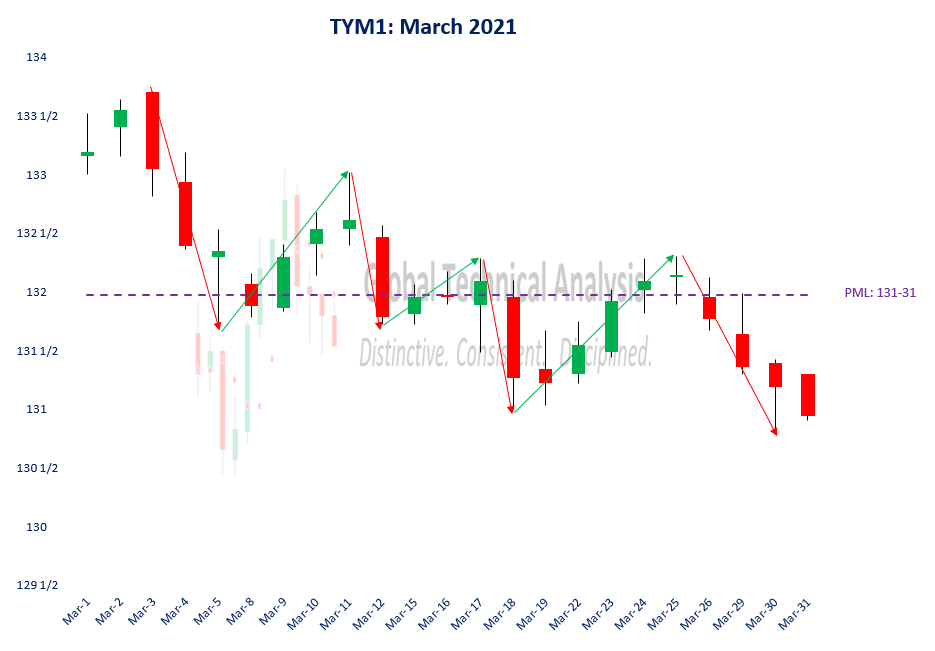
Figure 2 below displays the daily price action for March 2021 in a candlestick chart, with support and resistance levels isolated by our methodology represented as dashed lines. Within the overall context of a continuing move to lower prices, the realized price action in March consisted of seven swings, four down and three up. Our isolated pivot level at PML: 131-31 was the center point of the realized range.
Down Swings:
- March 3 – March 5, 133-22 to 131-24
- March 11 – March 12, 133-01 to 131-23
- March 17 – March 18, 132-09 to 131-00
- March 25 – March 31, 132-10 to 130-26
Up Swings:
- March 5 – March 11, 131-24 to 133-01
- March 12 – March 17, 131-23 to 132-09
- March 18 – March 25, 131-00 to 132-10
Conservatively, active traders following our analysis got “chopped up”. They executed six trades, with five losers, realizing a cumulative loss of 2-14 points.
April 2021 Analysis
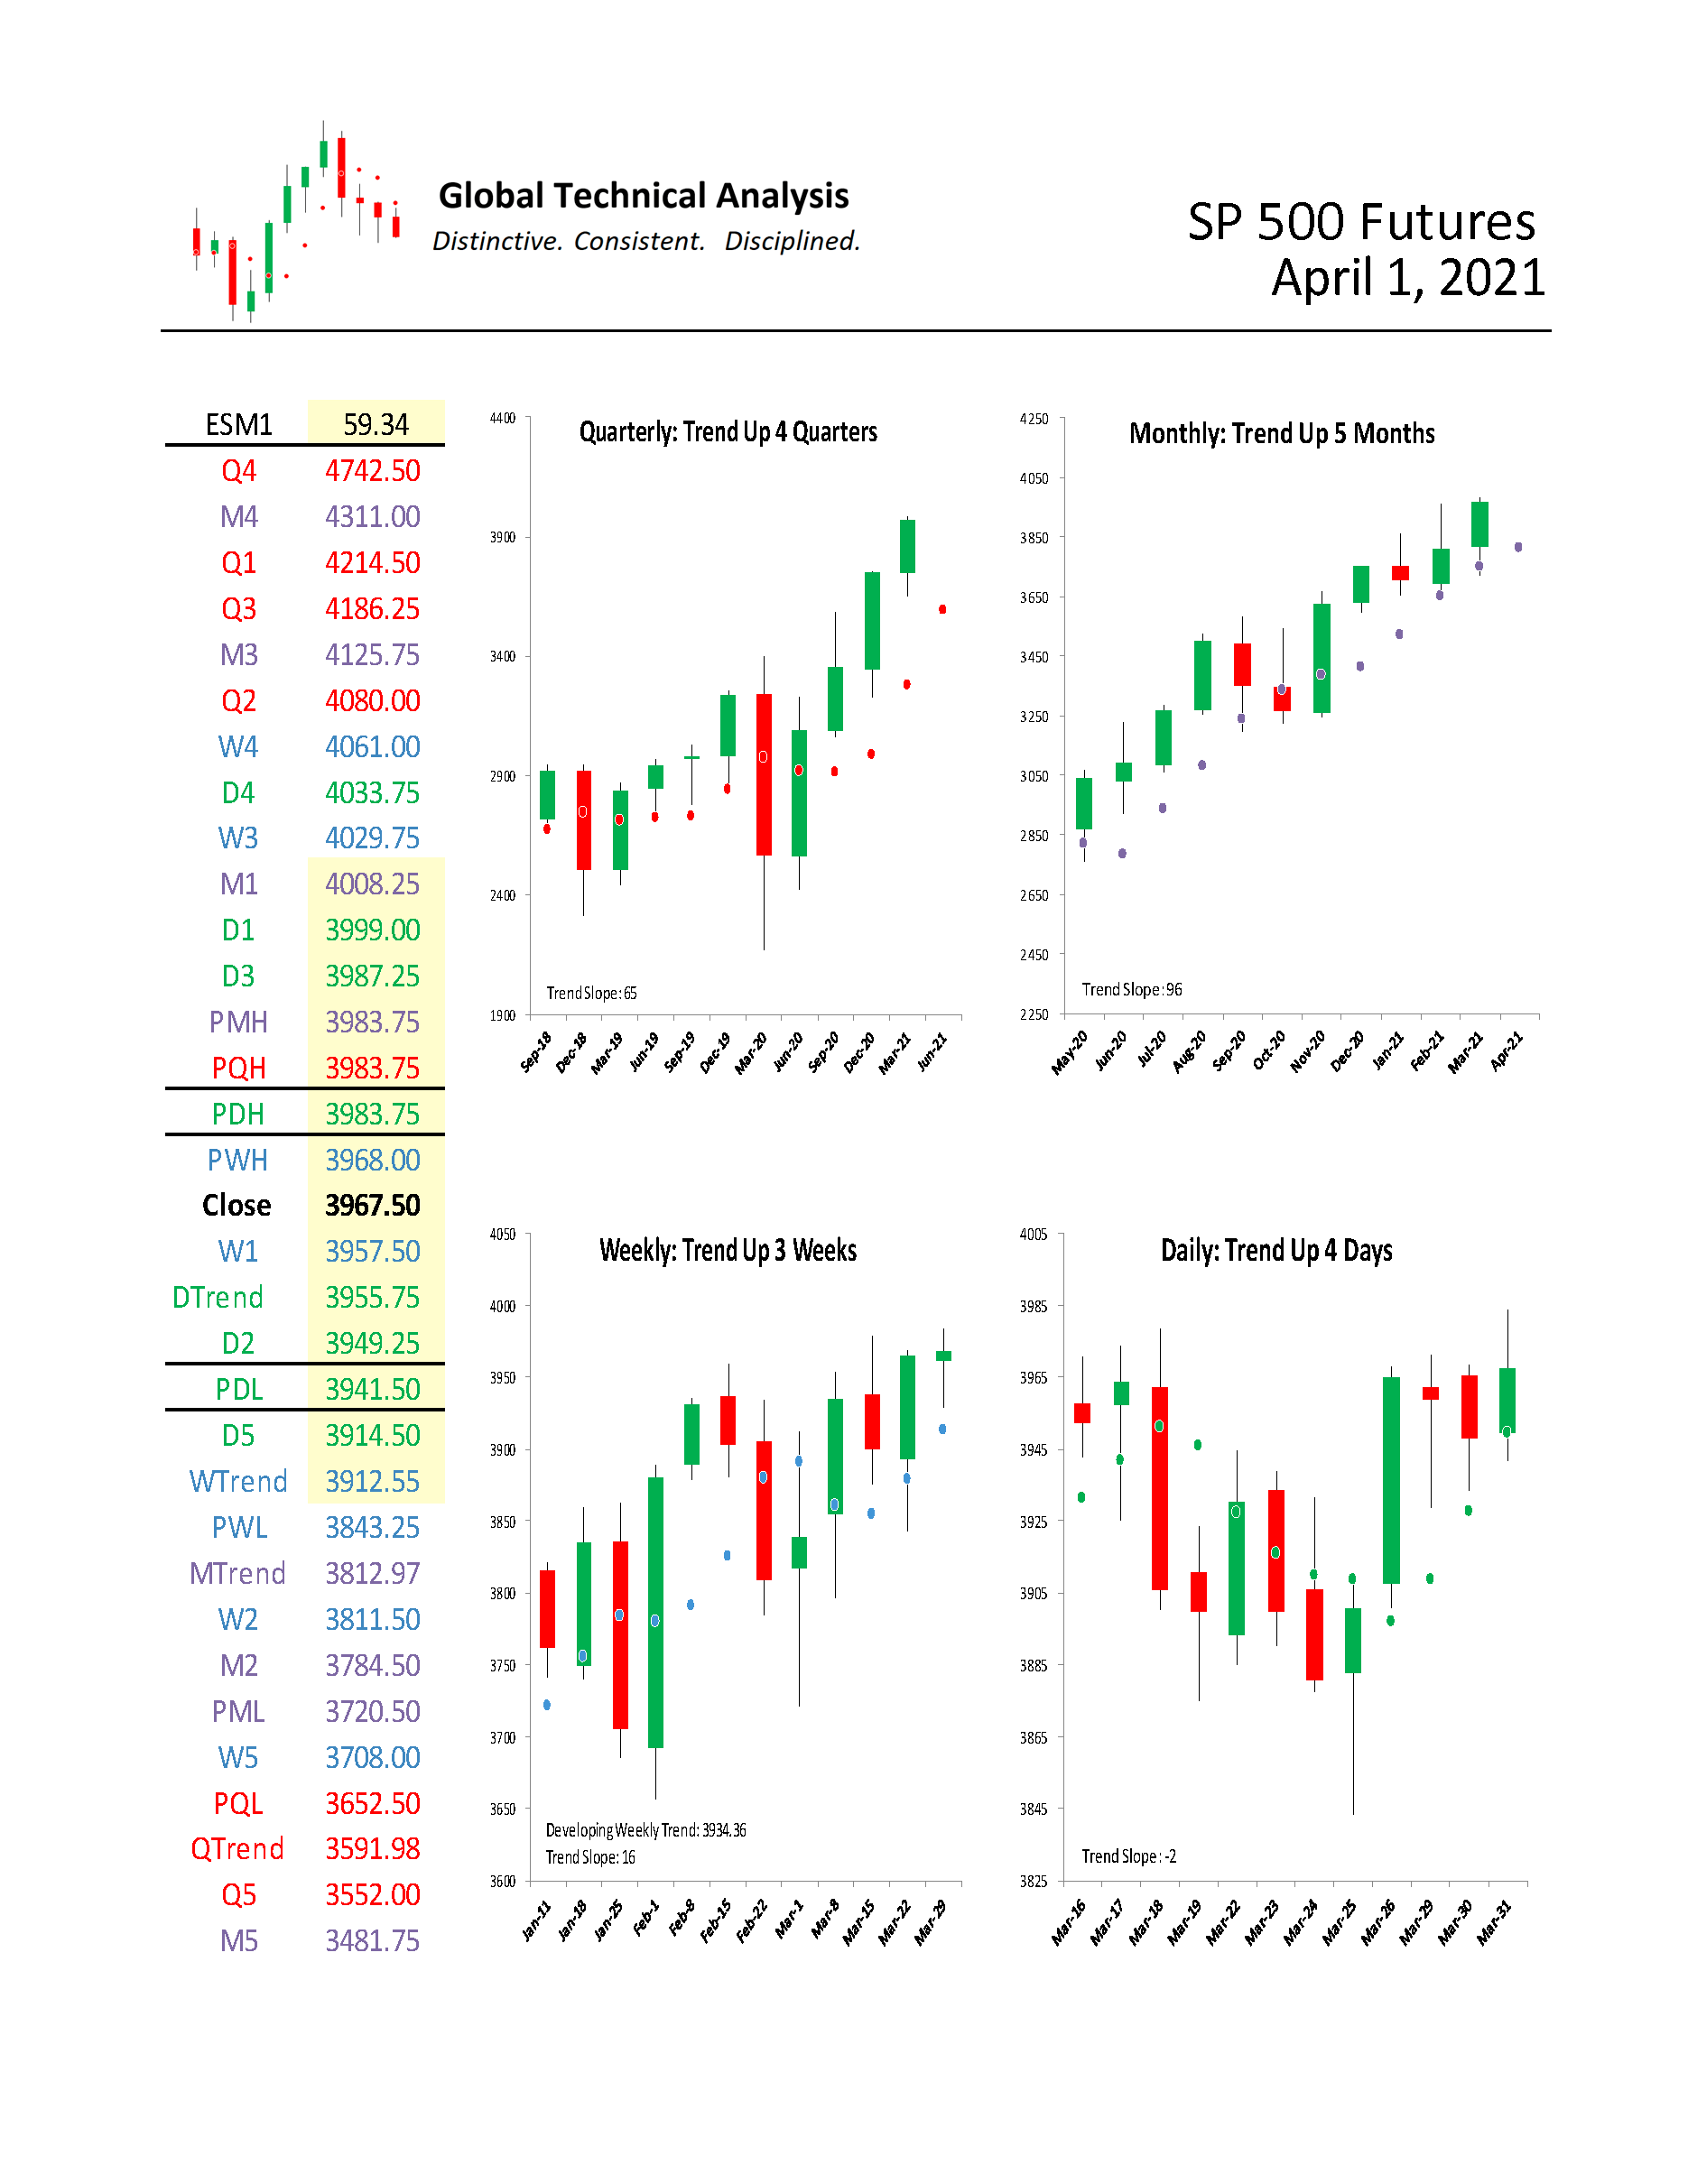
We begin by providing a monthly time-period analysis of E-Mini S&P 500 Futures (ESM1). The same analysis can be completed for any time-period or in aggregate.
Trends:
o Current Settle 3967.50
o Daily Trend 3955.75
o Weekly Trend 3912.55
o Monthly Trend 3812.97
o Quarterly Trend 3591.98
The relative positioning of the Trend Levels is as bullish as possible. Think of the relative positioning of the Trend Levels like you would a moving-average cross. In the quarterly time-period, the chart shows that E-Mini S&P 500 Futures are “Trend Up”, having settled above Quarterly Trend for four quarters. Stepping down one time-period, the monthly chart shows that E-Mini S&P 500 Futures are “Trend Up”, settling five months above Monthly Trend. Stepping down to the weekly time-period, the chart shows that E-Mini S&P 500 Futures are “Trend Up”, settling three weeks above Weekly Trend.
Support/Resistance:
In isolation, monthly support and resistance levels for April are:
o M4 4311.00
o M3 4125.75
o M1 4008.25
o PMH 3983.75
o Close 3967.50
o MTrend 3812.97
o M2 3784.50
o PML 3720.50
o M5 3481.75
Active traders can use PMH: 3983.75 as the pivot, maintaining a long position above that level and a flat or short position below it.
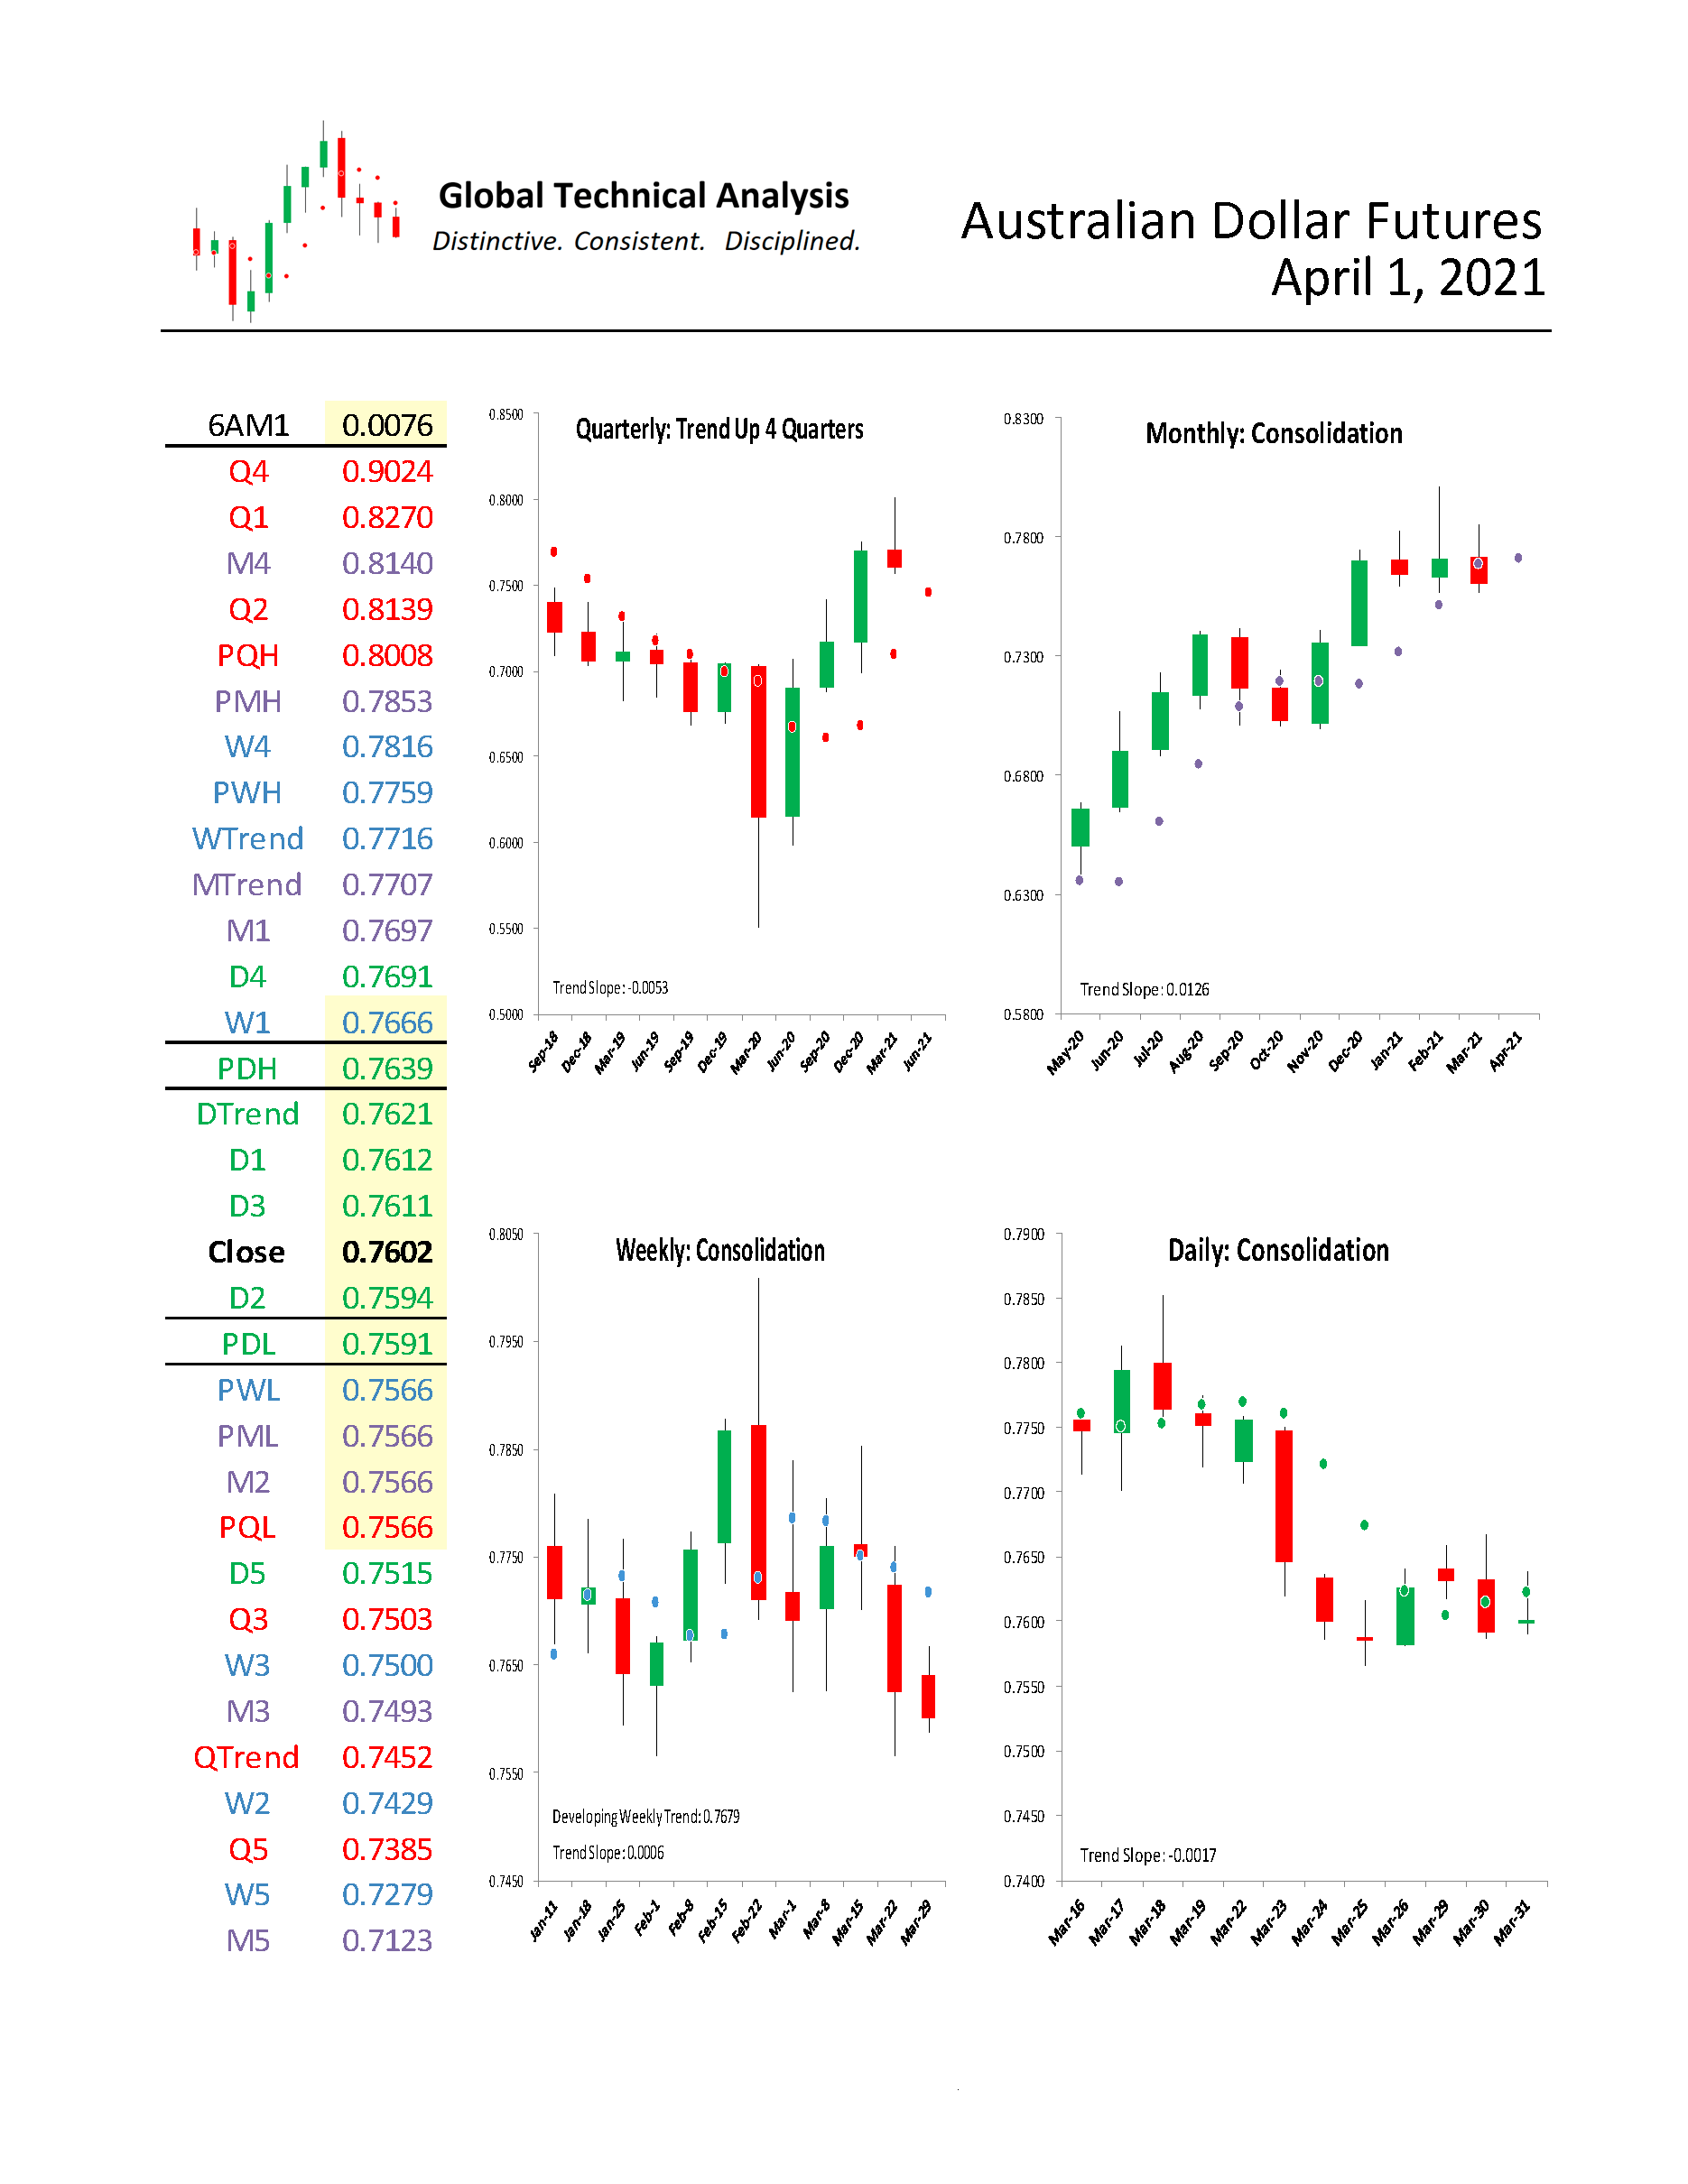
Australian Dollar Futures
For April, we focus on Australian Dollar Futures (“the Aussie dollar”). We provide a monthly time-period analysis of 6AM1. The same analysis can be completed for any time-period or in aggregate.
Trends:
o Weekly Trend 0.7716
o Monthly Trend 0.7707
o Daily Trend 0.7621
o Current Settle 0.7602
o Quarterly Trend 0.7452
The relative positioning of the Trend Levels is bearish. Think of the relative positioning of the Trend Levels like you would a moving-average cross. As can be seen in the quarterly chart below, the Aussie dollar is “Trend Up”, having settled above Quarterly Trend for four quarters. Stepping down one time-period, the monthly chart shows that the Aussie dollar is in “Consolidation”, after having been “Trend Up” for four months. Stepping down to the weekly time-period, the chart shows that the Aussie dollar is in “Consolidation”, settling below Weekly Trend in four of the previous five weeks.
Figure 3 below, thankfully supplied to us by Michael Lebowitz of RIA Advisors, demonstrates the high correlation between the Aussie dollar and 5yr U.S. Implied Inflation. As shown by the arrow in the graph, although generally coincident with Implied Inflation, the Aussie dollar led inflation’s turn lower in late 2017. In our judgment, this is one example of the reflation/inflation narrative possibly having exhausted itself in market pricing.
Figure 3:
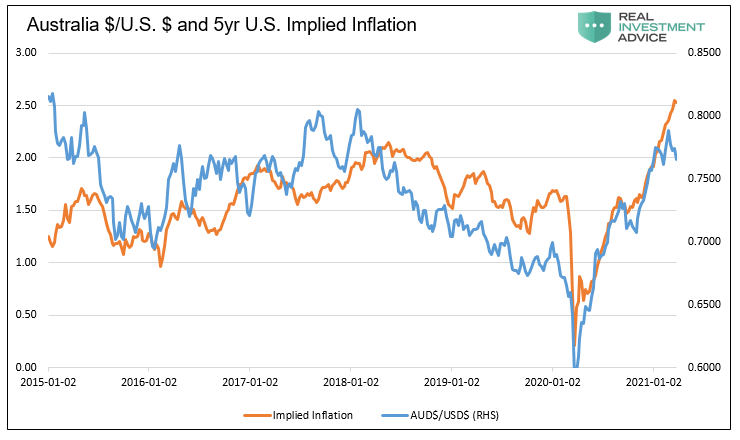
One rule we have is to anticipate a two-period high (low), within the following four to six periods, after a Downside (Upside) Exhaustion level has been reached. The signal was given the week of March 22nd to anticipate a two-week high within the next four to six weeks (now, three to five weeks). That high can be achieved this week with a trade above 0.78525.
Support/Resistance:
In isolation, monthly support and resistance levels for April are:
o M4 0.8140
o PMH 0.7853
o MTrend 0.7707
o M1 0.7697
o Close 0.7602
o PML 0.7566
o M2 0.7566
o M3 0.7493
o M5 0.7123
Active traders can use MTrend: 0.7707 as the pivot, maintaining a long position above that level and a flat or short position below it.
Summary
The power of technical analysis is in its ability to reduce multi-dimensional markets into a filtered two-dimensional space of price and time. Our methodology applies a consistent framework that identifies key measures of trend, distinct levels of support and resistance, and identification of potential trading ranges. Our methodology can be applied to any security or index, across markets, for which we can attain a reliable price history. We look forward to bringing you our unique brand of technical analysis and insight into many different markets. If you are a professional market participant and are open to discovering more, please connect with us. We are not asking for a subscription; we are asking you to listen.

Also Read