


J. Brett Freeze and his firm Global Technical Analysis (GTA) provides RIA Pro subscribers Cartography Corner on a monthly basis. Brett’s analysis offers readers a truly unique brand of technical insight and risk framework. We personally rely on Brett’s research to help better gauge market trends, their durability, and support and resistance price levels.
GTA presents their monthly analysis on a wide range of asset classes, indices, and securities. At times the analysis may agree with RIA Pro technical opinions, and other times it will run contrary to our thoughts. Our goal is not to push a single view or opinion, but provide research to help you better understand the markets. Please contact us with any questions or comments. If you are interested in learning more about GTA’s services, please connect with them through the links provided in the article.
The link below penned by GTA provides a user’s guide and a sample of his analysis.
January 2022 Review
E-Mini S&P 500 Futures
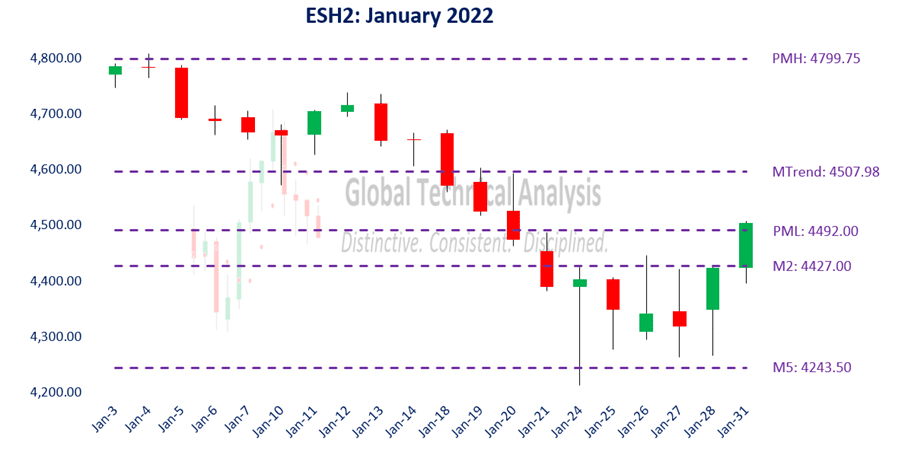
We begin with a review of E-Mini S&P 500 Futures (ESH2) during January 2022. In our January 2022 edition of The Cartography Corner, we wrote the following:
In isolation, monthly support and resistance levels for January are:
o M4 5042.50
o M3 4950.75
o M1 4859.00
o PMH 4799.75
o Close 4758.50
o MTrend 4597.08
o PML 4492.00
o M2 4427.00
o M5 4243.50
Active traders can use PMH: 4799.75 as the pivot, maintaining a long position above that level and a flat or short position below it.
Figure 1 below displays the daily price action for January 2022 in a candlestick chart, with support and resistance levels isolated by our methodology represented as dashed lines. Our isolated pivot at the Previous Month High was tested intra-session during the second trading session. On a settlement basis, it held. The high market price for the month was realized on January 4th at 4808.25.
Over the following nine trading sessions, the market price declined (5.16%) from the previous high to the intra-day low on January 18th. Importantly, it settled below Monthly Trend. Over the next four trading sessions, the decline accelerated.
On progressively increasing volume market participants offered the market price down to, and slightly below, our isolated Monthly Downside Exhaustion Level at M5: 4243.50. The low market price for the month was realized on January 24th at 4212.75. The remaining six trading sessions saw the market price consolidate within a wide range, essentially bound by M5: 4243.50 on the downside and PML: 4492.00 on the upside.
Our analysis captured 93.4% of January’s realized range.
Figure 1:
Gold Futures
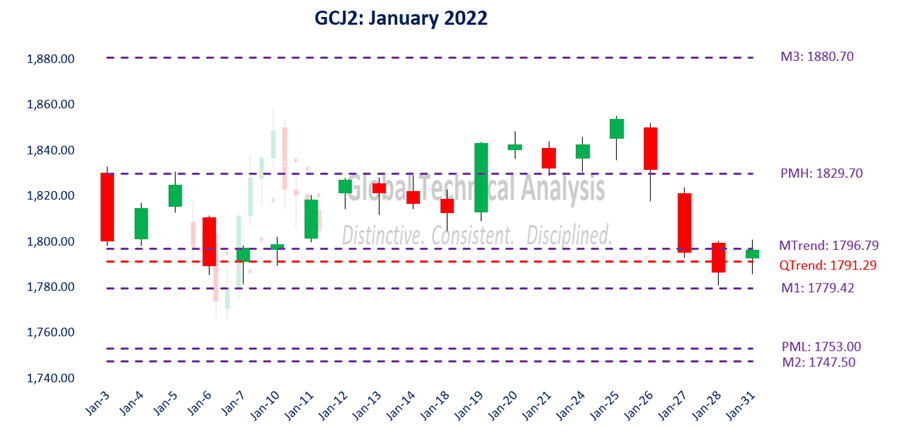
We continue with a review of Gold Futures (GCJ2) during January 2022. In our January 2022 edition of The Cartography Corner, we wrote the following:
In isolation, monthly support and resistance levels for January are:
o M4 1900.90
o M3 1880.70
o PMH 1829.70
o Close 1828.60
o MTrend 1796.79
o QTrend 1791.29
o M1 1779.42
o PML 1753.00
o M2 1747.50
o M5 1626.02
Active traders can use QTrend: 1791.29 as the initial pivot, maintaining a long position above that level and a flat or short position below it.
Figure 2 below displays the daily price action for January 2022 in a candlestick chart, with support and resistance levels isolated by our methodology represented as dashed lines. The first three trading sessions in January saw the market price oscillate between our isolated resistance level at PMH: 1829.70 and our isolated support level at MTrend: 1796.79. On January 6th, the market price settled below our isolated pivot level at QTrend: 1791.29.
Early-session weakness on January 7th stopped just short of our isolated support level at M1: 1779.42. The market price reversed higher and settled the session back above both QTrend and MTrend. Over the following seven trading sessions gold rallied to and settled above, our isolated resistance level at PMH: 1829.70. It remained above PMH on a settlement basis through the next five trading sessions, ending on January 26th.
On January 27th, the market price broke below PMH: 1829.70 and declined back into our clustered support levels of MTrend: 1796.79 / QTrend: 1791.29 / M1: 1779.42. The final two trading sessions were spent oscillating within those levels.
Figure 2:
February 2022 Analysis
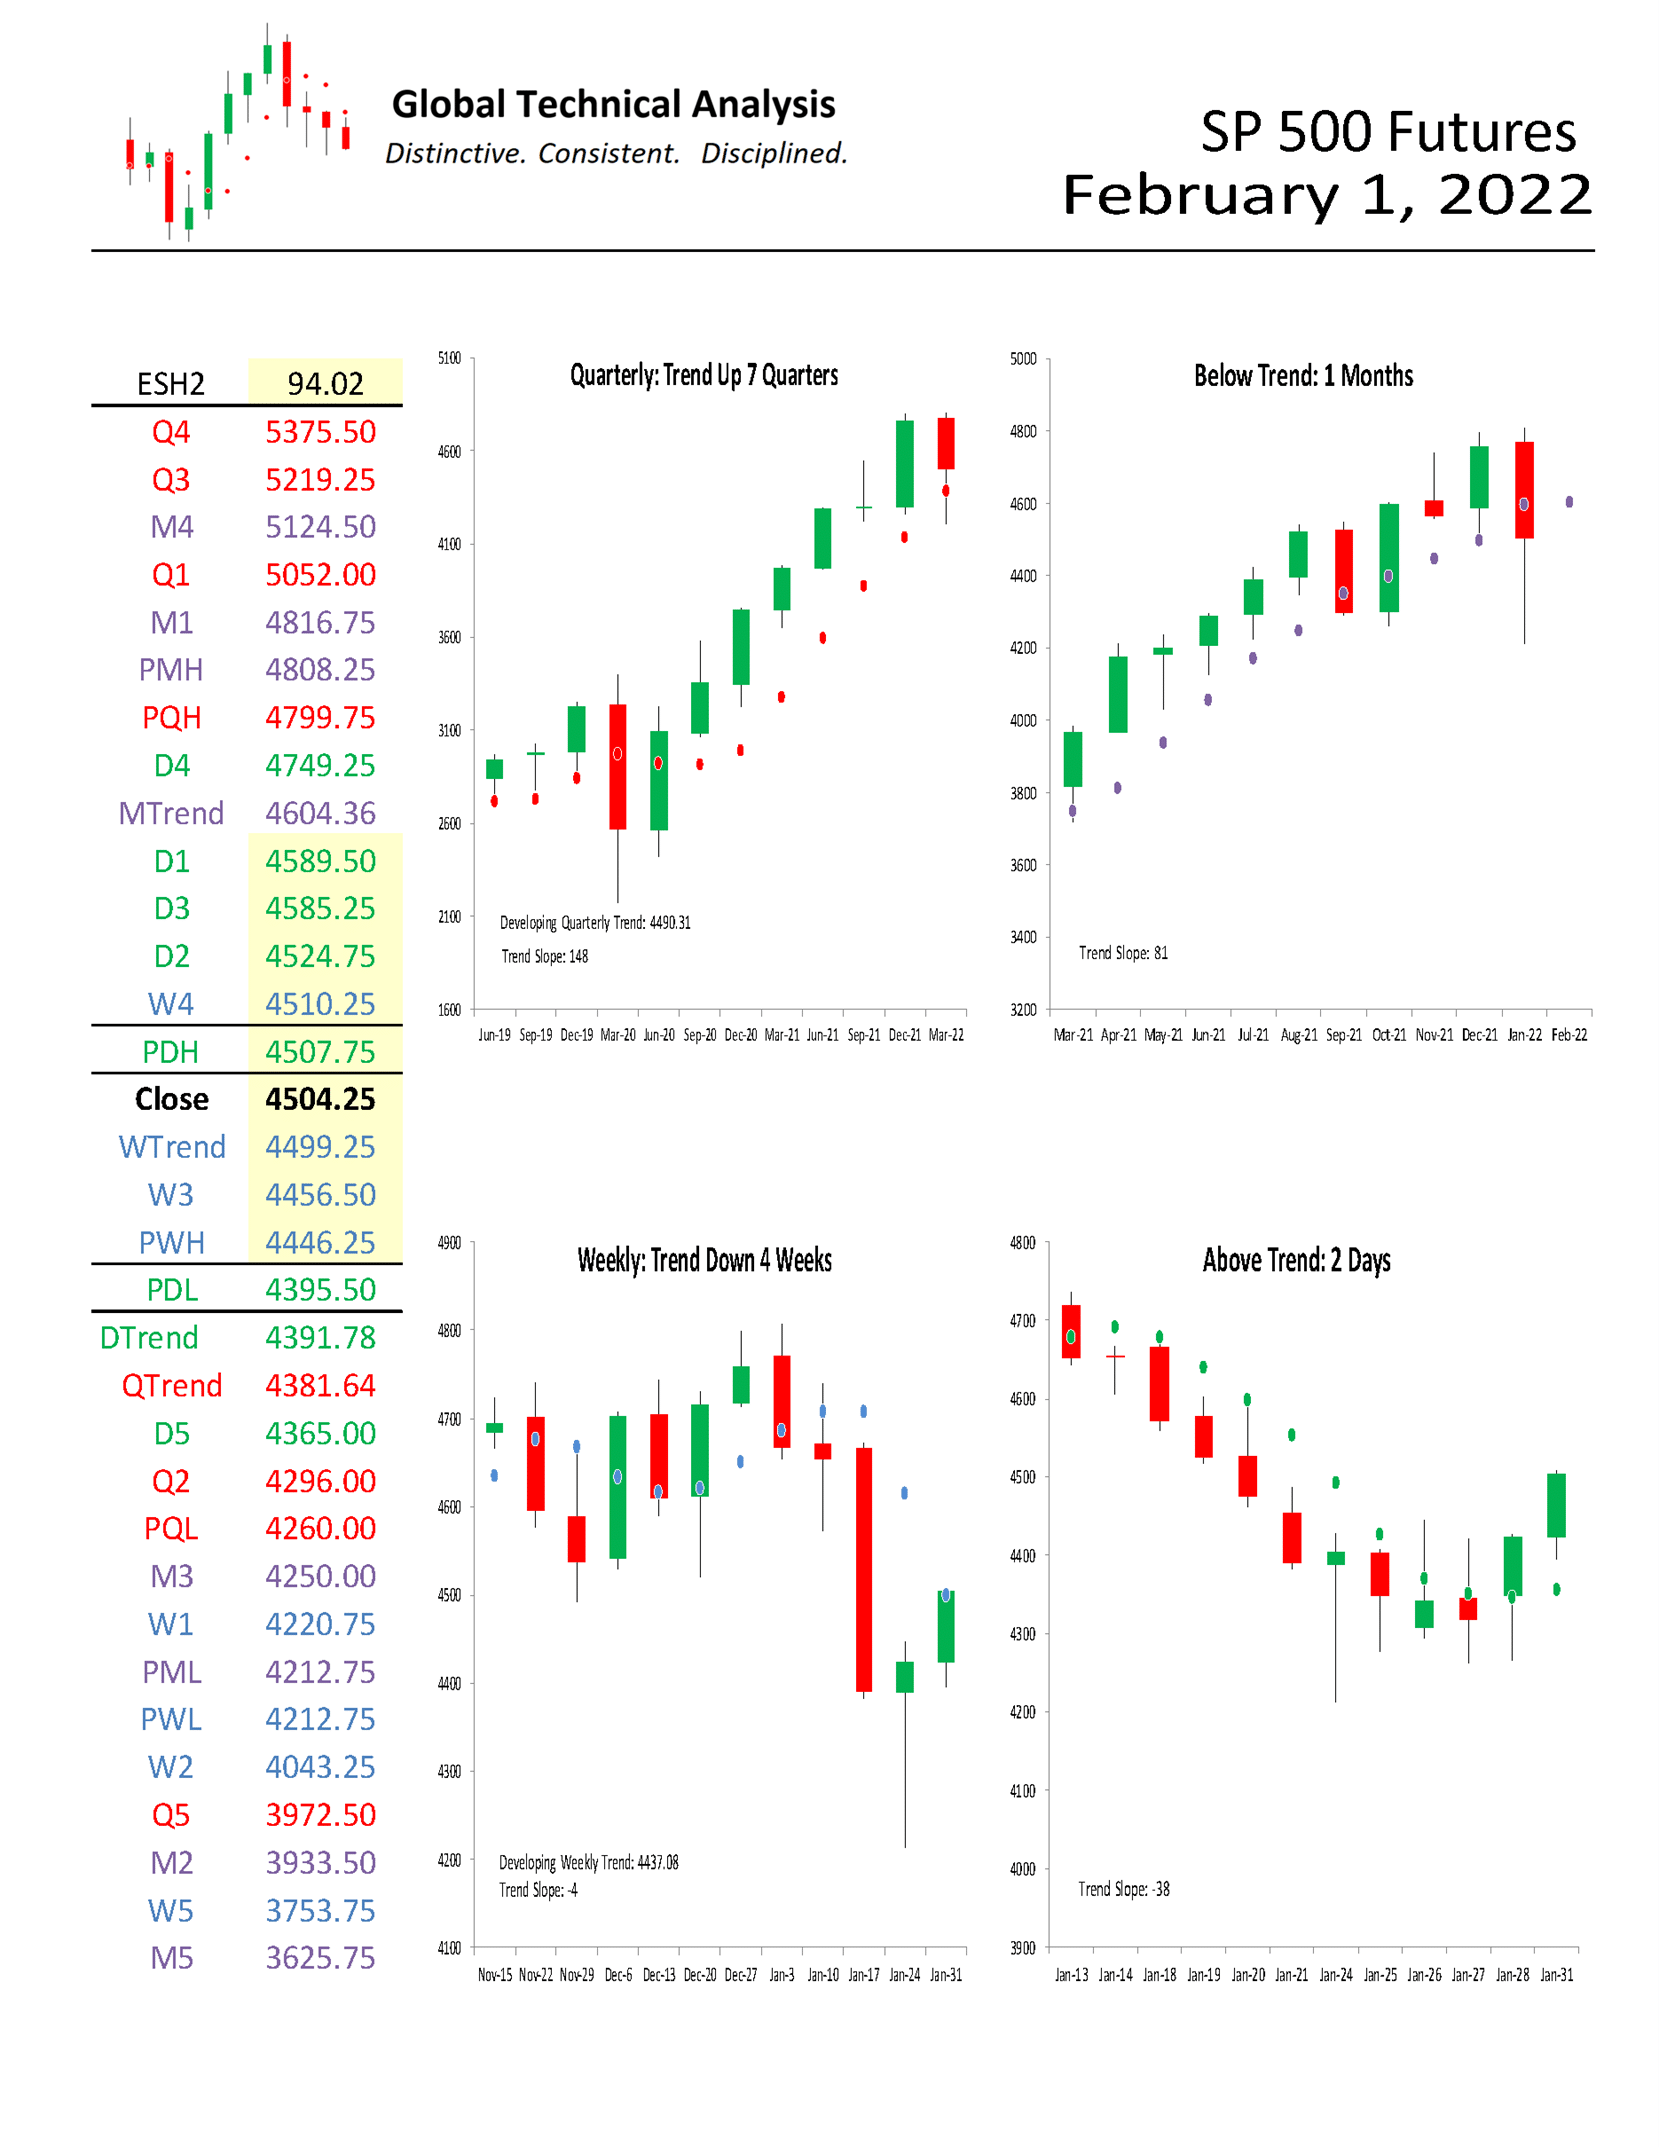
We begin by providing a monthly time-period analysis of E-Mini S&P 500 Futures (ESH2). The same analysis can be completed for any time-period or in aggregate.
Trends:
o Monthly Trend 4604.36
o Current Settle 4504.25
o Weekly Trend 4499.25
o Daily Trend 4391.78
o Quarterly Trend 4381.64
The relative positioning of the Trend Levels is transitioning to bearish. Think of the relative positioning of the Trend Levels like you would a moving-average cross. In the quarterly time-period, the chart shows that E-Mini S&P 500 Futures are “Trend Up”, having settled above Quarterly Trend for seven quarters. Stepping down one time-period, the monthly chart shows that E-Mini S&P 500 Futures are “Below Trend: 1 Months”, having settled below Monthly Trend in January. Stepping down to the weekly time-period, the chart shows that E-Mini S&P 500 Futures are “Trend Down”, having settled below Weekly Trend for four weeks.
One rule we have is to anticipate a two-period high (low), within the following four to six periods, after a Downside (Upside) Exhaustion level has been reached. The signal was given the week of January 3rd to anticipate a two-week high within the next four to six weeks. With two weeks remaining in the time window, that high can be achieved this week with a trade above 4671.75. A signal was given in January to anticipate a two-month high within the next four to six months. That high can be achieved in February with a trade above 4808.25.
Monthly Structural Momentum has just begun to retreat from its extreme right tail and Weekly Structural Momentum is neutral. Trend Persistence, which measures the strength of the trend across multiple periods, is neutral. By our measures, this market is not oversold. We encourage our clients to review those graphs on the website. If you would like further insight into these measures, please contact us. We are happy to discuss them with you on an individual basis.
Support/Resistance:
In isolation, monthly support and resistance levels for February are:
o M4 5124.50
o M1 4816.75
o PMH 4808.25
o MTrend 4604.36
o Close 4504.25
o M3 4250.00
o PML 4212.75
o M2 3933.50
o M5 3625.75
Active traders can use MTrend: 4604.36 as the pivot, maintaining a long position above that level and a flat or short position below it.
WTI Crude Oil Futures
For February, we focus on WTI Crude Oil Futures (“crude”). We provide a monthly time-period analysis of CLH2. The same analysis can be completed for any time-period or in aggregate.
Trends:
o Current Settle 88.15
o Daily Trend 87.37
o Weekly Trend 84.19
o Monthly Trend 75.76
o Quarterly Trend 71.37
The relative positioning of the Trend Levels is as bullish as possible. Think of the relative positioning of the Trend Levels like you would a moving-average cross. As can be seen in the quarterly chart below, crude is “Trend Up”, having settled above Quarterly Trend for five quarters. Stepping down one time-period, the monthly chart shows that crude is “Above Trend: 1 Months”. Stepping down to the weekly time-period, the chart shows that crude is “Trend Up”, having settled above Weekly Trend for seven weeks.
One rule we have is to anticipate a two-period high (low), within the following four to six periods, after a Downside (Upside) Exhaustion level has been reached. A signal was given in November to anticipate a two-month high within the next four to six months. That high was achieved in January. A signal was given in 1Q2021 to anticipate a two-quarter low within the next four to six quarters. With two quarters remaining in the time window, that low can be achieved this quarter with a trade below 61.74.
Speculative Positioning, Structural Momentum (both Weekly and Monthly), and Trend Persistence are all in the far-right tail of their distribution. We encourage our clients to review those graphs on the website.
Support/Resistance:
In isolation, monthly support and resistance levels for February are:
o M4 115.25
o M3 101.09
o M1 100.24
o PMH 88.84
o Close 88.15
o M2 86.11
o MTrend 75.76
o PML 74.27
o M5 71.10
Active traders can use PMH: 88.84 as the initial pivot, maintaining a long position above that level and a flat or short position below it.

Summary
The power of technical analysis is in its ability to reduce multi-dimensional markets into a filtered two-dimensional space of price and time. Our methodology applies a consistent framework that identifies key measures of trend, distinct levels of support and resistance, and identification of potential trading ranges. Our methodology can be applied to any security or index, across markets, for which we can attain a reliable price history. We look forward to bringing you our unique brand of technical analysis and insight into many different markets. If you are a professional market participant and are open to discovering more, please connect with us. We are not asking for a subscription; we are asking you to listen.

Also Read


