
Our most recent newsletter (Analysts Warn of Recession. Analysts Disagree) discusses confusing signals emanating from the stock and bond markets. To wit: “Currently, 100% of the 10-yield spreads we track are inverted. Historically, a recession follows whenever more than 50% of those spreads are inverted. Every. Single. Time.“ Yet despite a 100% reliable recession warning- “With the market, as shown in the callout, retesting and holding above the 40-week moving average, such confirms both the long-term and short-term bullish trends are intact.“
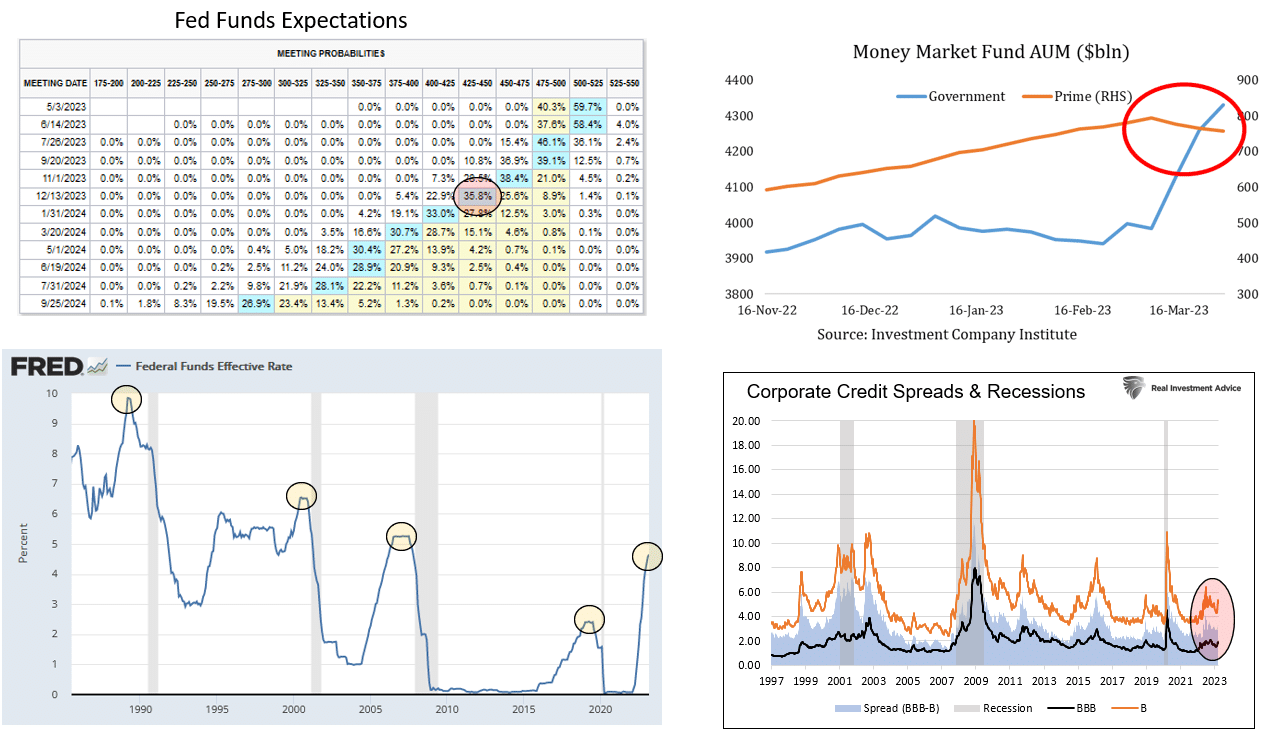
Unfortunately, the signals from within the bond markets are equally confusing. Fed Funds futures (top left graph) expect the Fed to cut rates by .75 to 1.00% by year end. The graph on the bottom left shows that Fed Funds peaked and declined, as the market currently projects, before the start of the last four recessions. Despite recession concerns, corporate bond spreads (bottom right), which tend to widen before and during recessions, send no such signal. Lastly, the most risk-averse investors are shifting from prime money market funds to government money market funds. Prime funds, holding short-term corporate bonds, have negligible risk, yet the flight to safety is pronounced, as we show (top right). Investment and mental flexibility will be important this year as diverging signals sort themselves out.
What To Watch Today
Earnings

Economy

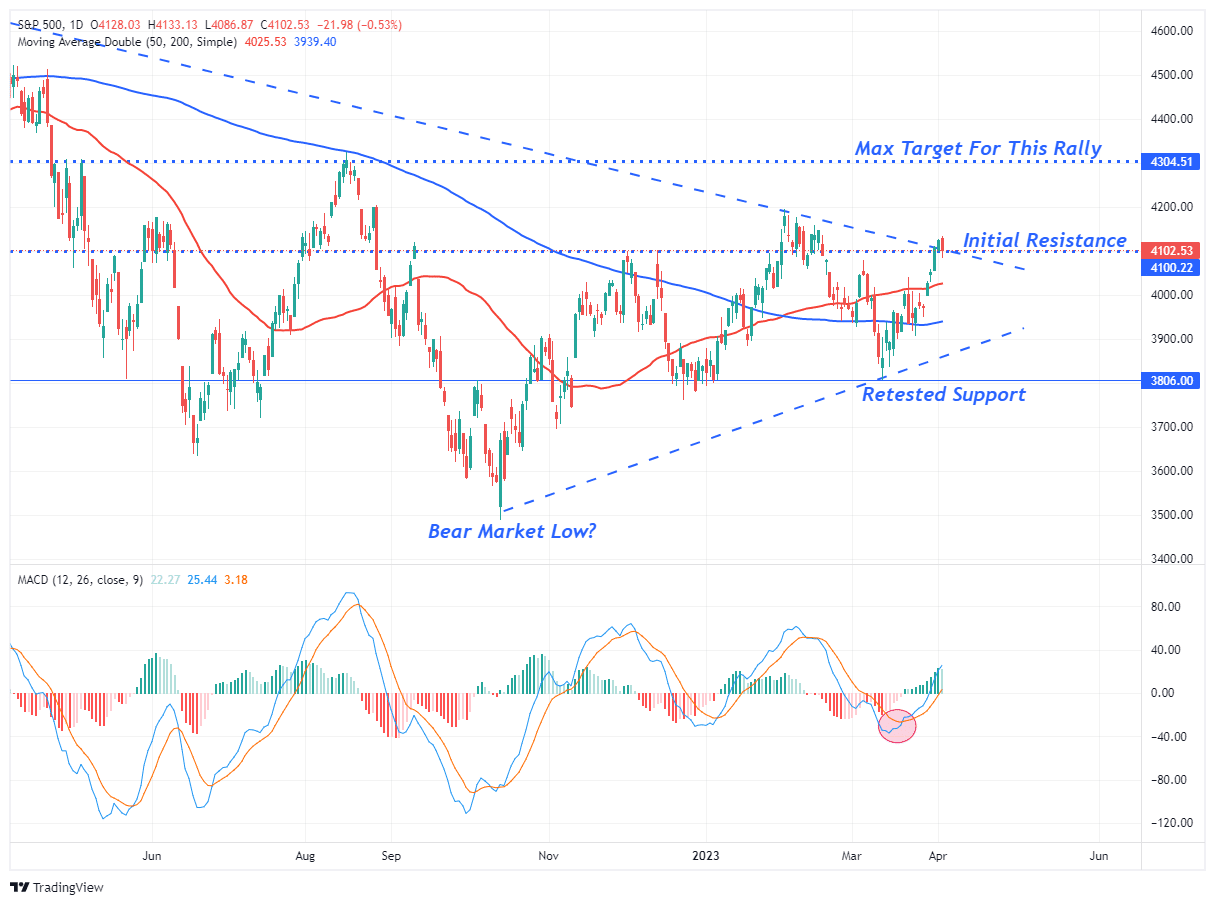
Market Trading Update
The market finally took a bit of a breather yesterday after a torrid run last week. Importantly, as discussed yesterday, the market is testing the breakout of the downtrend line from the April high. A failure here will set the market up for an initial retest of the 50-DMA, which, if it holds, will be a bullish setup for another advance. Today’s challenge will be to hold that break above the downtrend resistance line and turn it into support by weeks end.
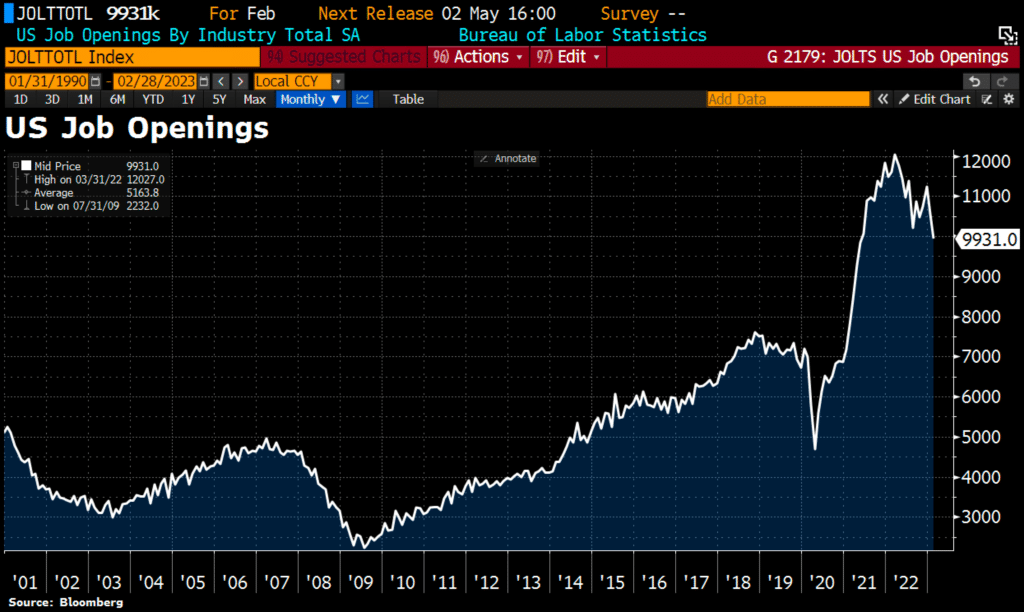
While the JOLTS data remains strong, this week’s big economic data point is the employment report which will likely determine the Fed’s next move. Given that the reports have consistently come in above expectations, a strong report will most assuredly keep the Fed on its current rate-hiking trajectory, which will not be market-friendly. As I noted in this past weekend’s newsletter, some selling pressure this week was unsurprising. To wit:
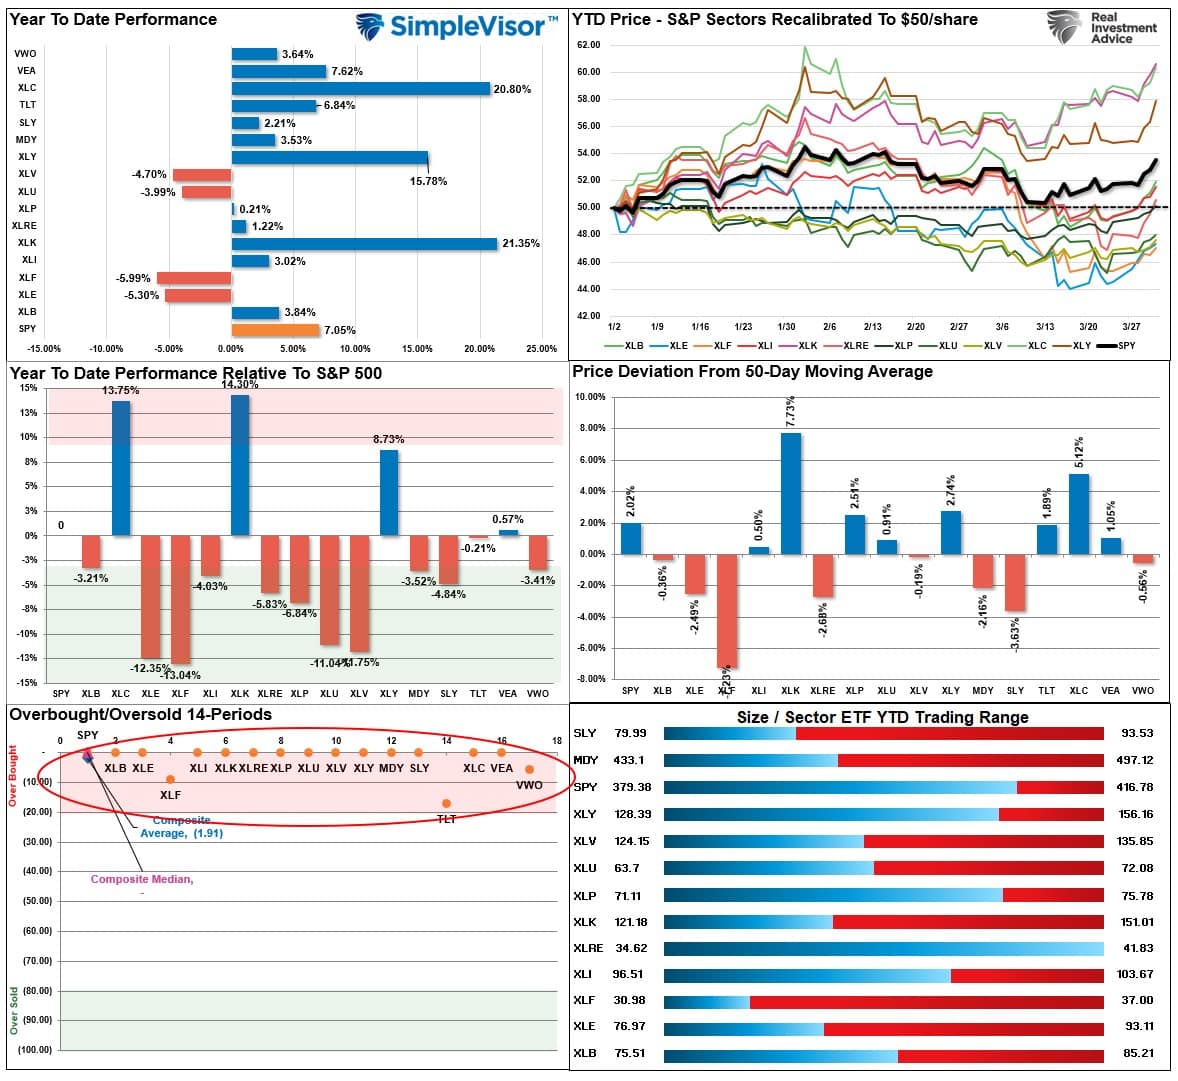
“After last week’s bullish push higher, every major sector and market is now highly overbought short-term. Look for a bit of correction next week, which will provide an opportunity to increase exposure for the next couple of weeks. April tends to be one of the more robust performance months of the year, and while markets are short-term overbought, they remain on solid bullish buy signals for now.”

Cognitive Dissonance- Behavioral Traits II
Cognitive dissonance is similar to confirmation bias. This condition is experienced by an individual who holds two or more inconsistent thoughts simultaneously, including new information that conflicts with existing beliefs.
As we led this Commentary, the stock and bond markets and traditional recession signals are sending inconsistent messages. As a result, we must strive to be flexible in our outlook and trading behavior. Listening to diverging data points is important. But having an open mind and considering that this time may be different is equally critical to investment success.
Jolts, ISM, and the Atlanta Fed Point to Slowing Growth
The number of job openings plunged in February from 10.5 million to 9.9 million. January’s number was revised lower by about 300k jobs as well. The number of openings is still very high, but the trend is lower. Because JOLTs reflect February data, it has not captured any employment actions resulting from the banking crisis.
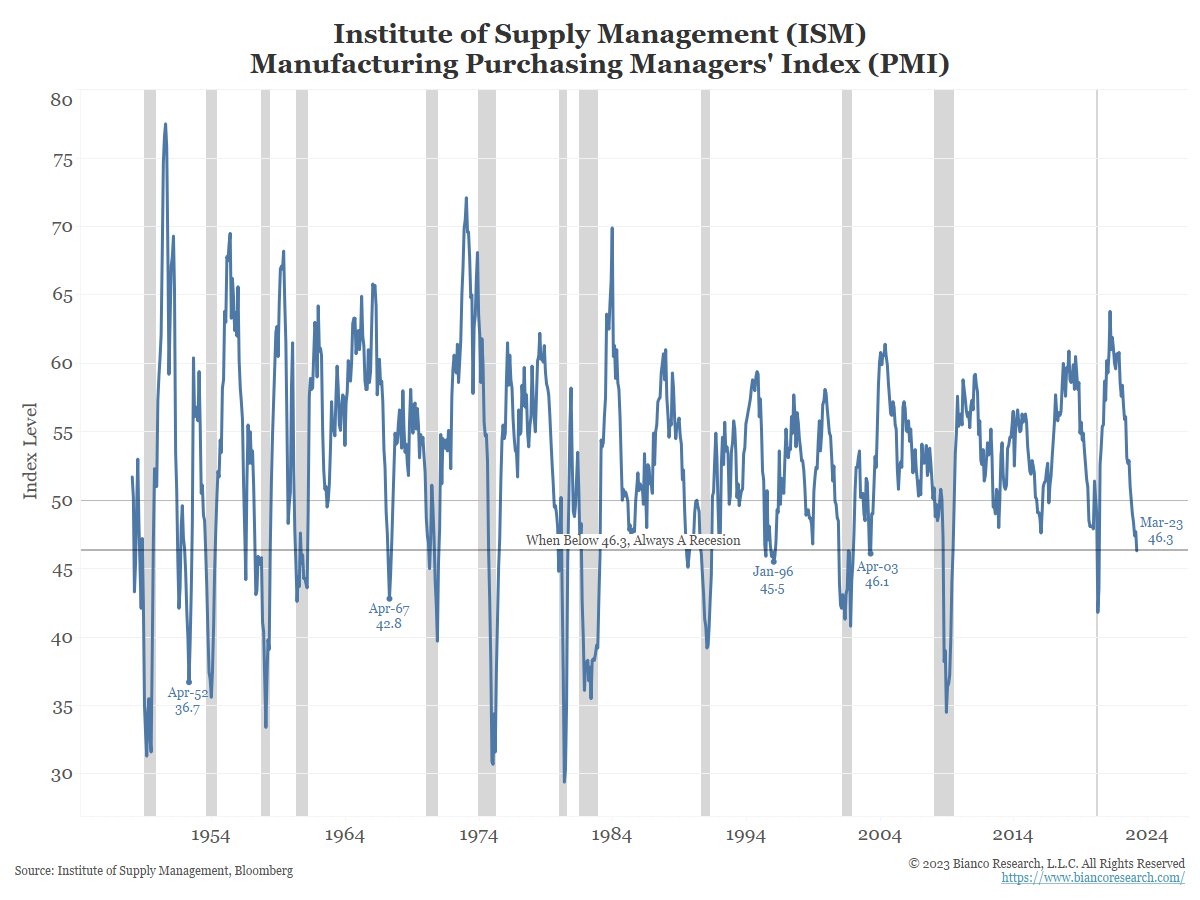
The ISM manufacturing survey, as shown below courtesy of Bianco Research, slipped to 46.3. Since 1950 the index has been below the current level 15 times. Only three of those instances did not accompany a recession. All of the subindexes, including employment, are in economic contraction territory. New Orders, a reliable leading indicator, fell from 47 to 44.3.
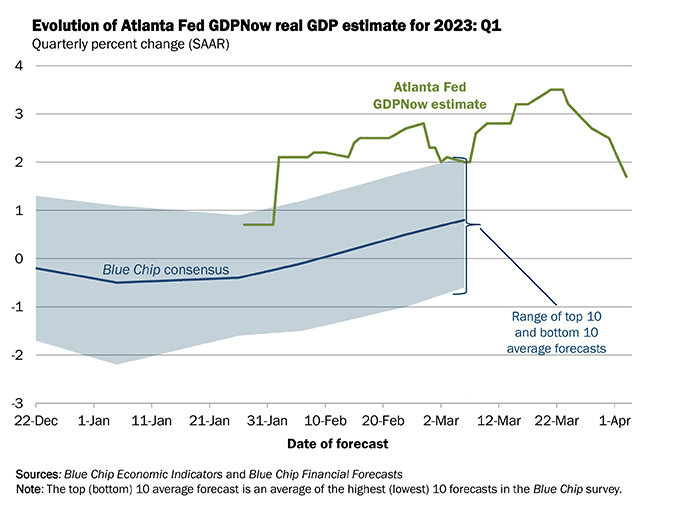
Lastly, the Atlanta Fed’s GDP forecast is falling quickly. The projection only uses actual data. The GDP projection in late March was +3.5%. That largely included data from January and February. Therefore, given the sharp decline, the forecasts point to rapidly slowing economic activity in March.
Profit Margin Compression
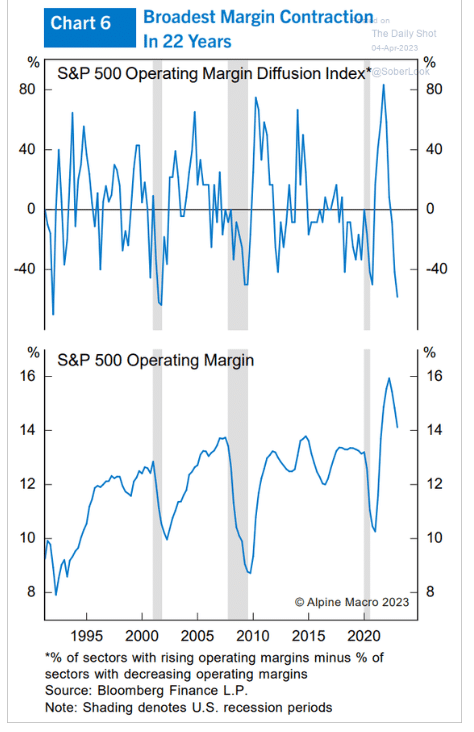
The graphs below from the Daily Shot show the broadest margin compression since 2000. The diffusion index measures the net percentage of S&P 500 firms reporting higher versus lower profit margins. Similarly, the second graph shows that profit margins have retracted. But they still have more room to fall to get back to normal.
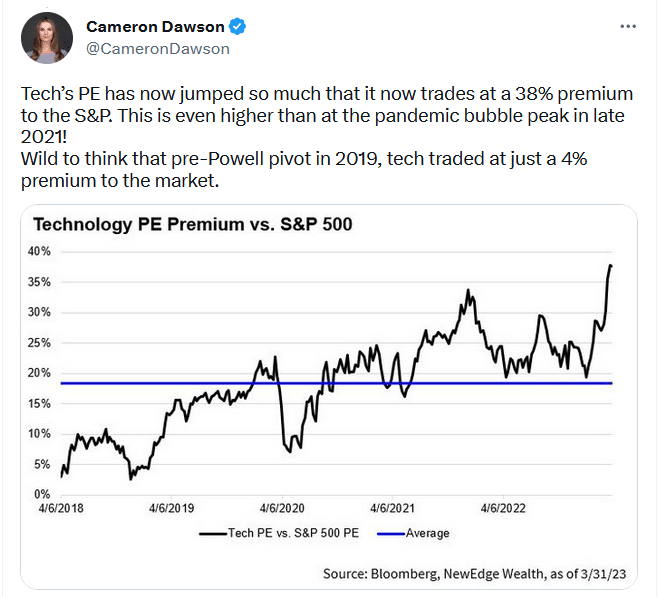
Tweet of the Day
Please subscribe to the daily commentary to receive these updates every morning before the opening bell.
If you found this blog useful, please send it to someone else, share it on social media, or contact us to set up a meeting.

