Trading Bitcoin since its inception has been like riding a roller coaster. In January 2015, Bitcoin was trading at $164. By May 2021, Bitcoin traded near $65,000 but then fell sharply to $30,000 in just a few months. It rebounded to a new high of $70,000 in six months, only to fall below $20,000 earlier this year. Since then, its price has been relatively stable, leading its supporters to claim it’s starting to behave more like a currency. For a currency to have value as a transaction unit, its price must remain fairly constant. For instance, if you are selling widgets and accept Bitcoin in exchange, you are risking not only your profit but could quickly run a loss if the price of Bitcoin follows its regular trading patterns.
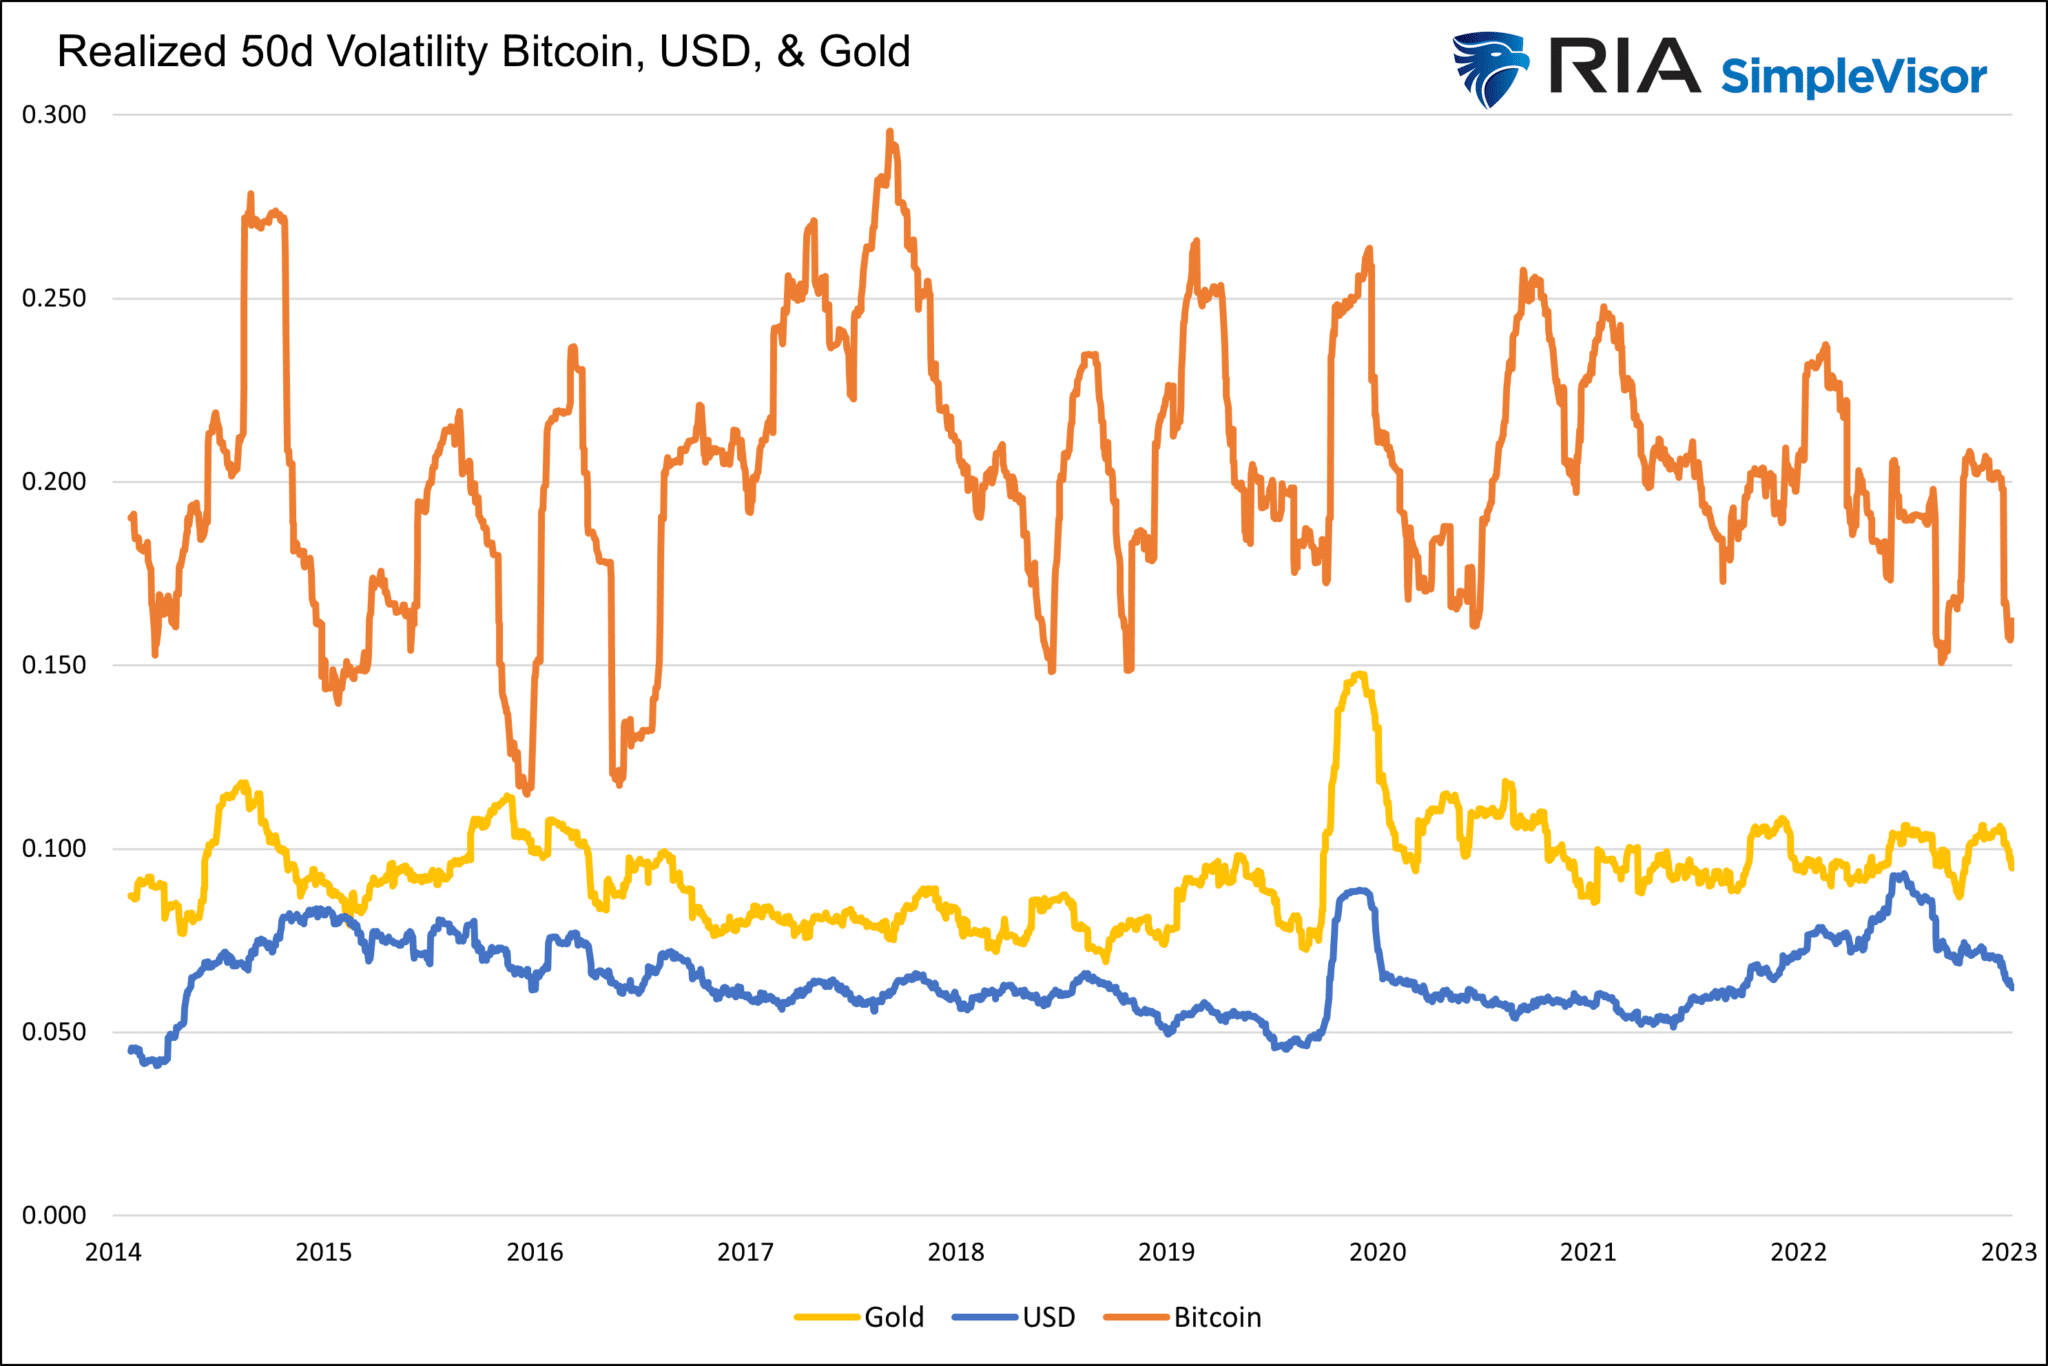
So, is Bitcoin maturing? Might the recent “boring” trading in Bitcoin make it stable enough to rely on it as a currency? The answer to both is a resounding NO! As evidence, the graph below shows the running 50-day annualized volatility of Bitcoin alongside the U.S. dollar index and gold. Since 2014, the average annualized volatility of Bitcoin was 20, which is more than double the volatility of gold and triple that of the dollar. While it is now a little lower at 16, it remains much more volatile than the dollar and gold. It would take a prolonged period of sub-10 volatility to start having a usable currency discussion. Of course, transacting with Bitcoin has other hitches as well.
What To Watch Today
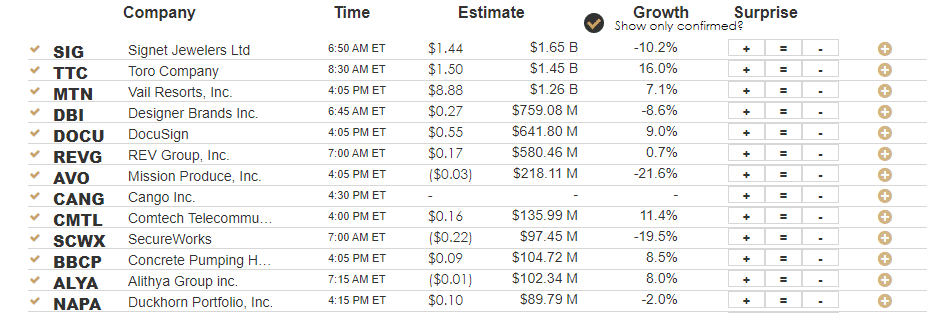
Earnings
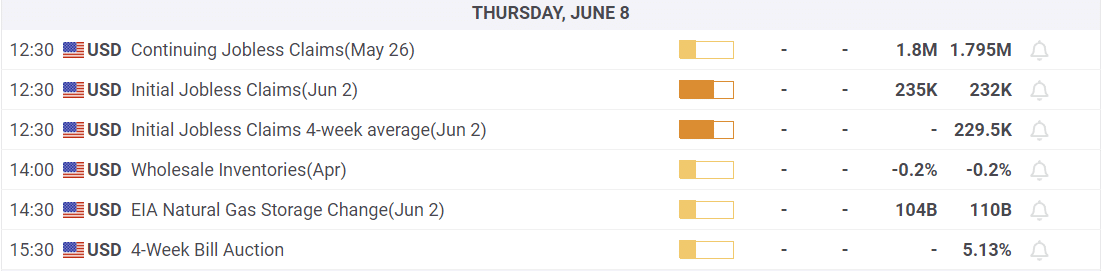
Economy
Market Trading Update
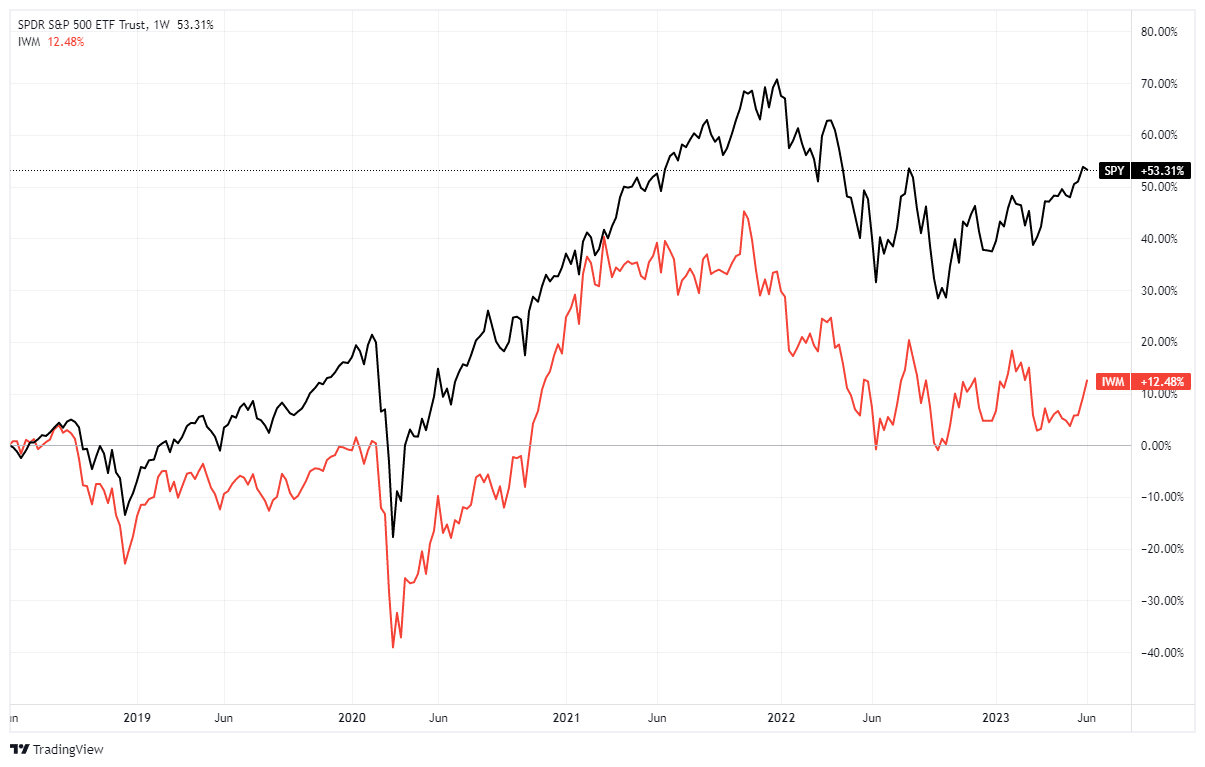
As massive short-positions were forced to cover, small-cap stocks have come roaring back over the last few trading days. The question is whether the recent rally is sustainable or is this another suckers rally, as we have repeatedly seen. Using the Russell 2000 Index ETF (IWM) as a proxy for small and mid-cap stocks, underperformance relative to its large-cap brethren has been significant over the past five years.
Whether or not small caps are about to take the lead in the market is questionable. Small and mid-sized companies do not have the capital to do significant share buybacks like the Megacaps. More importantly. smaller companies are more sensitive to a slowing economic environment and higher interest rates.
So, investors are betting on either a resurgence of economic growth and falling interest rates, OR this rally is a short-term tradeable rotation that will eventually fail.
My bet is on the latter.

We are Much Closer to a Digital Currency Than you Know
“We already have digital currency. It’s called the U.S. dollar,”- Gary Gensler SEC Chair
Like it or not, Gary Gensler is correct. Last week we wrote an article on the pros and cons of CBDCs (central bank digital currencies). We intended to ease many people’s apprehensions over CBDC and the greater control it gives the government over the financial system and its ability to track and possibly mandate money movements. For all the worrying about more government surveillance and reckless fiscal and monetary activities resulting from CBDCs, that day is here, with or without CBDCs. To wit.
CBDC will make it a little easier for the government to infringe on our privacy and freeze our spending. But, with technology and the proliferation of the Internet of Things, such privacy and rights have already been lost with or without CBDC. The surveillance ship has sailed.
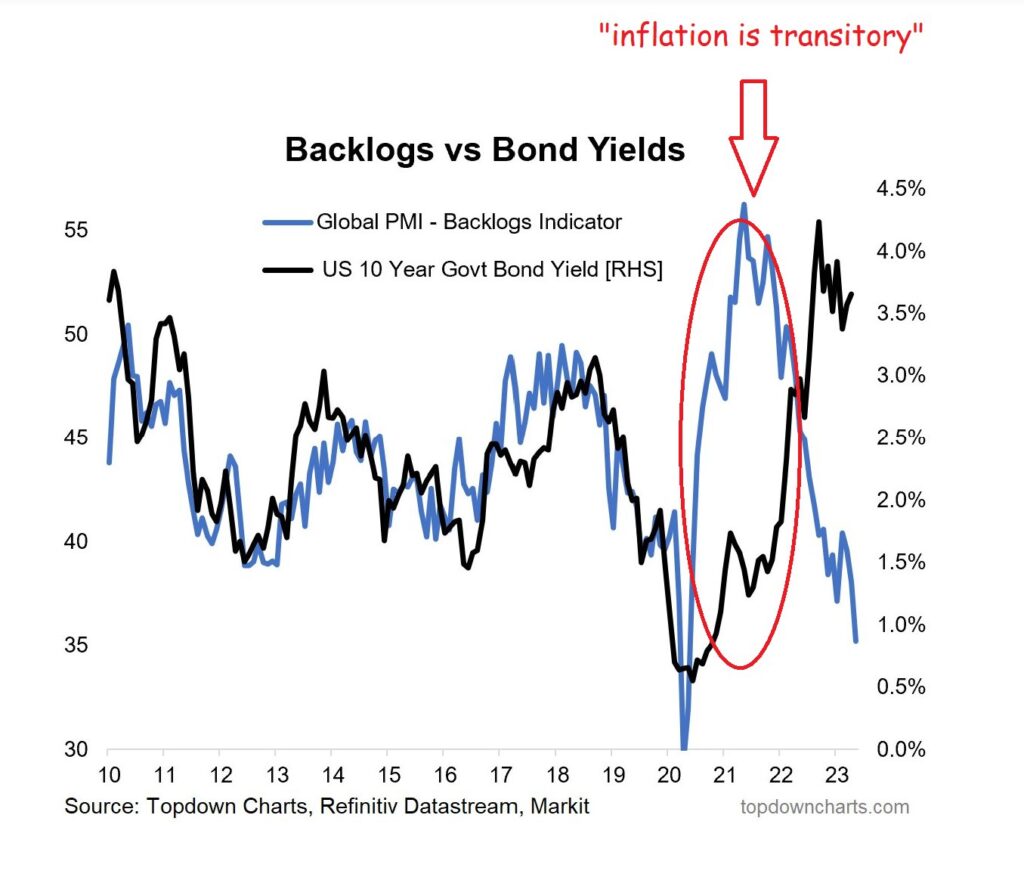
Falling Order Backlogs Signal Much Lower Yields
In yesterday’s Commentary, we noted that the latest ISM services and manufacturing surveys showed another steep decline in the order backlogs subcomponent. As shown below, the indexes are already at recessionary levels and still falling. Order backlogs are a great leading indicator of economic activity and inflation. The second graph below, courtesy of Topdown Charts, shows U.S. Treasury ten-year yields track global order backlogs well. Might we see 1% Treasury yields soon?

TPA Relative Rotation Strategies
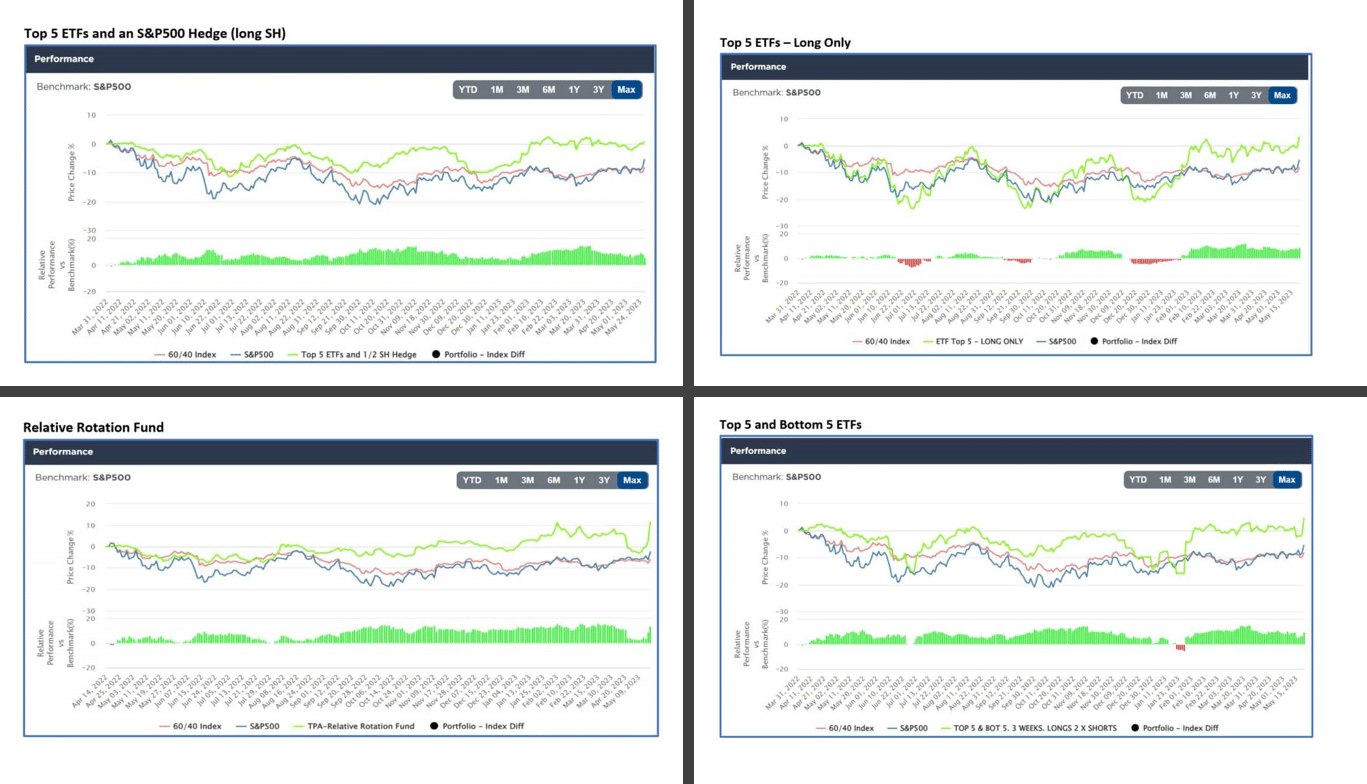
The following Commentary and graphs are courtesy of Jeff Marcus from TPA (Turning Point Analytics). TPA offers SimpleVisor subscribers an add-on service that uses relative rotation strategies. As we share below, the strategies are doing very well in these complex markets.
As the 2023 rally shows some signs of broadening into more than just a few large cap tech and discretionary stocks, TPA’s Relative Rotation Strategies (RSS) have gained momentum. RSS, in our suite of TPA tools within SimpleVisor puts investors in a position to capitalize on stocks and sectors as they move into and out of favor. Although RSS also outperformed in 2022, the four strategies are currently outperforming by anywhere from 6% to 13% so far in 2023 as shown below.
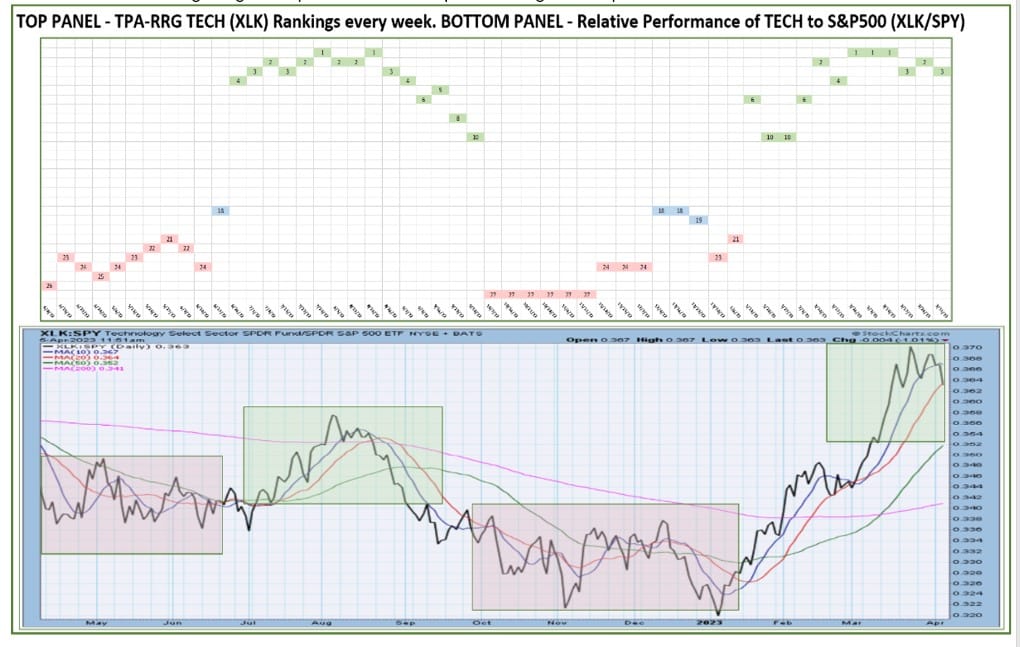
To further illustrate the power of RSS strategies, The image below shows the ranking each week for TECH (XLK) in the top panel and the relative performance chart of XLK (XLK/SPY) in the lower panel. Top ranking in the upper panel coincides with outperformance in the lower panel. In other words, TPA-RRG ranking keeps investors in outperforming sectors.
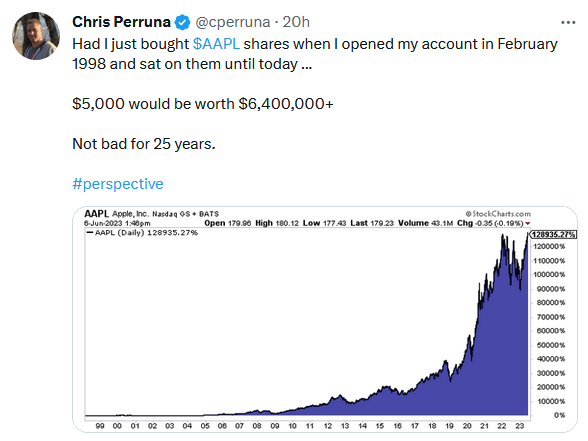
Tweet of the Day
Please subscribe to the daily commentary to receive these updates every morning before the opening bell.
If you found this blog useful, please send it to someone else, share it on social media, or contact us to set up a meeting.

