


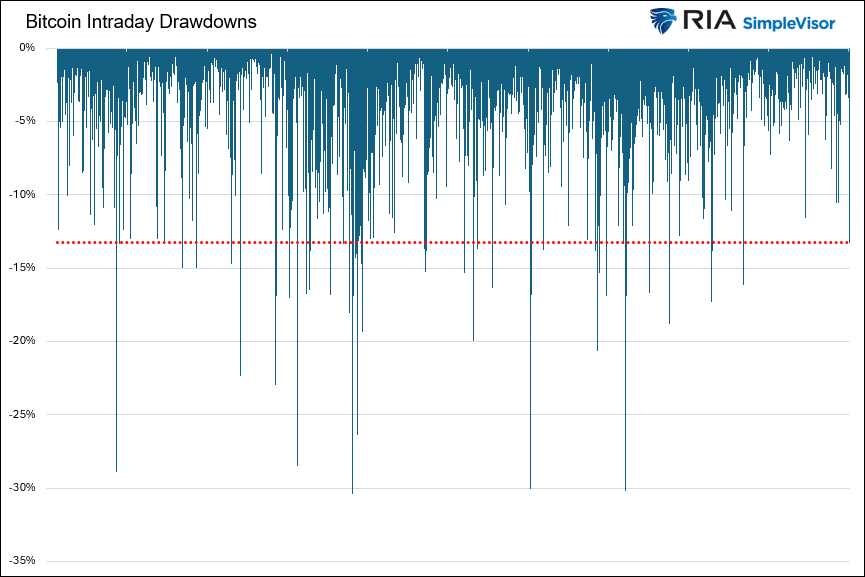
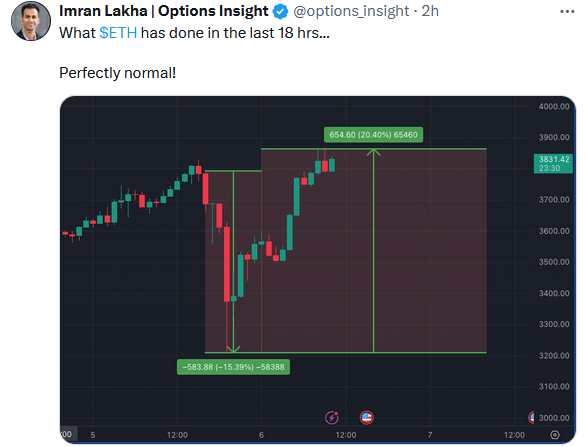
From Monday’s close to its low point on Tuesday, Bitcoin declined by over 13%. While a 13% decline in one day may seem enormous for almost any asset class, it’s not that out of the ordinary for Bitcoin traders and investors. As we graph below, Bitcoin has fallen by 13% or more intraday 59 times over the last ten years. On average, such a drastic move occurs about six times a year. In fact, Bitcoin has declined by twice that amount, on an intraday basis, six times in just the last ten years! As of Wednesday morning, Bitcoin recovered over half of its losses. Furthermore, Ethereum, which was down over 15% intraday, erased the entire decline within 12 hours, as shown in our Tweet of the Day below.
The surge and recent decline in Bitcoin are not just confined to Bitcoin. The whole crypto sector is posting enormous gains. Furthermore, as we have mentioned in numerous Commentary, speculative fervor permeates many markets. Often, bubbles or periods of significant gains end with a bout of two-way volatility. Big gains are followed by sharp declines, another price surge, etc. Typically, such volatility marks a period when the number of sellers or those shorting becomes numerous and more aggressive. Further, buyers and sellers are often heavily convicted at these points. Consequently, sellers will pile on any downward movement, and buyers consider any dip a gift. Hence, we must ask- is this week’s bout of volatility a warning or a speed bump on the way to higher prices?
What To Watch Today
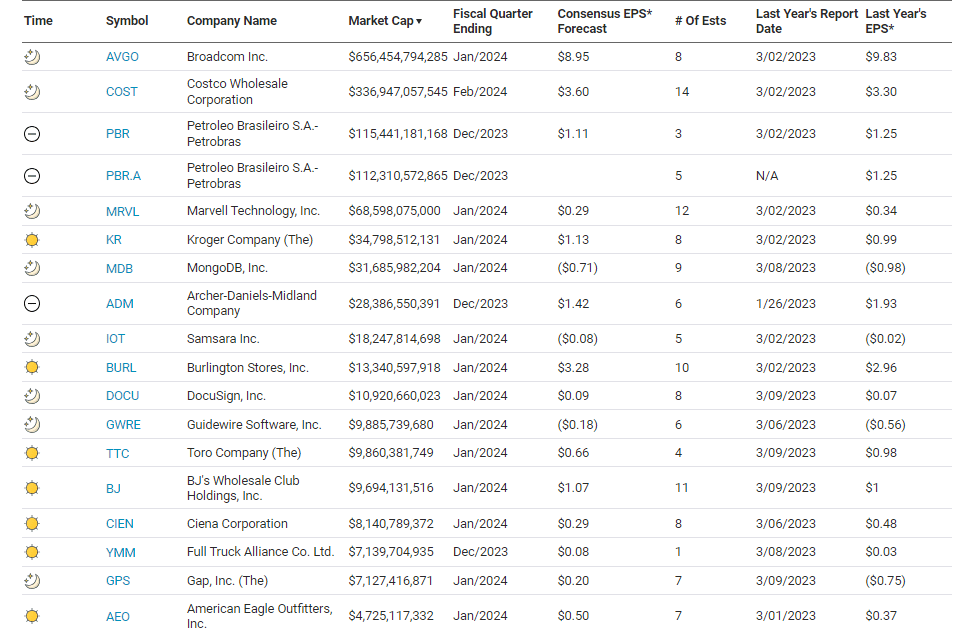
Earnings
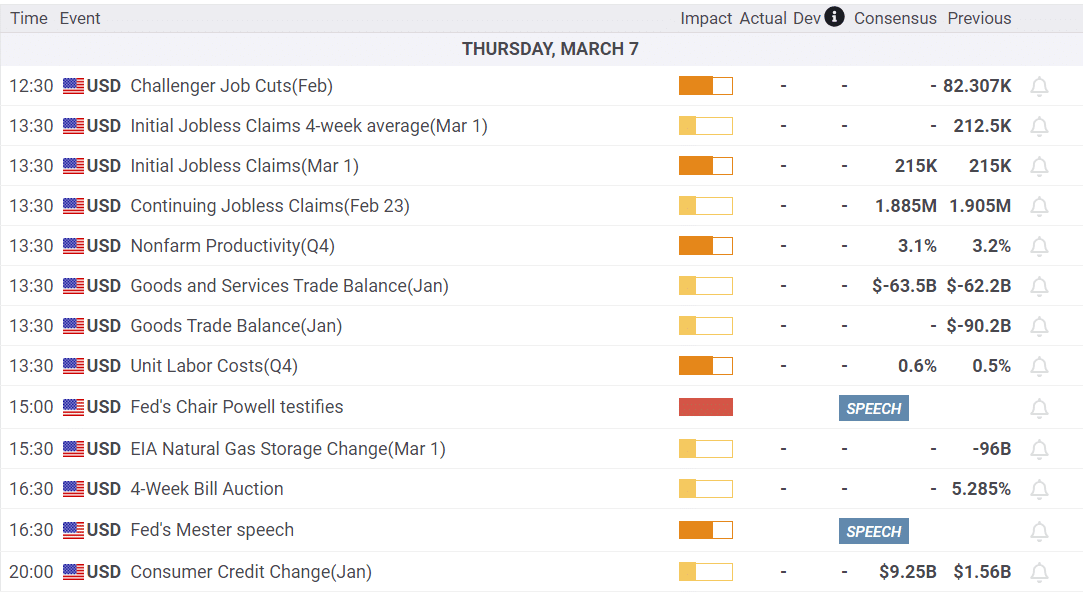
Economy
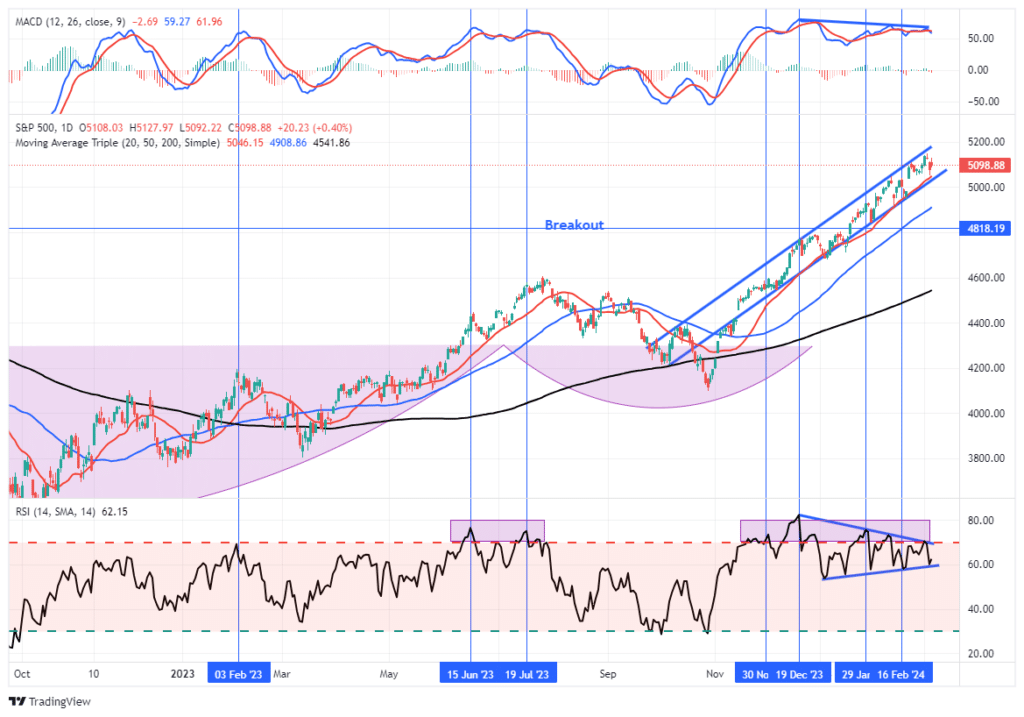
Market Trading Update
Just like clockwork, the market traded lower on Tuesday, testing the 20-DMA for a quick second before rebounding higher into the close. The market followed through on that rally yesterday, with Nvidia again leading the way even as Microsoft, Apple, Google, and Tesla lagged.
The story remains the same. An “unstoppable bull market” that continues to trend higher. The bulls are getting more bullish, and the bears….well….they are hard to find. Sentiment is rising, and investor positioning is getting very long. As we have repeated over the last several weeks, there is no reason to be overly cautious on the markets. However, WHEN the market takes out the 20-DMA, expect a sharp move lower as all the computer algos are now keyed to that level.
Remain long but continue to manage portfolio risk accordingly.

Jerome Powell Testifies To Congress
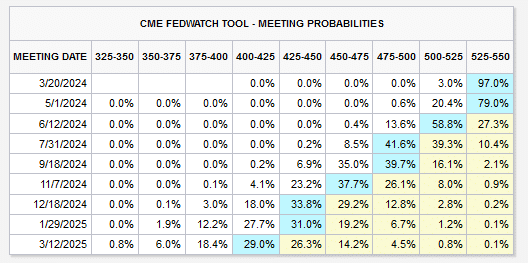
Powell testified to the House in his quarterly monetary policy and economic update yesterday. He did not break much new ground. However, of most importance, he stated that the forward guidance regarding rate cuts has changed little. With the market and Fed rate expectations much more closely aligned, the market is less prone to volatility as market expectations change. For example, the table below shows the Fed Funds futures market now expects the Fed to cut three to four times by year-end. Based on his testimony, he thinks rate cuts are more likely in the second half of the year, as they want “more confidence inflation is moving sustainably to 2%.” The market is pricing a 58% chance that the first cut will occur on June 12.
Powell is aware of the risks the Fed faces as he notes they need to thread the needle with rate cuts. Cutting rates too soon could “result in a reversal of progress” in reducing inflation, or cutting them “too late or too little” could weaken the economy and hiring. He is aiming for a Goldilocks soft landing.
The stock and bond markets’ reaction to his comments was muted, as he pretty much said what most market participants were thinking.
JOLTs And ADP Point To A Moderating Labor Market
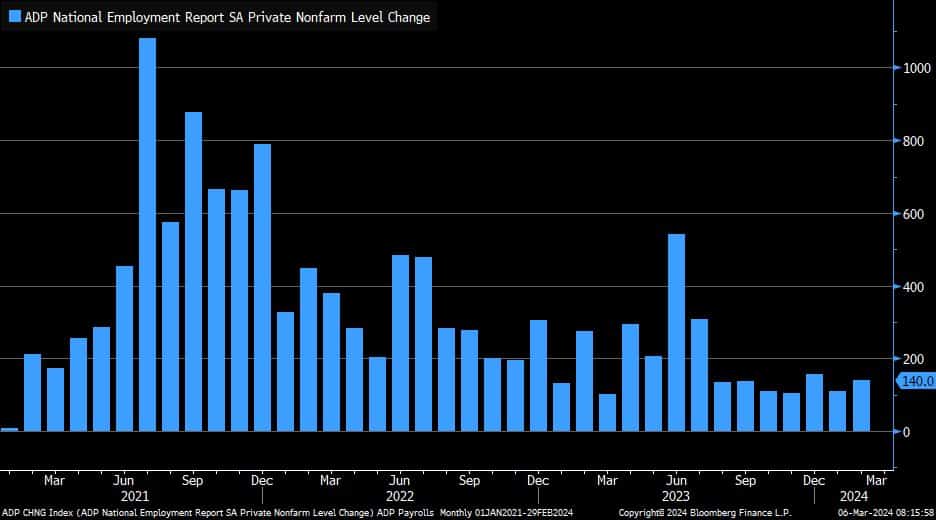
Leading into Friday’s employment report, we can try to gather some clues from yesterday’s ADP and JOLTs reports. ADP was slightly lower than expectations at +140k. Once again, leisure and hospitality added the most jobs. We caution that these tend to be lower-paying jobs and are often temporary.
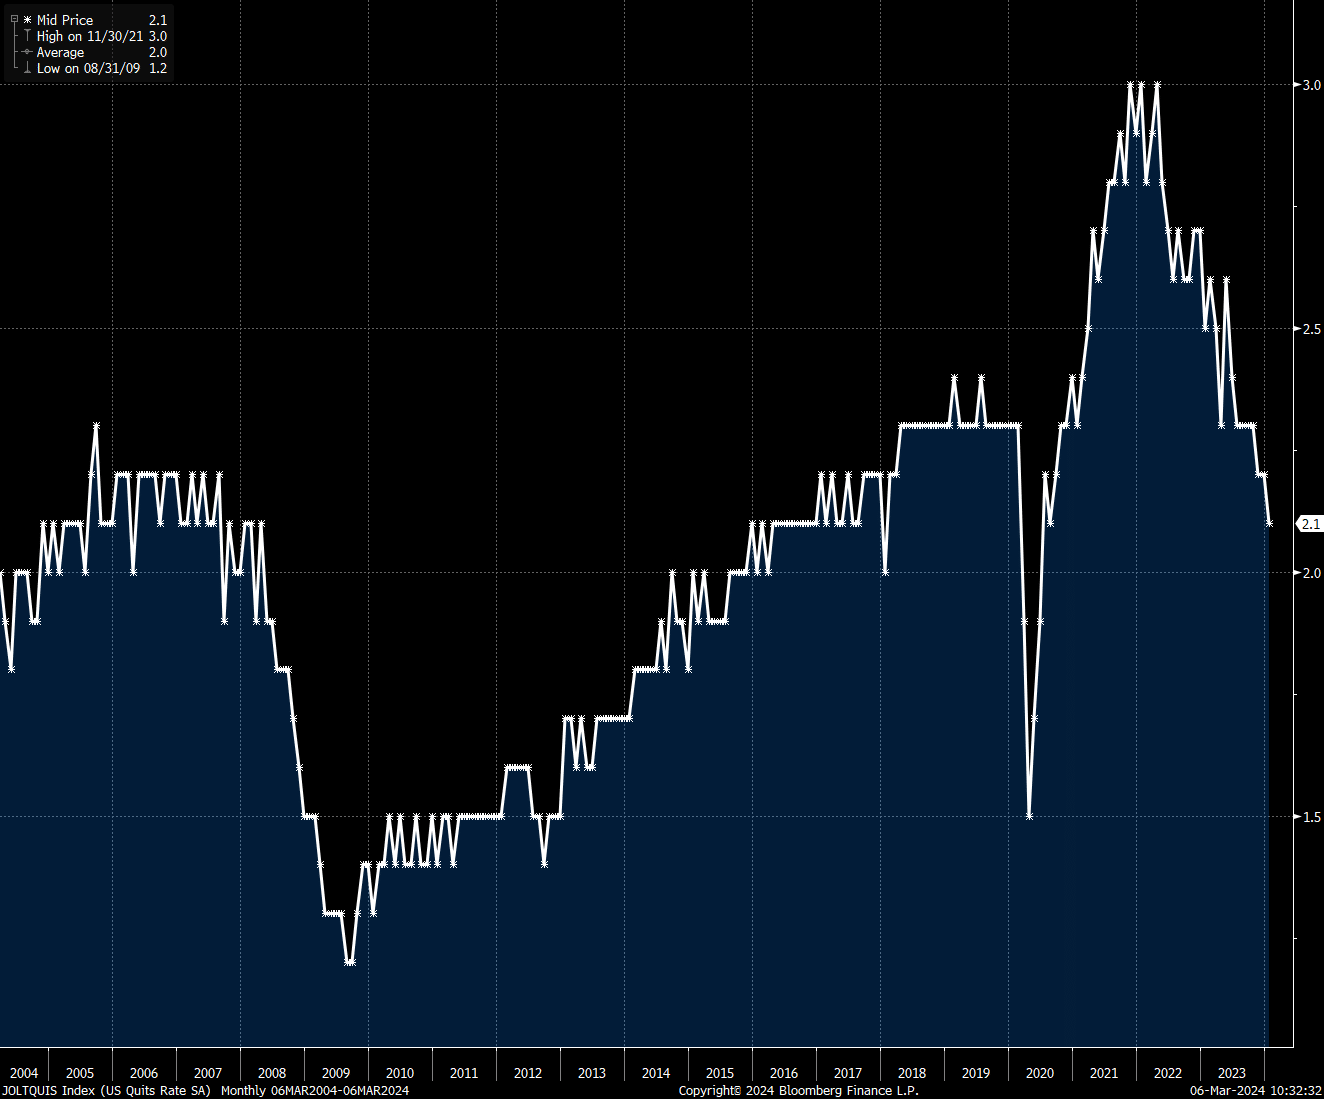
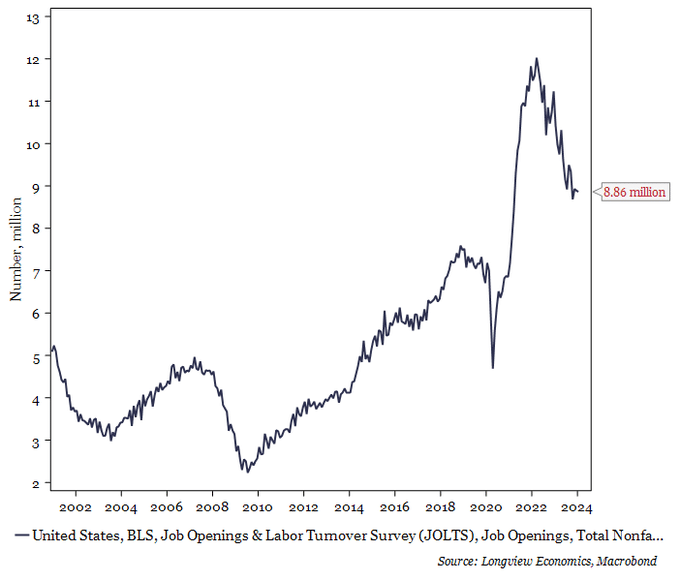
The JOLTs report, like ADP, points to a normalization of the labor market. The quit rate, a good measure of job mobility, is now below pre-pandemic levels. When the odds of finding a new, higher-paying job decline, so does the quit rate. The number of job openings was slightly below the prior level, as it has been for four months running. As shown in the third graph, the trend remains lower, but it still lies decently above pre-pandemic levels.
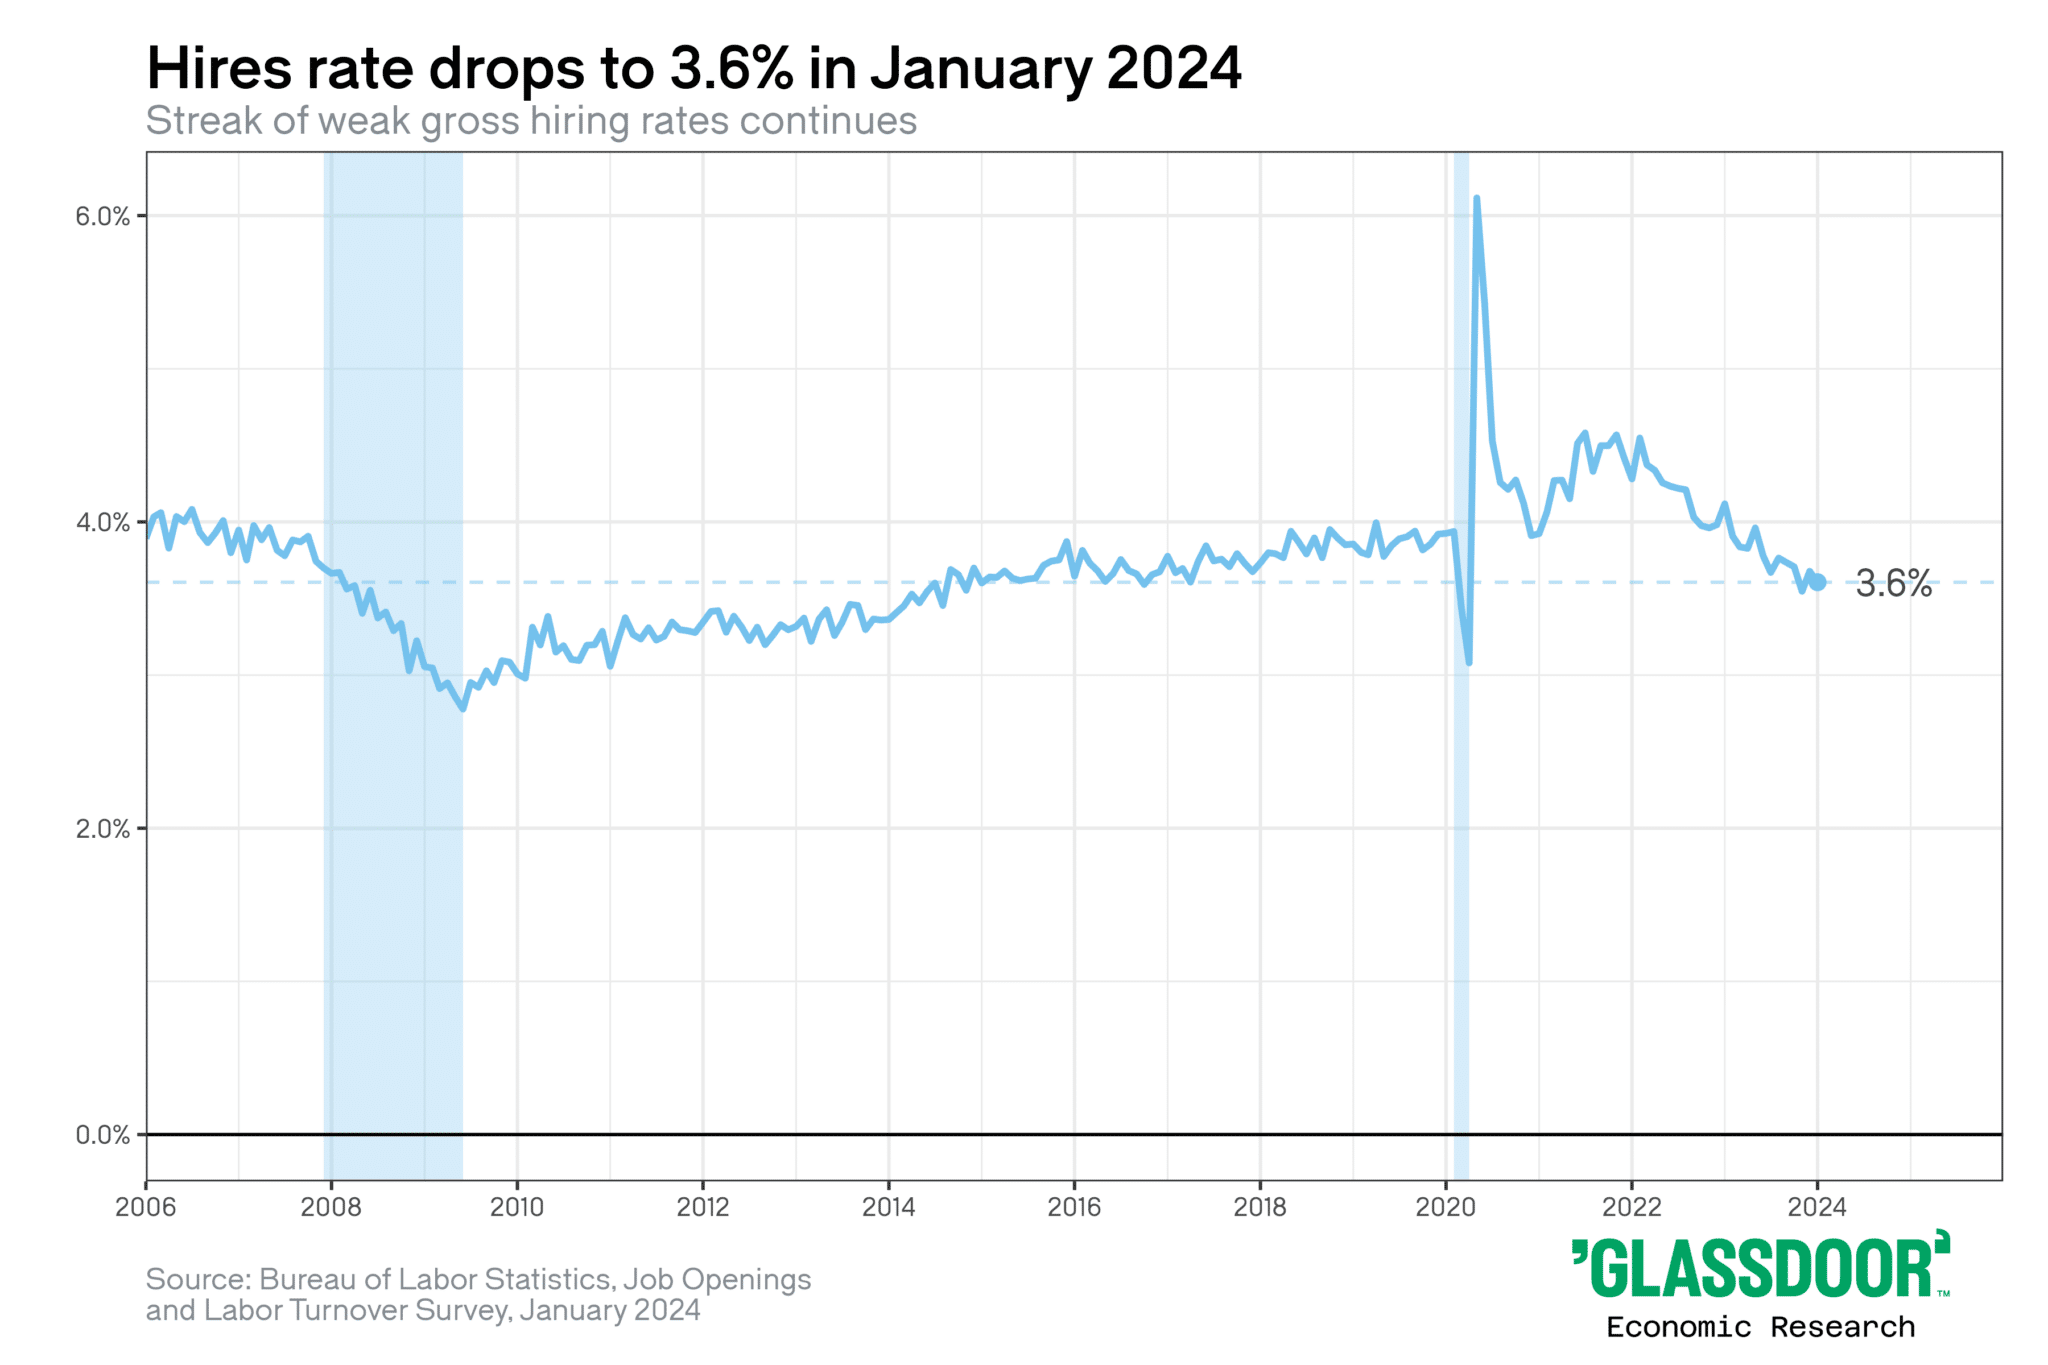
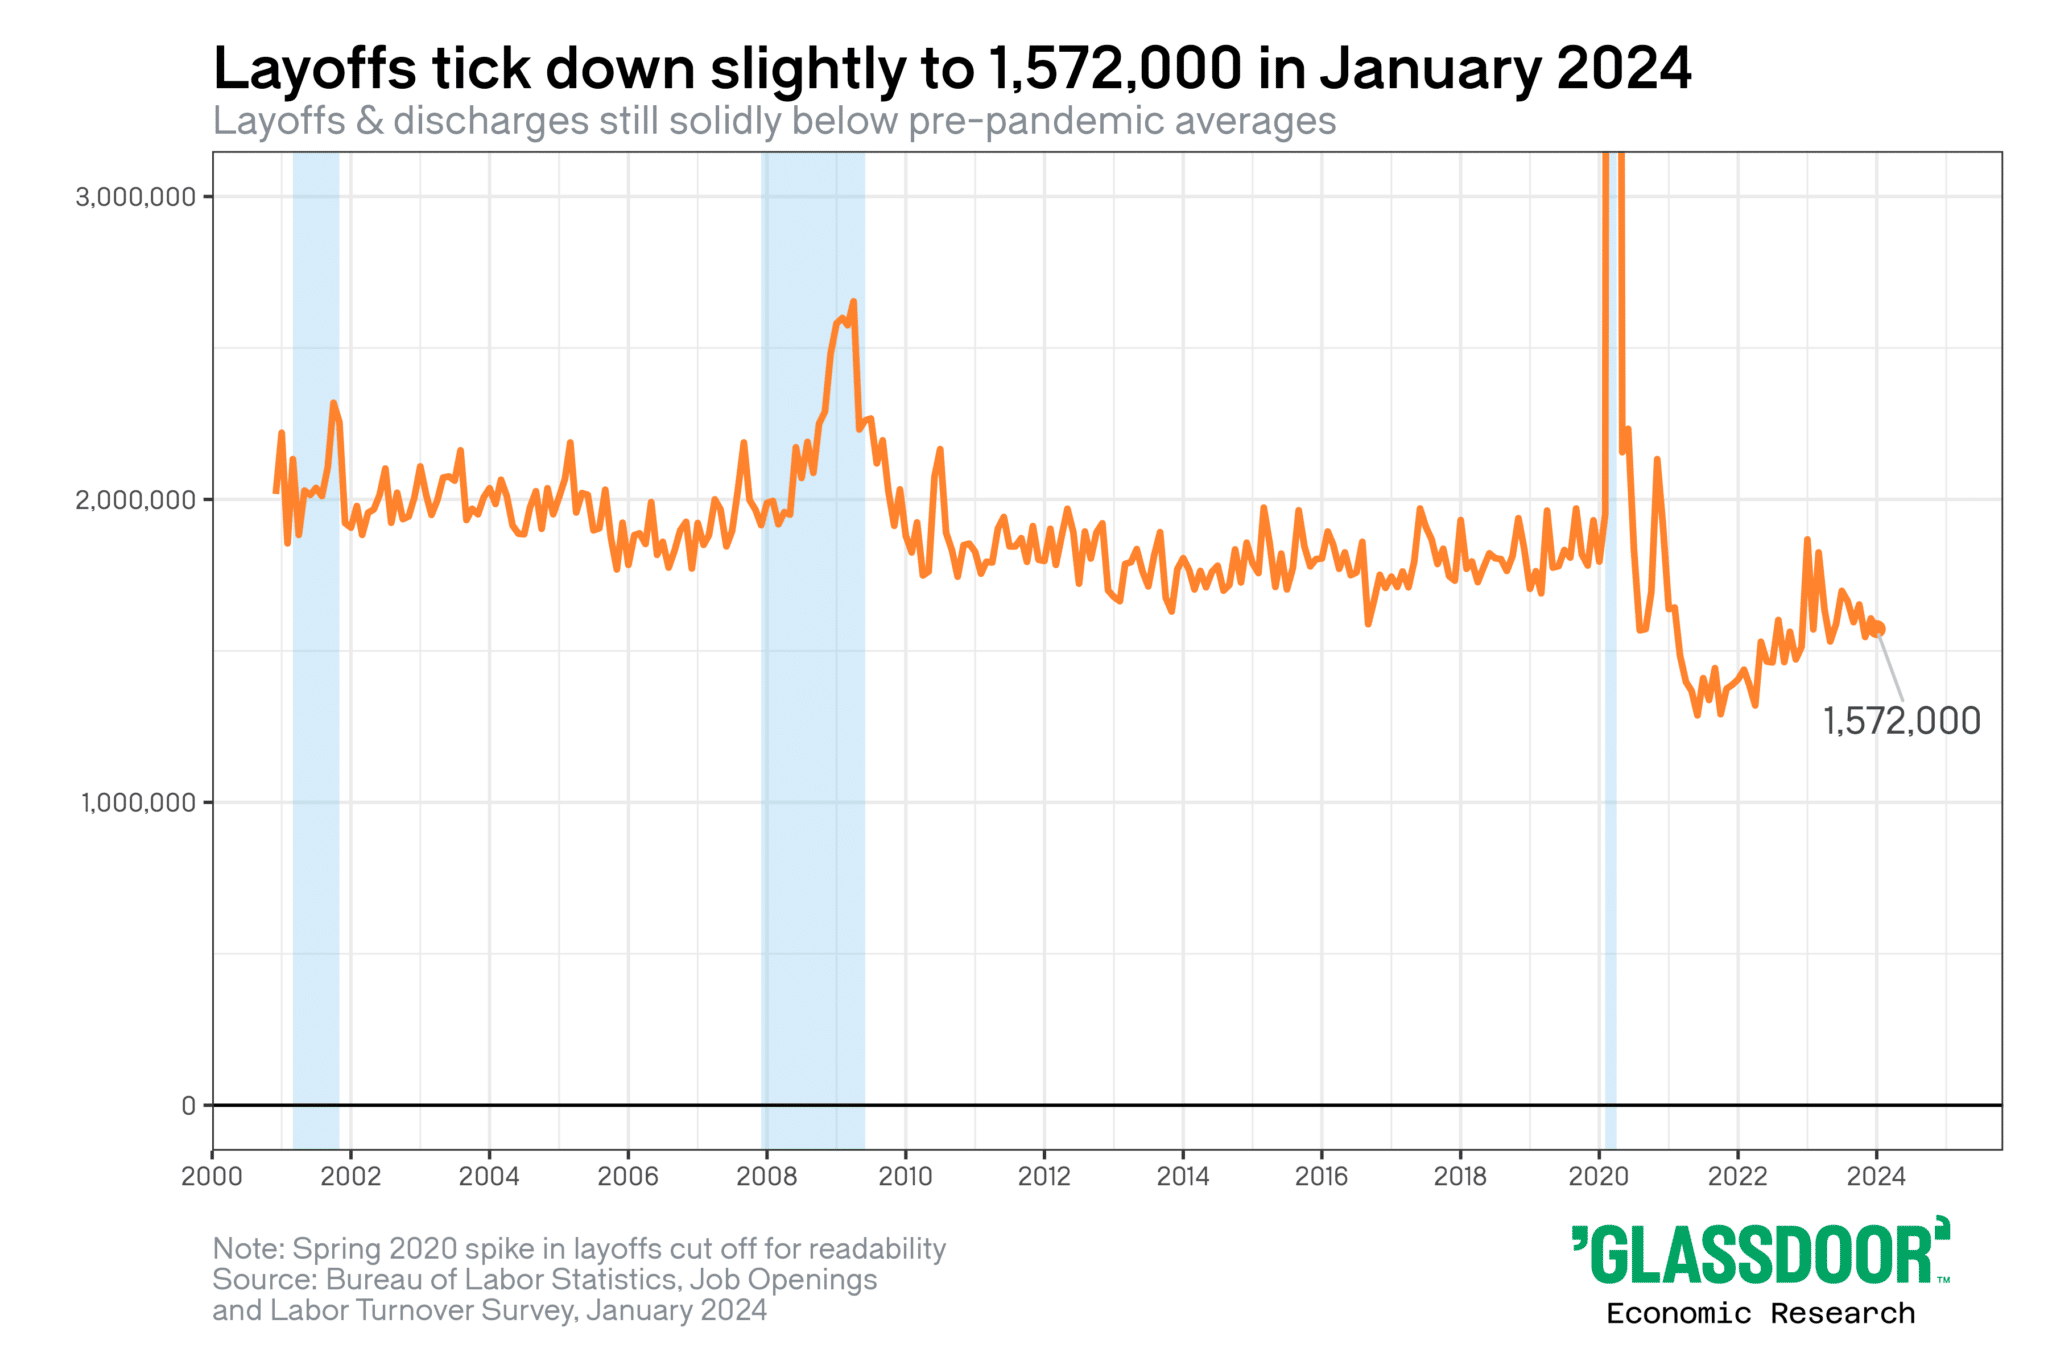
The fourth and fifth graphs provide an excellent summary of the labor markets, in our opinion. The fourth graph shows that the hiring rate is down to 7-year lows, yet layoffs remain well below pre-pandemic levels, as highlighted in the fifth graph. The two data sets, in combination, point to a stagnant labor market in which companies are not laying off employees or hiring new employees.
Tweet of the Day
“Want to have better long-term success in managing your portfolio? Here are our 15-trading rules for managing market risks.”
Please subscribe to the daily commentary to receive these updates every morning before the opening bell.
If you found this blog useful, please send it to someone else, share it on social media, or contact us to set up a meeting.
Also Read


