


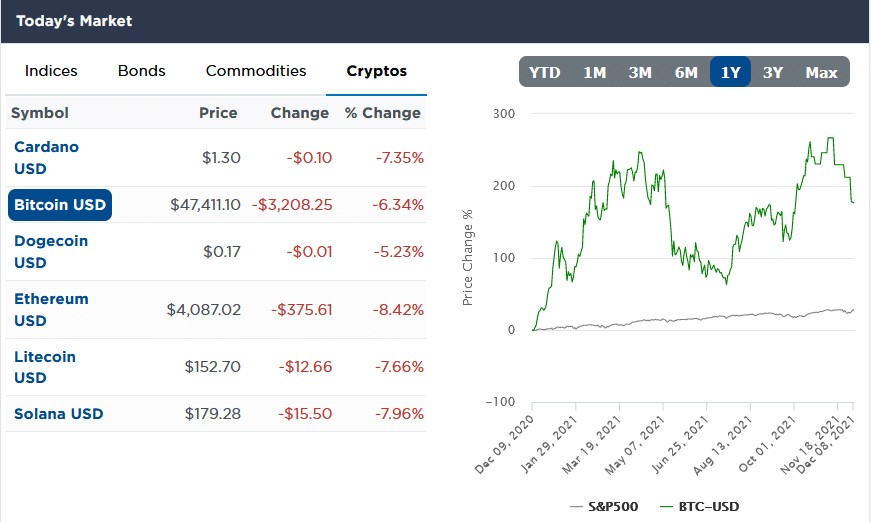
Bitcoin and stocks fell in light trading yesterday. As we show below from SimpleVisor, Bitcoin and other popular Cryptocurrencies had a rough day. While far less volatile, stocks were mostly lower as well. The Russell 2000 led the way, down 1.9%. It was followed by the Nasdaq (-1.7%) and S&P 500 (-.70%). The Dow Jones Industrial Average eked out a small gain. Helping the Dow outperform were WBA, V, WMT, UNH, and MCD, all posting 1%+ gains.

What To Watch Today
Economy
- 8:30 a.m. ET: Consumer Price Index, month-over-month, November (0.7% expected, 0.9% in October)
- 8:30 a.m. ET: CPI excluding food and energy, month-over-month, November (0.5% expected, 0.6% in October)
- 8:30 a.m. ET: CPI year-over-year, November (6.8% expected, 6.2% in October)
- 8:30 a.m. ET: CPI excluding food and energy, year-over-year, November (4.9% expected, 4.6% in October)
- 8:30 a.m. ET: Real Average Weekly Earnings, year-over-year, November (-1.6% in October)
- 10:00 a.m. ET: University of Michigan sentiment, December preliminary (68.0 expected, 67.4 in November)
- 2:00 p.m. ET: Monthly budget statement, November (-$193.0 billion expected, -$145.1 billion in October)
Earnings
- No notable reports schedule for release
Market Update
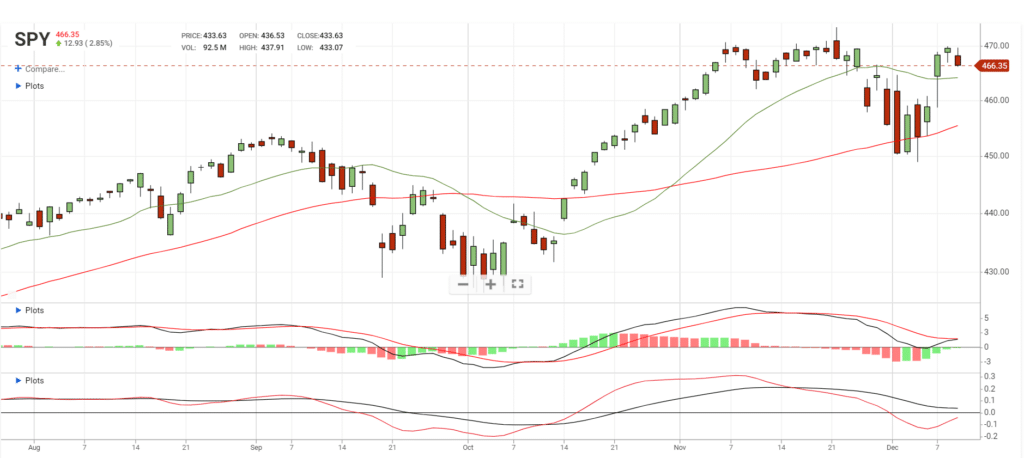
After a bit of a sell-off yesterday from previous resistance levels, the market is looking to rally this morning. The action is not surprising, as we suggested we could see a bit of selloff and consolidation after the recent bounce. The market is still holding above the 20-dma and previous highs and it would not be surprising to see some additional sloppy trading next week as mutual funds finish their annual distributions. That selling pressure is most complete by now.
We are looking to add additional exposure to our portfolio models heading into the 15th of the month. However, that overweight equity positioning will get reduced once we get through the first week of the new year.
Is Bitcoin The Tail Wagging the Dog?
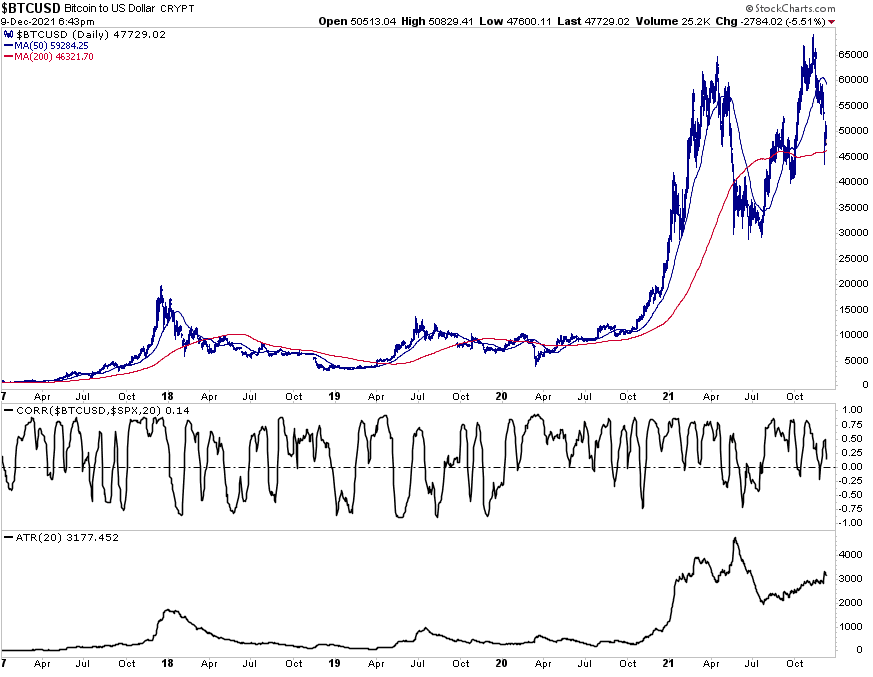
Bitcoin fell 5% yesterday. While it’s tempting for stock investors to claim 5% is a big change, it’s not for Bitcoin. The graph below shows its incredible volatility this year. In particular, the Average True Range (ATR) in the bottom graph highlights that Bitcoin is trading in a $3000 average daily range. You may be asking- “If I only follow stocks why do I care what Bitcoin does?“ The middle graph helps answer the question. It shows the 20-day running correlation between Bitcoin and stocks (S&P 500) has largely been positive since 2020. Prior to then, the correlation was inconsistent. Given the propensity for Bitcoin and the S&P 500 to move together, a “risk-off” event in Bitcoin could spill over to the equity markets. Conversely, a strong bid for Bitcoin may result in sharply higher stock prices. Regardless of whether you trade Bitcoin or not, it bears watching.
Tweet Of The Day
We noted previously that over the last 6-months, the FANG stocks have comprised 70% of the markets rally. However, this tweet from Michael Arouet makes it very clear.
Musk Dumps More Tesla Stock
Elon Musk is continuing to offload his stock. why his legions of faithful followers continue to hold onto their shares.
The tech billionaire sold 934,091 Tesla shares, according to financial filings with the Securities and Exchange Commission published late Thursday. The shares are worth $963.2 million.
Last month, Musk sold a total of $9.85 billion in Tesla stock including the $6.9 billion he sold the week of Nov. 10 and another $1.9 billion he sold on Nov. 15 and Nov. 16. Some of the shares were sold in part to satisfy tax obligations related to an exercise of stock options.
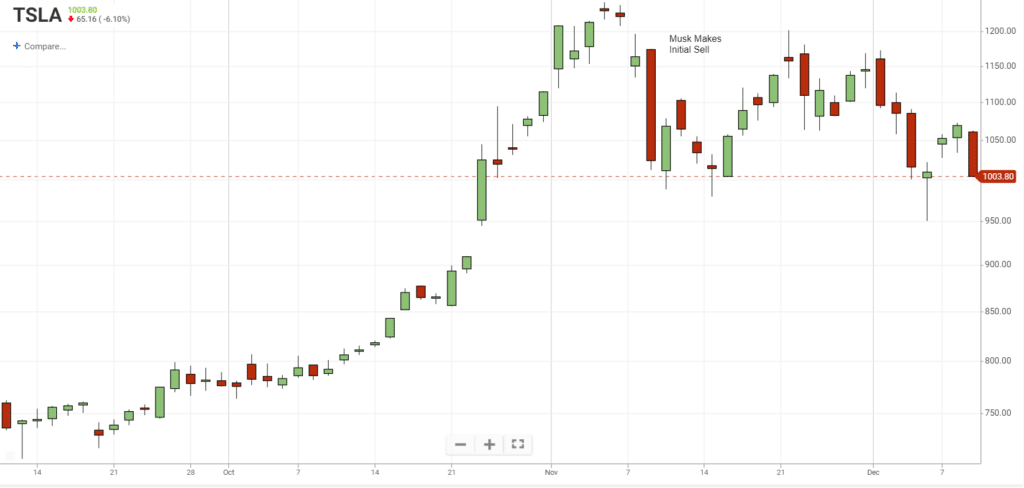
Of course, If I was him, I would be selling stock also, and a lot more of it most likely. After all, at the end of the day, Tesla is an automaker and will be subject to the ebbs of flows of the industry just as they all are.
Jobless Claims at 50-year Lows
Initial Jobless Claims fell to 184k this past week, hitting its lowest level since 1969. In 1969, the U.S. population was 203 million. Today it’s 332 million. If you adjust for the population increase, jobless claims are well beyond the prior record low of the late 60s.
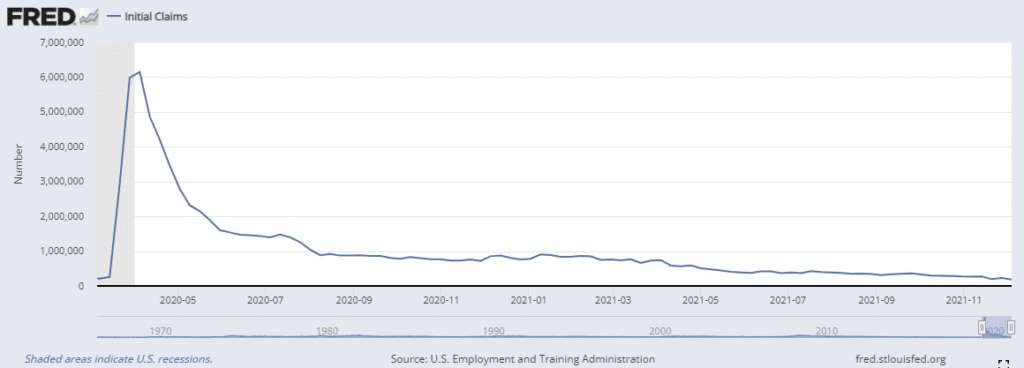
Between last Friday’s employment report, JOLTs data, and initial claims, the Fed will likely continue to shift toward inflation-biased policy. Such logic entails the Fed will be more aggressive in reducing QE. Record valuations and the high-risk tolerance among many investors are largely supported by the Fed’s liquidity. While markets may ignore the circumstances for a while, we mustn’t forget monetary policy is changing. We think the change will be an essential theme driving investment results in 2022. Stay tuned!
How Big Is Apple?
Apple’s stock is up over 10% in the last five trading days. In the last month, its market cap increased $400 billion and is now approaching $3 trillion. To put that in context consider the $400 billion gain in market cap over just the last month is more than the total market cap of the world’s 20th largest company, Walmart ($380 billion). The two bar charts below compare Apple versus the total size of the top ten nations ranked by their respective aggregate stock market capitalization and nominal GDP. As shown, Apple is bigger than all but six nations in terms of stock market size and is bigger than the GDP of all but seven countries.

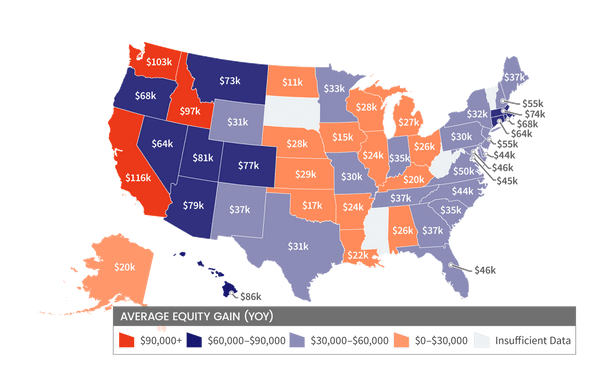
Home Equity
The graph below from Home Equity Insights, by Core Logic, sheds more light on recent home equity gains, which directly boosts the amount of credit available to consumers via mortgage refinancing. Core Logic estimates homeowners with mortgages saw their equity increase by $2.9 trillion over the past year, an increase of nearly 30%. The map below breaks down the average equity gains by state. The amount of credit card debt has recently picked up back to normal levels. Further, savings rates have fallen to pre-Covid levels. While both data points argue that consumers do not have much money beyond their paychecks to spend, the sharp increase in home equity is a potential source to fund new spending. Assuming house prices stay stable or increase, we should expect consumers to tap equity to finance consumption and lessen the burden of inflation.
Please subscribe to the daily commentary to receive these updates every morning before the opening bell.
Also Read


