


Below, we share a summary of an article we published Wednesday. It discusses how the ten-year return outlook for bonds is higher than stocks. In the same vein, the graph below looks back at the performance of ARKK, one of the most popular ETFs, versus AGG, a boring bond fund. The ARKK ETF, managed by Cathie Wood, invests in innovative high-tech growth companies, while the AGG ETF invests in bonds of stable investment-grade companies. Since 2019 the total return on AGG has been a boring straight line, while ARKK has been anything but boring. From March 2020 to its peak in early 2021, ARKK quintupled. Since then, 100% of the gains have vanished. While it is undoubtedly more fun to bet on hares like ARKK, tortoises like AGG may be the best bet.


What To Watch Today
Economy
- 8:30 a.m. ET: Consumer Price Index, month-over-month, September (0.2% expected, 0.1% prior)
- 8:30 a.m. ET: CPI excluding food and energy, month-over-month, September (0.5% expected, 0.6% prior)
- 8:30 a.m. ET: Consumer Price Index, year-over-year, September (8.1% expected, 8.3% prior)
- 8:30 a.m. ET: CPI excluding food and energy, year-over-year, September (6.5% expected, 6.3% prior)
- 8:30 a.m. ET: CPI Index NSA, September (296.417 expected, 296.171 prior)
- 8:30 a.m. ET: CPI Core Index SA, September (296.950 prior)
- 8:30 a.m. ET: Initial jobless claims, week ended Oct. 8 (225,000 expected, 219,000 prior)
- 8:30 a.m. ET: Continuing claims, week ended Oct.1 (1.361 prior)
- 8:30 a.m. ET: Real Average Weekly Earnings, year-over-year, September (-3.4% prior)
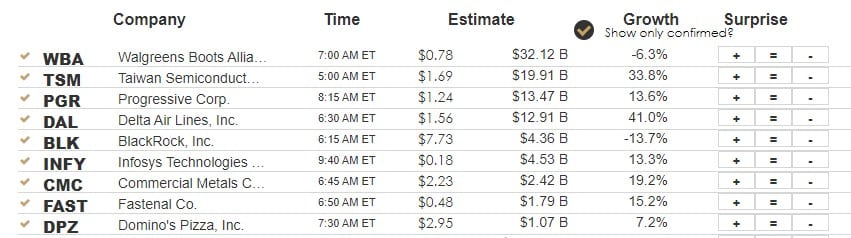
Earnings
Market Trading Update
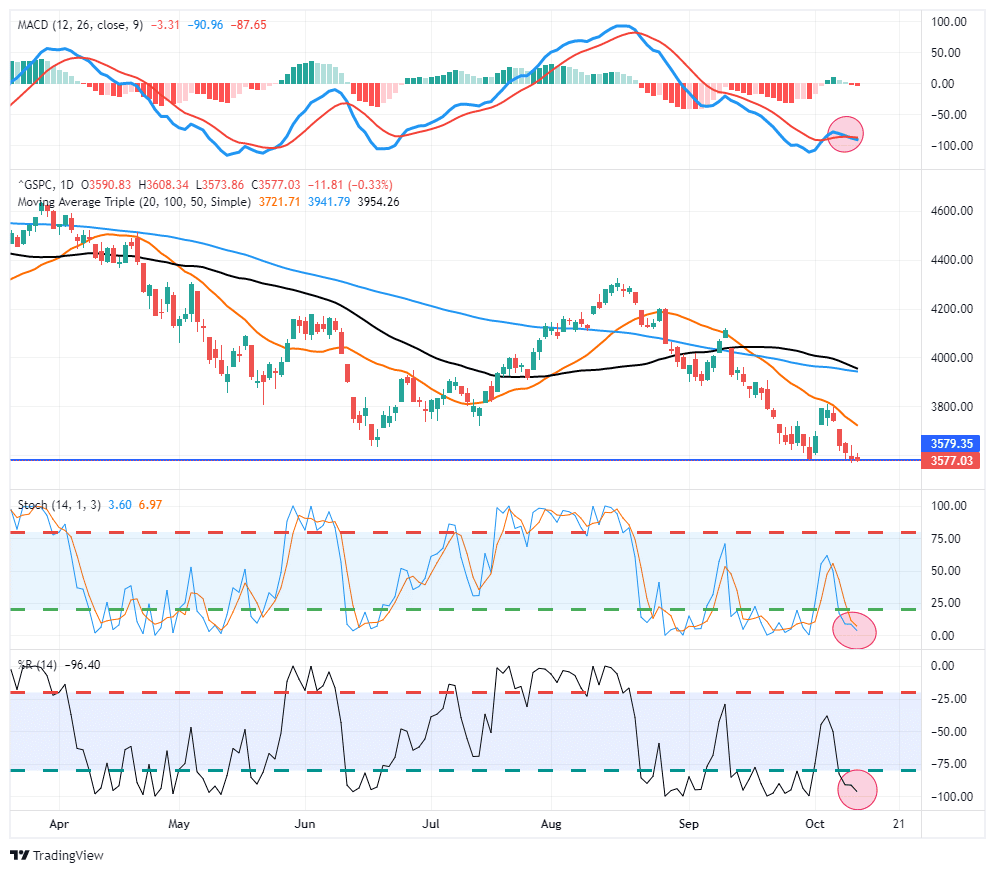
After yesterday’s somewhat mild PPI report, all eyes, and itchy trigger fingers, are focused on CPI. Will inflation show signs of softening or remain persistent? Whatever the number, stocks will likely react violently in one direction or another trying to price in a Fed “pivot” or another rate hike. From a technical perspective, markets remain oversold after trading lower in 13 of the past 16 trading days. Furthermore, we are currently at peak “blackout” for stock buybacks which should add roughly $5 billion a day in buying through year-end once that period lifts on October 28th. Until then, downside risk remains. Traders are positioned very negatively, and investor sentiment is extremely bearish. Any positive news will likely lead to a sharp thrust higher, creating a sellable opportunity to rebalance portfolio risk going into next year.
Hello BAAA
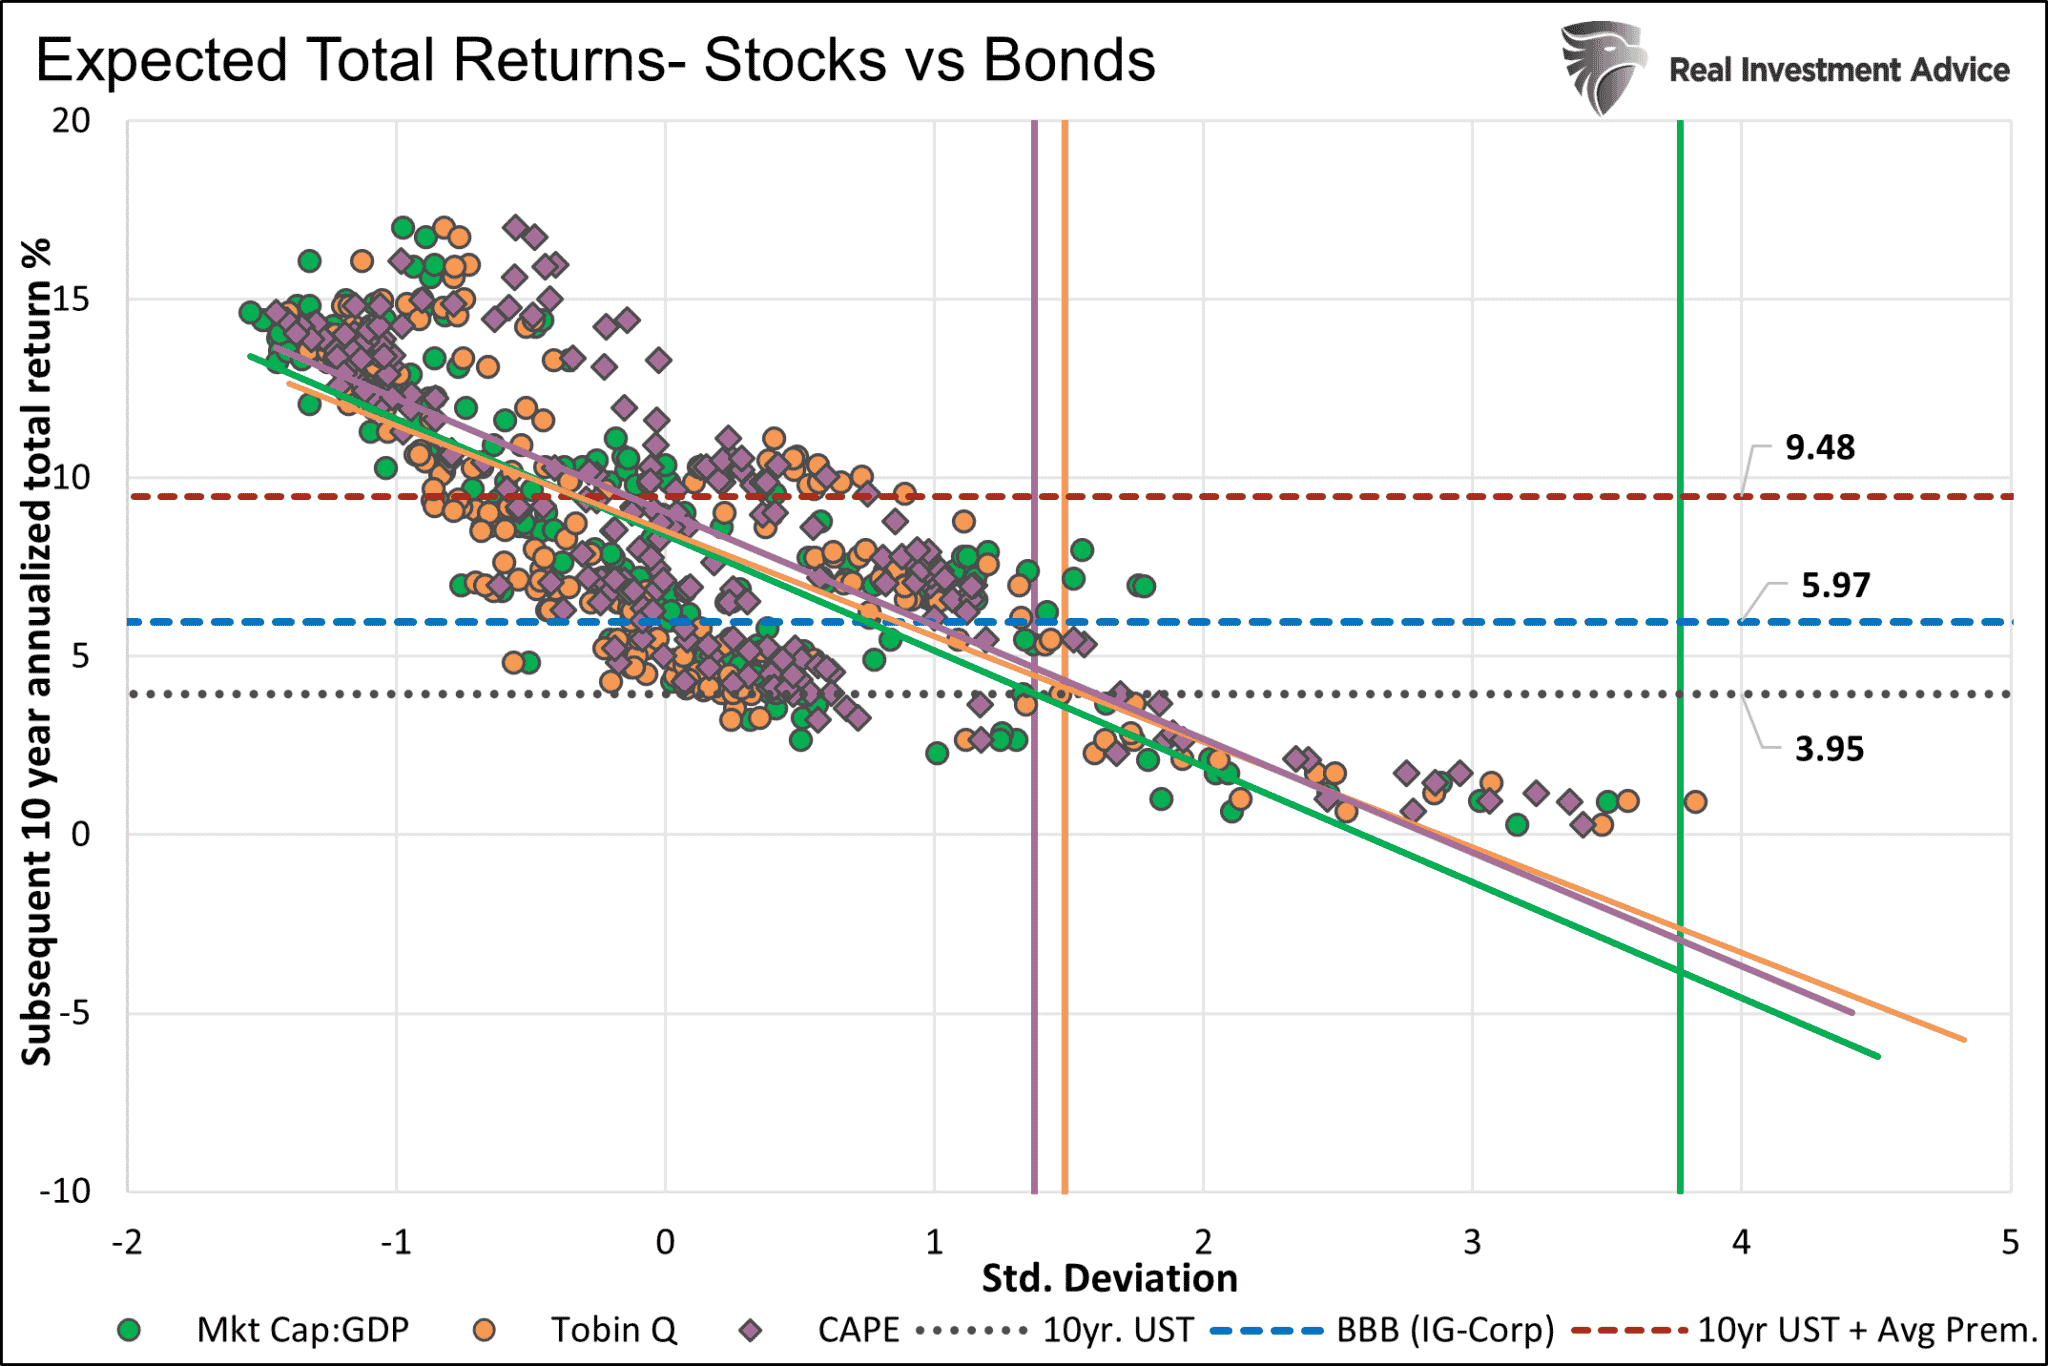
On Wednesday, we published Goodbye TINA – Hello BAAA. Like our comparison of ARKK and AGG in the opening paragraph, our article looks at the return prospects for stocks and bonds for the next ten years. Higher bond yields and still relatively high equity valuations are causing expected returns to favor bond investors. Per the article:
As we share below, an investor can buy a ten-year U.S. Treasury note at 3.95%, which is better than the average of the three expected stock returns. Further, an investor can take some credit risk and earn nearly 6% on investment-grade corporate bonds. Doing so would easily beat expectations for stock returns.
PPI Inflation News is Mixed
Producer Price Inflation (PPI) data was mixed. The monthly figure was +0.4%, 0.2% above expectations. Year over year was 8.5% versus expectations for 8.4%. While the headline numbers were slightly higher than forecasted, the core PPI year-over-year fell from 8.1 to 7.2%. PPI measures prices at the production level. Therefore, they tend to lead CPI. Within PPI are various measures based on where the prices of goods reside within the production process. The graph below compares the much more volatile intermediate-stage prices to the final PPI. As shown, intermediate prices have fallen sharply from 2021 highs, while PPI is just starting to decline. This should provide optimism as intermediate goods prices lead PPI, and PPI often leads CPI.

Just Two Words
Recently, President Biden visited a Volvo plant in Hagerstown, Maryland, to speak about the September employment report. His speech started with the TWO most important words for America:
“Let me start off with two words: Made in America. (Applause.) Made in America. And that’s not hyperbole. I’m not joking about that, as you know.”
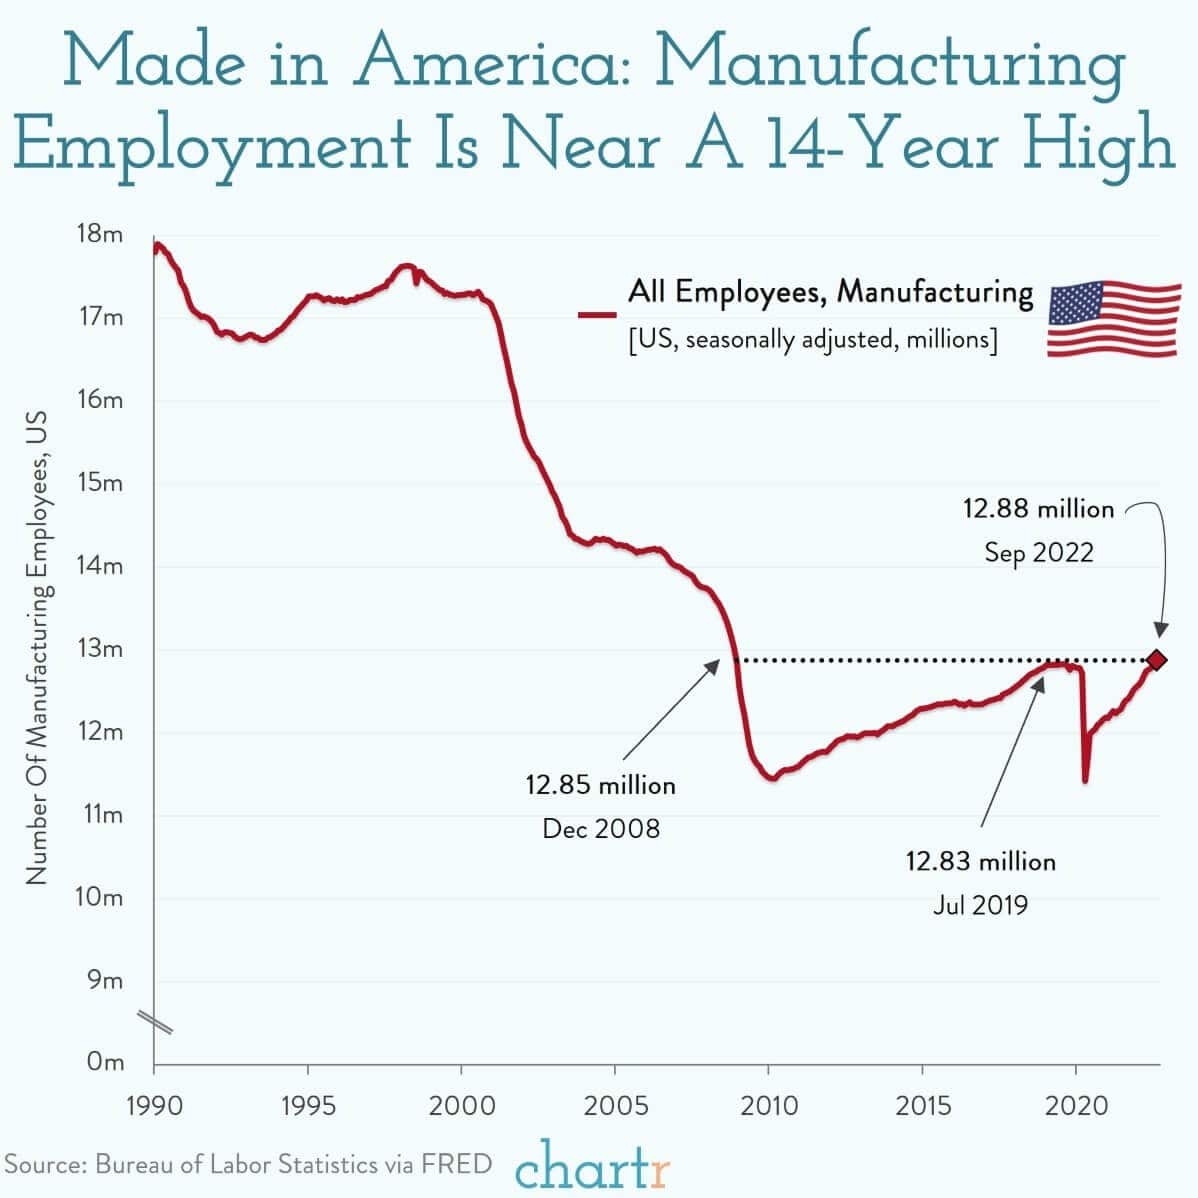
While the gaffe went viral on social media, it does bring home an important point about manufacturing in America. Manufacturing is critical to stronger economic growth as those jobs have a much higher “multiplier effect” on the economy versus service jobs. As noted by Chartr, we have lost an incredibly strong foothold in manufacturing over the last few decades.
“Last week’s job report was good for fans of all things “made in America”. September showed that the US now has the largest manufacturing workforce since the Global Financial Crisis of 2008, with 12.88m workers employed in the manufacturing industry.
Readers with relatives who are prone to nostalgia won’t be surprised by the fact that, even with this modest resurgence, the modern manufacturing industry is unrecognizable compared to the 20th-century equivalent. Today less than 10% of private sector jobs are in manufacturing, compared to more than 40% after WWII. With automation coming for almost every industry (except making charts, fingers crossed), we’re unlikely to get back to “the way things were” any time soon.”
More on Dispersion
In Monday’s Commentary, we wrote about the high correlation between excess returns and our proprietary technical scores. As we wrote:
We show that the R2 statistical correlation is extremely high at .92. We have learned that markets tend to change trends when the correlation is extremely strong or weak.
The graph below from Susquehanna further supports our observation. It shows that the realized correlation of stock prices is at the highest since June. In June, the market rallied from 3600 to 4300 over two months. Before that instance, one must look at the market bottom of 2020 for an even higher correlation.

Tweet of the Day

Please subscribe to the daily commentary to receive these updates every morning before the opening bell.
If you found this blog useful, please send it to someone else, share it on social media, or contact us to set up a meeting.
Also Read


