
Sometimes, a narrative dominates the financial/social media and promotes a mania among investors. Today, the Magnificent Seven is a great example. Seven stocks, including Apple, Microsoft, Google, Tesla, Nvidia, Amazon, and Meta, are media darlings that many investors favor. Fifty-plus years ago, the Nifty Fifty were the stocks to own. They held a similar place as the Magnificent Seven in investors’ minds.
None of the Magnificent Seven companies existed in the heyday of the Nifty Fifty, but a unique valuation and narrative thread aligns the companies.
The experience of the Nifty Fifty “bubble” and its longer-term resolution sheds light on high valuations, earnings growth, and future returns. For the most part, the high valuations of the Nifty Fifty were appropriate. Will we be able to say the same for the Magnificent Seven?

The Nifty Fifty
The Nifty Fifty was the nickname for a group of highly sought-after growth stocks during the late 1960s and early 1970s. Many of these companies were household names characterized by solid earnings growth, innovative business models, and apparent invincibility. Some prominent Nifty Fifty stocks included Coca-Cola, Kodak, McDonald’s, Philip Morris, and Walt Disney.
At the time there was great optimism regarding the global post-World War 2 global economic expansion and the promise of American capitalism. Investors were enamored by the growth potential of large dominant companies and willing to pay hefty valuation premiums for their stocks. Some claim that traditional valuation metrics were ignored during the Nifty Fifty run. Instead, investors cared more about potential growth.
Investors argued that the fifty companies were so exceptional that growth trajectories could continue indefinitely, thus justifying their high valuations. As we often see, valuations detach from reality, and extreme bullish sentiment leads to speculative bubbles.
The Nifty Fifty fell out of favor during the market downturn in 1973. With economic weakness and increasing inflation and interest rates, investors began reassessing their growth outlooks and questioned expensive valuations. Many of the once-esteemed Nifty Fifty stocks suffered substantial losses.
The graph below, courtesy of YCharts and the Palm Beach Daily, shows the 40+% decline in the Nifty Fifty from 1973 to late 1974.

The Nifty Fifty Is Not the Bubble People Thought It Was
In aggregate, valuations for the Nifty Fifty stocks were twice that of the broader market. While the stocks fell sharply and valuations corrected, many Nifty Fifty stocks were not in a bubble as was presumed. It turns out the growth outlooks implied by the valuations were close to the mark.
The following commentary and graphics are from Valuing Growth Stocks: Revisiting The Nifty Fifty by Jeremy Siegel. He leads the article with the following:
But is the conventional wisdom justified that the bull market of the early 1970s markedly overvalued these stocks? Or is it possible that investors were right to predict that the growth of these firms would eventually justify their lofty prices? To put it in more general terms: What premium should an investor pay for large, well-established growth stocks?
His conclusion:
Examining the wreckage of the Nifty Fifty in the 1974 bear market, you can find two possible explanations for what happened. The first is that a mania did sweep these stocks, sending them to levels that were totally unjustified on the basis of prospective earnings. The second explanation is that, on the whole, the Nifty Fifty were in fact properly valued at the peak, but a loss of confidence by investors sent them to dramatically undervalued levels.
In 1975 there was no way of knowing which explanation was correct. But 25 years later we can determine whether the Nifty Fifty stocks were overvalued in 1972. Examination of their subsequent returns shows that the second explanation, roundly rejected by Wall Street for years, is much closer to the truth.
He argues that the high valuations of the early 1970s and late 1960s were fair. Instead, investors suffered a loss of confidence.
Those who did not lose confidence as the market swooned and held on to the Nifty Fifty kept pace with the market over the longer term. The table below assesses the Nifty Fifty from the market peak in December 1972 to August 1998, when Siegel wrote the article.
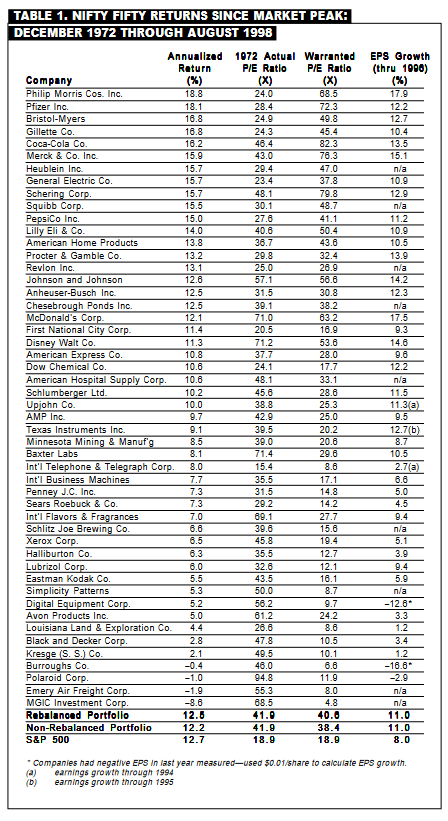
The Nifty Fifty generated returns over Siegel’s 26-year period on par with the S&P 500. Furthermore, the earnings growth was 3% more annually, calibrating almost perfectly with the high valuations of the early 1970s.
The “warranted P/E ratio” column calculates what should have been an appropriate P/E in 1972 had one known the future earnings growth premium between the Nifty Fifty and the market. The warranted and actual P/E ratios are similar in aggregate, but some stocks were expensive and some cheap.
For example, in 1973, Philip Morris had a P/E of 24.0, a 33% premium to the market P/E. Philip Morris would grow earnings by 17.9% compared to 8% for the market. Given that large difference in earnings growth, Phillip Morris was a steal with a P/E of 24. At the time, the fair value P/E for Phillip Morris was 68.5. Anything less than that was cheap in hindsight.

Are The Magnificent Seven In A Bubble or Priced Appropriately
Unlike Siegel, we do not have the benefit of future data to tell us whether the Magnificent Seven is in a bubble or appropriately priced for future earnings growth. However, we can use his logic and appreciate the earnings growth rates implied by current valuations.
We use two time periods, 10 and 26 years, to calculate the earnings growth required to bring the P/E ratios of each stock in line with the market while attaining the same price return.
For example, as shown in the table below, Amazon (AMZN) has a P/E ratio of 62.30, more than three times the S&P 500 (18.90). Before forming an opinion, consider that AMZN has grown its earnings at three times the rate of the S&P 500 over the last five years. For AMZN to perform in line with the market, assuming its P/E falls to market levels, its earnings must grow annually by 19.54% over the next ten years or 11.08% over the next 26 years.

Can Amazon continue to grow its earnings much faster than the economy and market? Given their saturation in many markets, continued double-digit growth will become more difficult by the year.
Even if NVDA becomes the dominant AI semiconductor chip designer and maintains or grows its current market share in other products, will the future chip market be large enough for NVDA to grow 830% (24.70% annually) by 2034?
We should be asking similar questions of all the Magnificent Seven stocks.
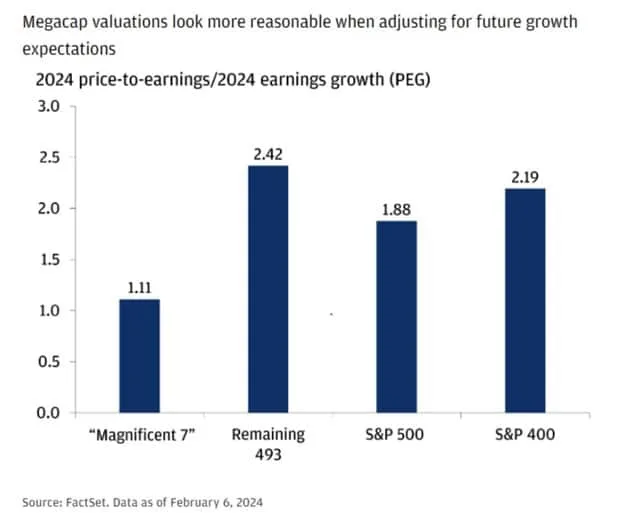
The graph below, courtesy of FactSet, shows that the high P/E ratios of the Magnificent Seven in aggregate may not be out of line with the market when one considers their earnings growth projections.

Summary
Siegel uses 26 years to justify his stance. Different periods will yield different earnings growth requirements. While we can quarrel with his analysis, the point is high valuations are not necessarily a warning. In fact, as we share with Philip Morris, a high valuation for a stock may not be high enough. The important question is, can a stock live up to the earnings growth implied by its valuation?
The market may be underestimating the growth potential for some of the Magnificent Seven stocks and overestimating it for others. But, Siegel states, the most significant risk in the short term may not be growth potential but confidence. Confidence can fade just as quickly as it was born.
We leave you with a quote from Benjamin Graham:
“In the short run, the market is a voting machine, but in the long run, it is a weighing machine.”

