


Last week’s Employment Cost Index (ECI) shook the stock and bond markets as investors worried that higher wages would keep inflation sticky, thus forcing the Fed to push off rate cuts. However, Friday’s BLS report provided optimism for stock and bond investors as it aligned with other wage data that did not show a jump in wages in the first quarter. As witnessed by the initial surge in stock prices and bond yields, investors appear relieved.
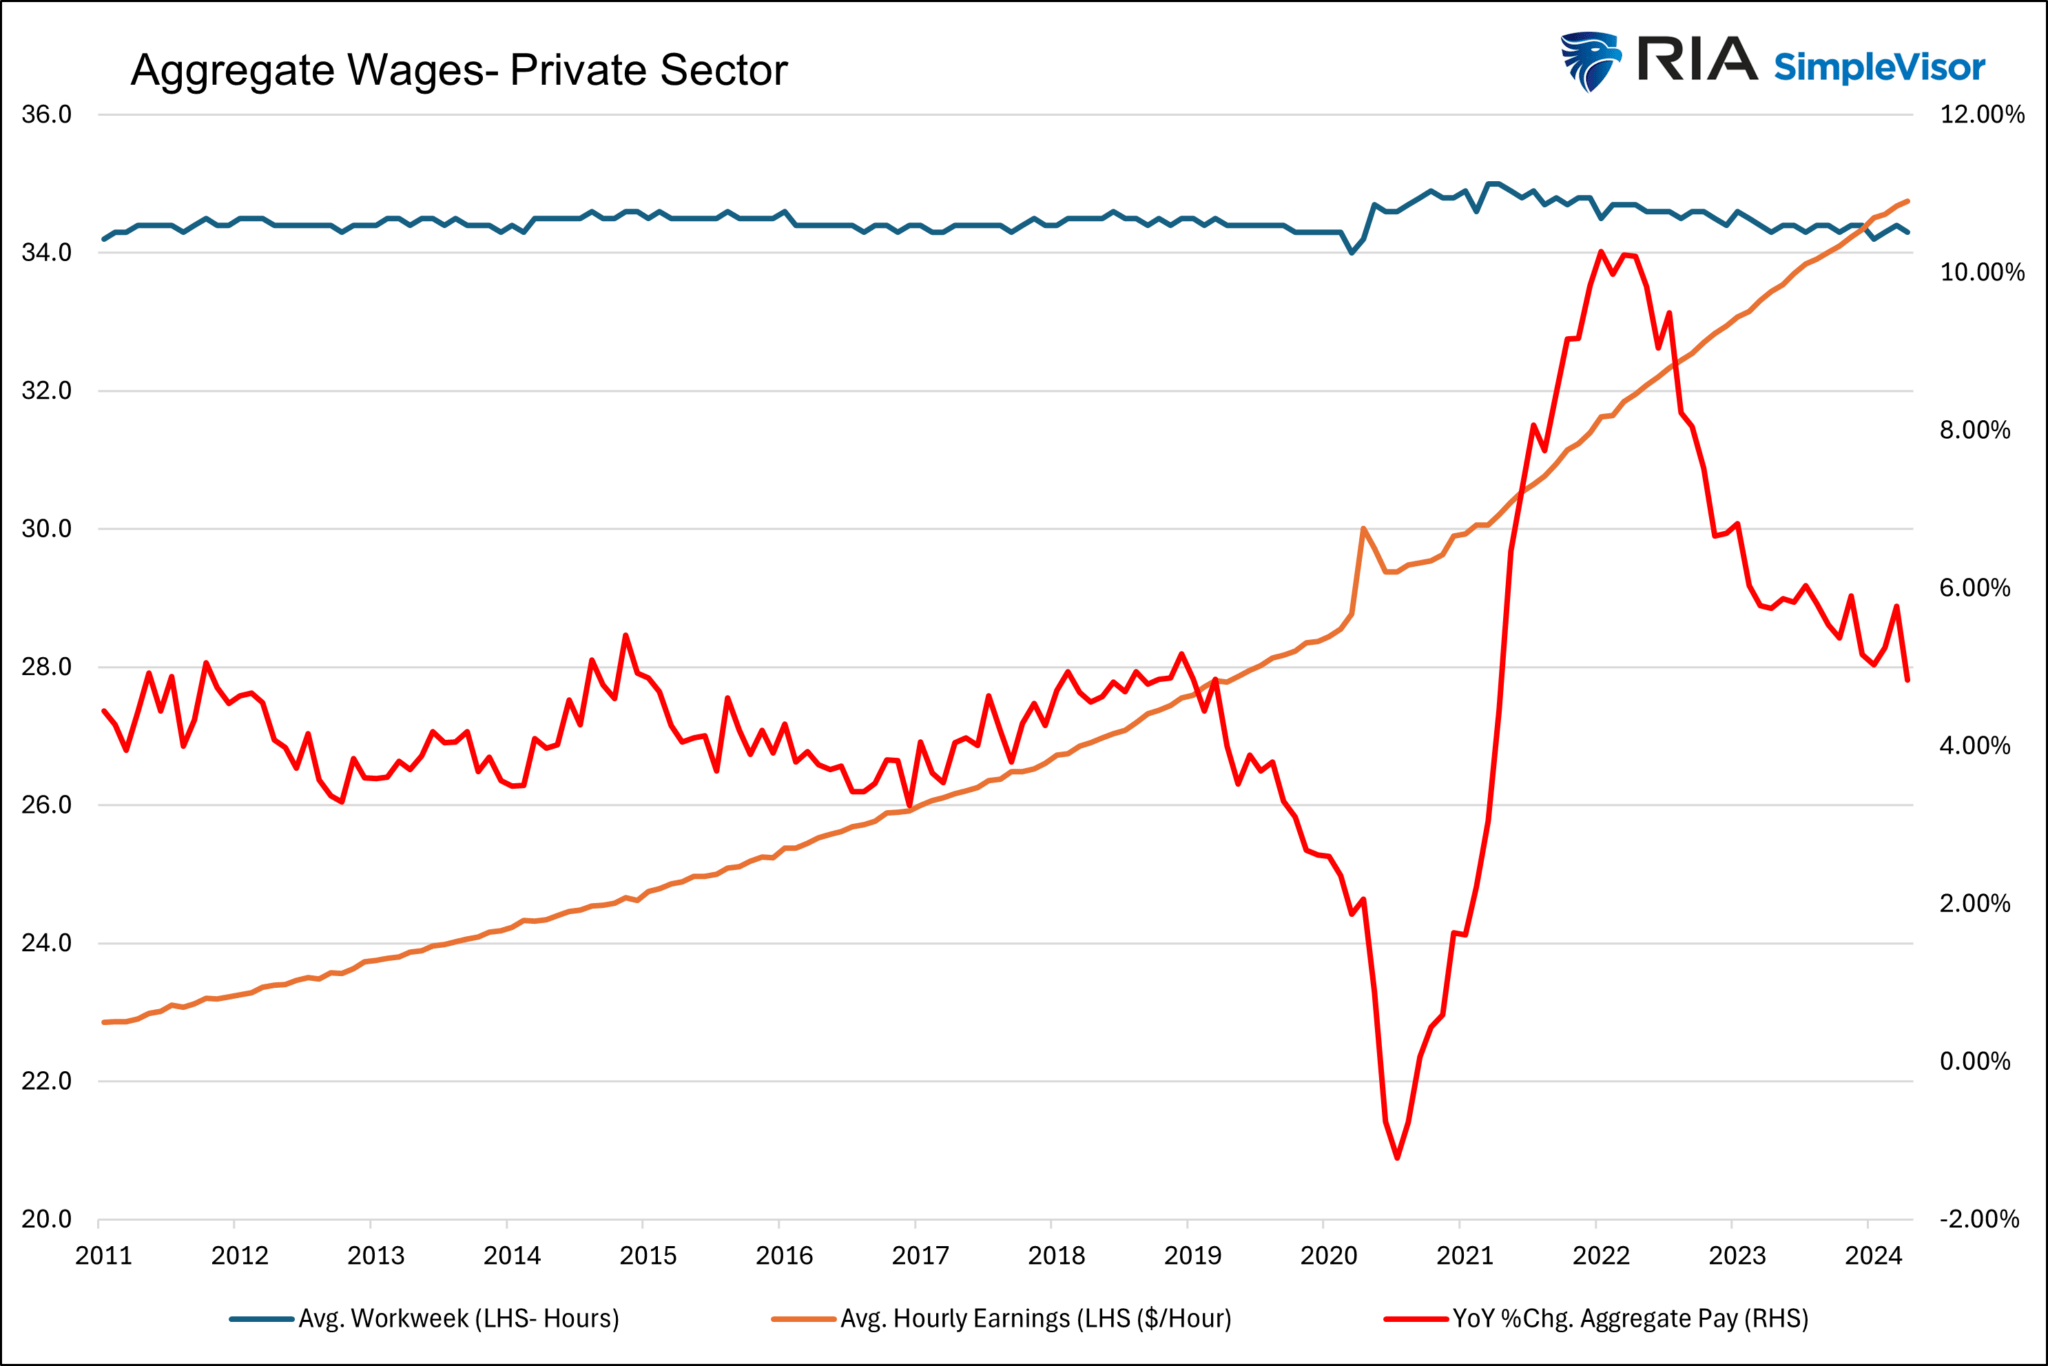
Average hourly earnings in the BLS report rose 0.2%, 0.1% below expectations. Year-over-year wage growth fell to 3.9% from 4.1%. That marks the first annual reading below 4% since June of 2021. Furthermore, the average workweek declined by 0.1. We share the graph below to appreciate the totality of wages, hours worked, and the number of people employed. The orange line shows average hourly earnings have been steadily rising, but the number of hours worked has been falling for three years. The red line shows that the annual growth rate of the product of hours, earnings, and number of employed is back to pre-pandemic levels.
The economy added 175k jobs in April, below estimates of 248k and last month’s 315k. The shortfall versus expectations was the biggest miss since 2021. That says something, considering economists have grossly underestimated job growth over the previous 18 months. The unemployment rate ticked up 0.1% to 3.9%. The household survey, used to calculate the unemployment rate, shows the economy lost 25k jobs last month.
What To Watch Today
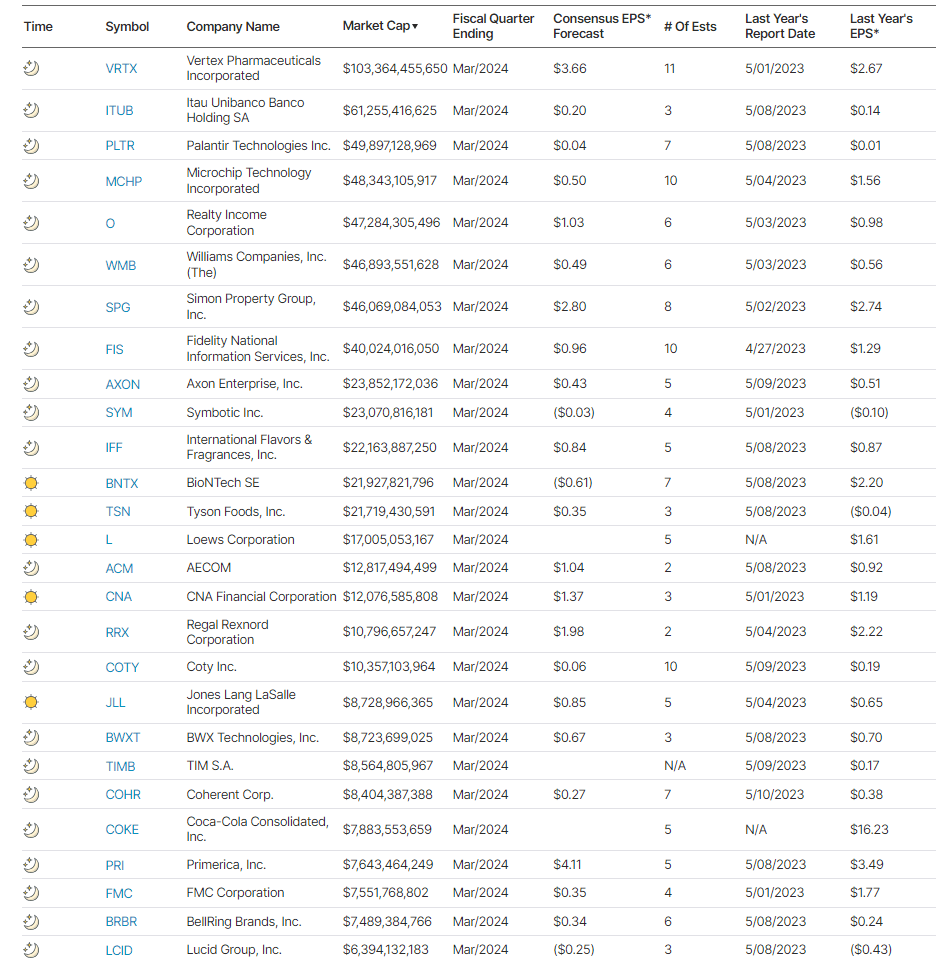
Earnings
Economy
- No notable economic reports
Market Trading Update
Last week, we discussed whether the recent rally from the lows was just a sucker rally ahead of a bigger decline. Our assessment was that was likely not the case. To wit:
“On Friday, following blowout earnings from Google and Microsoft, the market challenged the intersection of the 20- and 50-DMA. With the market not overbought yet and the MACD ‘buy signal’ approaching, the bullish case is building. However, the initial resistance of the 50-DMA could prove challenging.”
On Wednesday, Jerome Powell’s speech following the conclusion of the latest FOMC meeting provided a more “dovish” than expected message. While Powell did note that progress on inflation has been lackluster, the announcement of the reversal of “Quantitative Tightening” (QT) excited the bulls.
Beginning in June, the Committee will slow the pace of decline of its securities holdings by reducing the monthly redemption cap on Treasury securities from $60 billion to $25 billion. The Committee will maintain the monthly redemption cap on agency debt and agency mortgage‑backed securities at $35 billion and will reinvest any principal payments in excess of this cap into Treasury securities”
Of course, the reversal of QT means a buyer of Treasury bonds is returning to the market, increasing overall market liquidity. It also means the Treasury will issue $105 billion less in gross in Q3. The bond market also got the memo, as the Fed’s return to the bond market suggests lower yields in the months ahead, easing financing pressure in the economy.
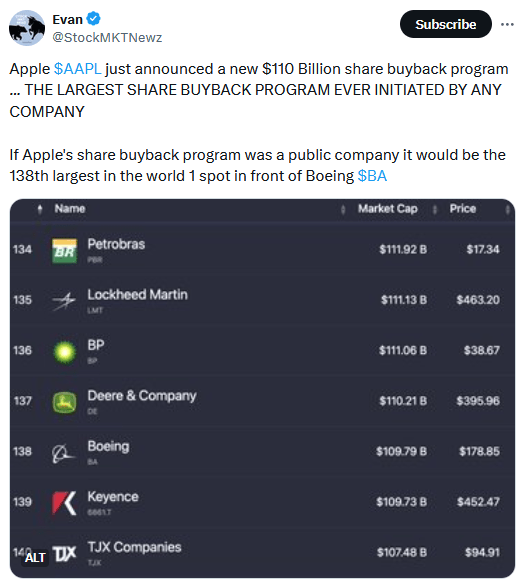
The market surged higher on Thursday and Friday, supported by Apple’s massive $110 billion stock buyback program. With a MACD “buy signal” triggered on Friday and the market not overbought yet, a push above resistance at the 50-DMA seems likely next week. That break of resistance should allow the bulls an opportunity to retest 5200 over the next month or so.
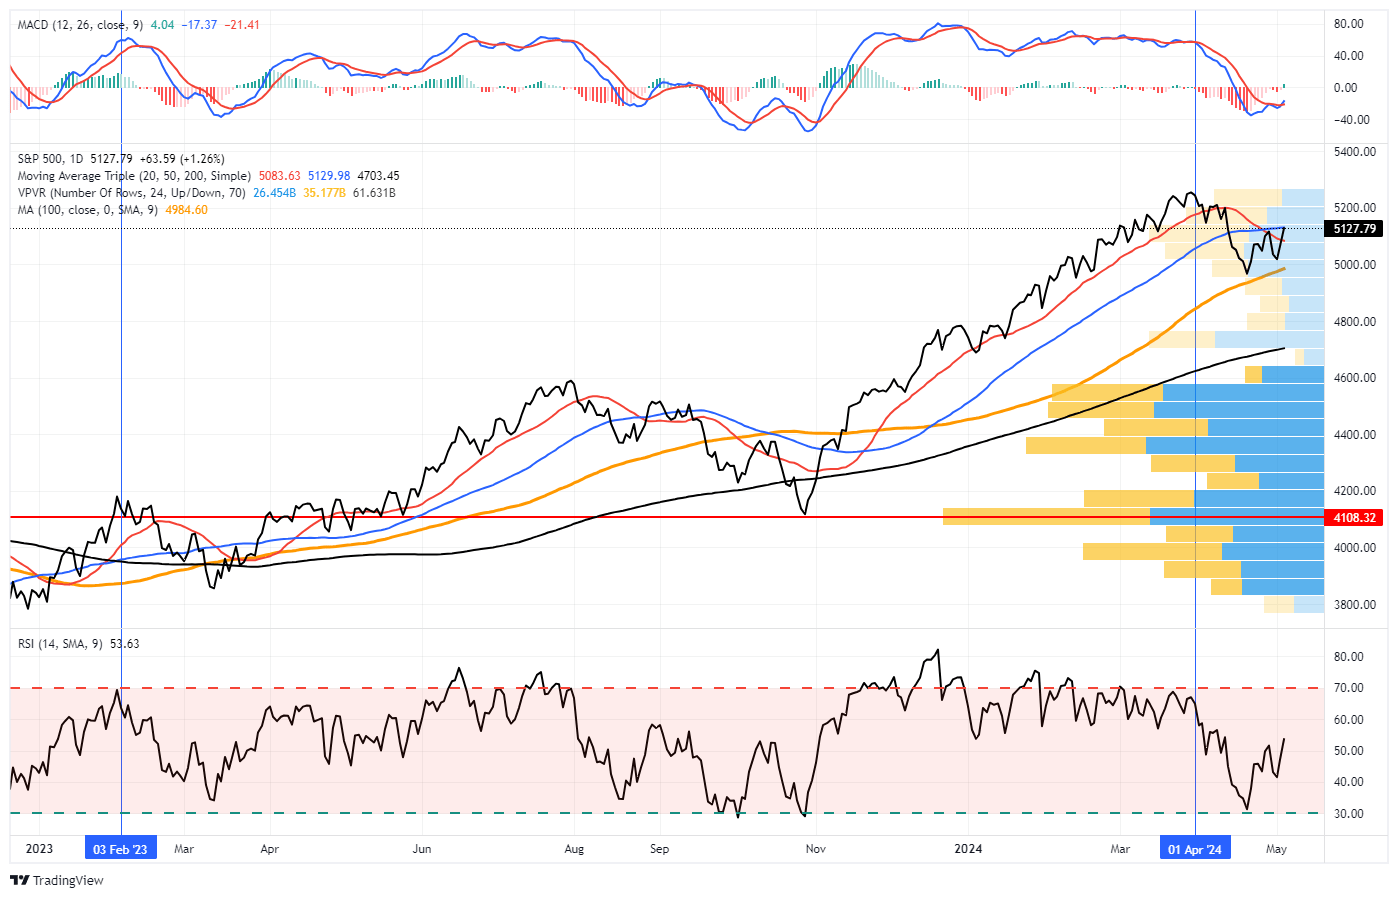
However, while the bullish market setup is intact in the near term, we continue to expect another decline this summer before the election. Historically, institutional players are reticent about holding long exposures heading into an election, so we often see weakness in September and October.

The Week Ahead
This week will be quiet after last week’s deluge of important economic data, corporate earnings, and the Fed meeting. Earnings for the major companies that report on the traditional quarter-ending March-June-September-December cycle are primarily done. There are few companies like Nvidia that report off-cycle. There is little economic data for the week. Stock and bond investors will likely anticipate the CPI and PPI releases next week.
Given the lack of headlines, Fed speakers coming out of their media blackout will take center stage. We suspect they will broadly align with the sentiment Powell gave last week. However, they may have some thoughts on last week’s jobs data or the upcoming inflation reports.
Another Look At Inflation
With CPI being the next major economic release to help guide the Fed, we thought it would be helpful to review a Fed inflation measure that views prices with a different lens.
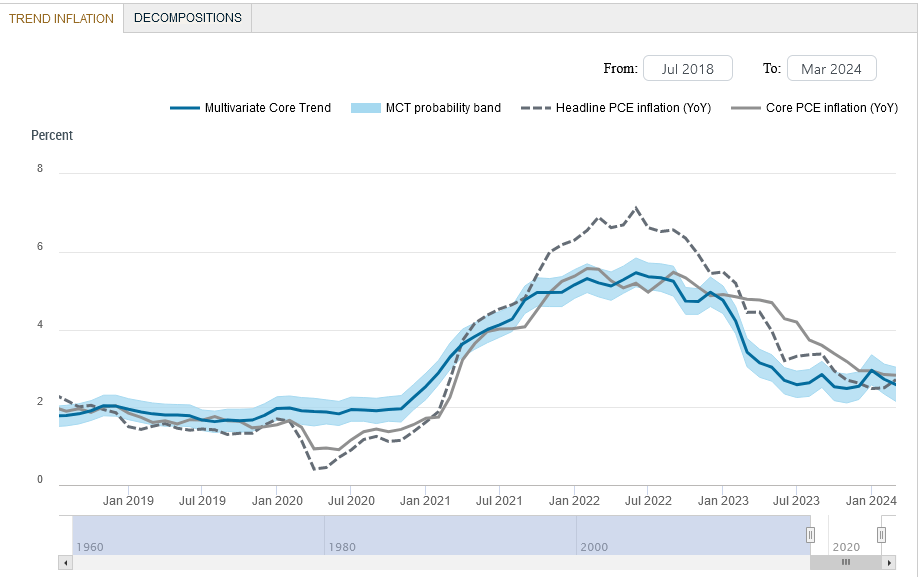
Multivariate Core Trend Inflation (MCT) is a mouthful but influential gauge the Fed uses to measure how persistent or transitory price changes are. MCT assesses whether price changes are a common trend amongst many goods and services or if a few sector-specific factors drive the underlying price changes.
The New York Fed starts with PCE data to compute MCT. Last Monday we learned that this version of PCE fell to 2.6%, down from 2.7% last month. Last month was revised lower from 2.9%. MCT excludes food and energy. In comparison, Core PCE runs at 2.8%. Like PCE, it doesn’t show a resurgence of inflation as CPI alludes to. The reason is that the MCT model helps strip out seasonal and one-off price changes that are not deemed to be statistically persistent. In other words, the model doesn’t think the recent bump in inflation will be lasting.
To help you further understand this inflation measure, we share a FAQ from the New York Fed website:
How does the MCT measure differ from the core personal consumption expenditures (PCE) inflation measure?
The core inflation measure simply removes the volatile food and energy components. The MCT model seeks to further remove the transitory variation from the core sectoral inflation rates. This has been key in understanding inflation developments in recent years because, during the pandemic, many core sectors (motor vehicles and furniture, for example) were hit by unusually large transitory shocks. An ideal measure of inflation persistence should filter those out.
Tweet of the Day
“Want to achieve better long-term success in managing your portfolio? Here are our 15-trading rules for managing market risks.”
Please subscribe to the daily commentary to receive these updates every morning before the opening bell.
If you found this blog useful, please send it to someone else, share it on social media, or contact us to set up a meeting.
Also Read


