


Bulls released a huge sigh of relief last week after encouraging inflation data prompted a sharp move lower in bond yields and the USD. This allowed stocks to rally nearly 1% into the close Friday after surging 5.5% on Thursday. With the USD approaching three standard deviations oversold, a short-term retracement would not be surprising. This would put the rally in equities on hold for now, but given the volatility crush following CPI, we could drift higher for a few more weeks.
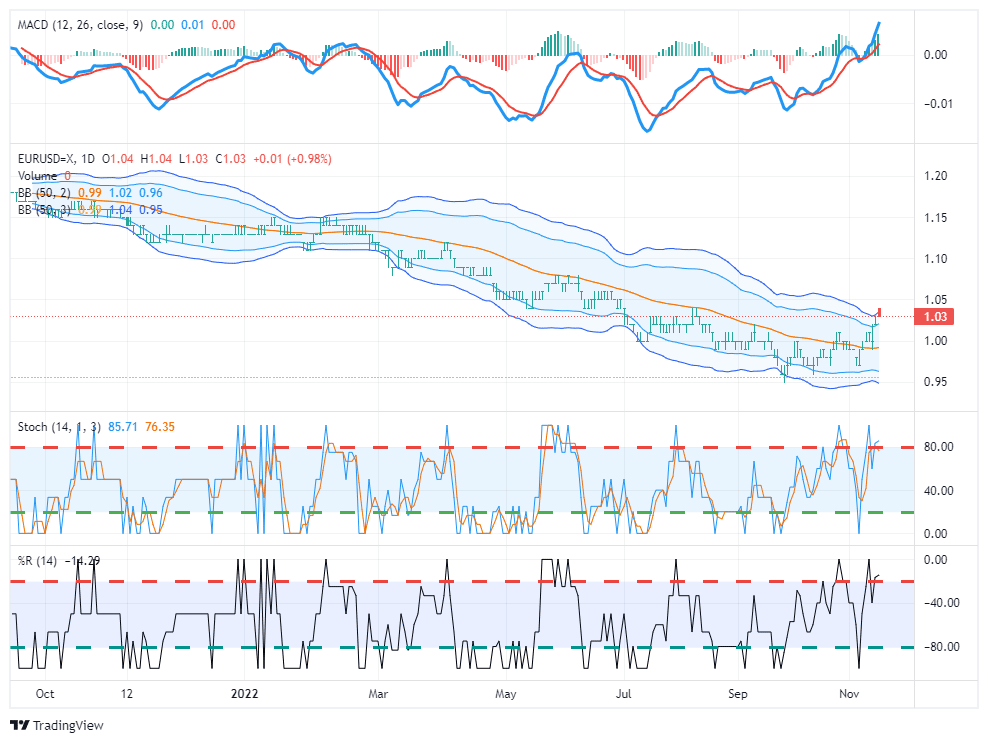
The chart of the Euro/USD exchange rate shows the extremely overbought condition of the Euro relative to the USD currently. While the Euro could rise further relative to a weakening USD, a much-needed relief for weaker European countries, a reversion first would not be surprising.

What To Watch Today
Economy
- No notable economic data is scheduled for release.
Earnings
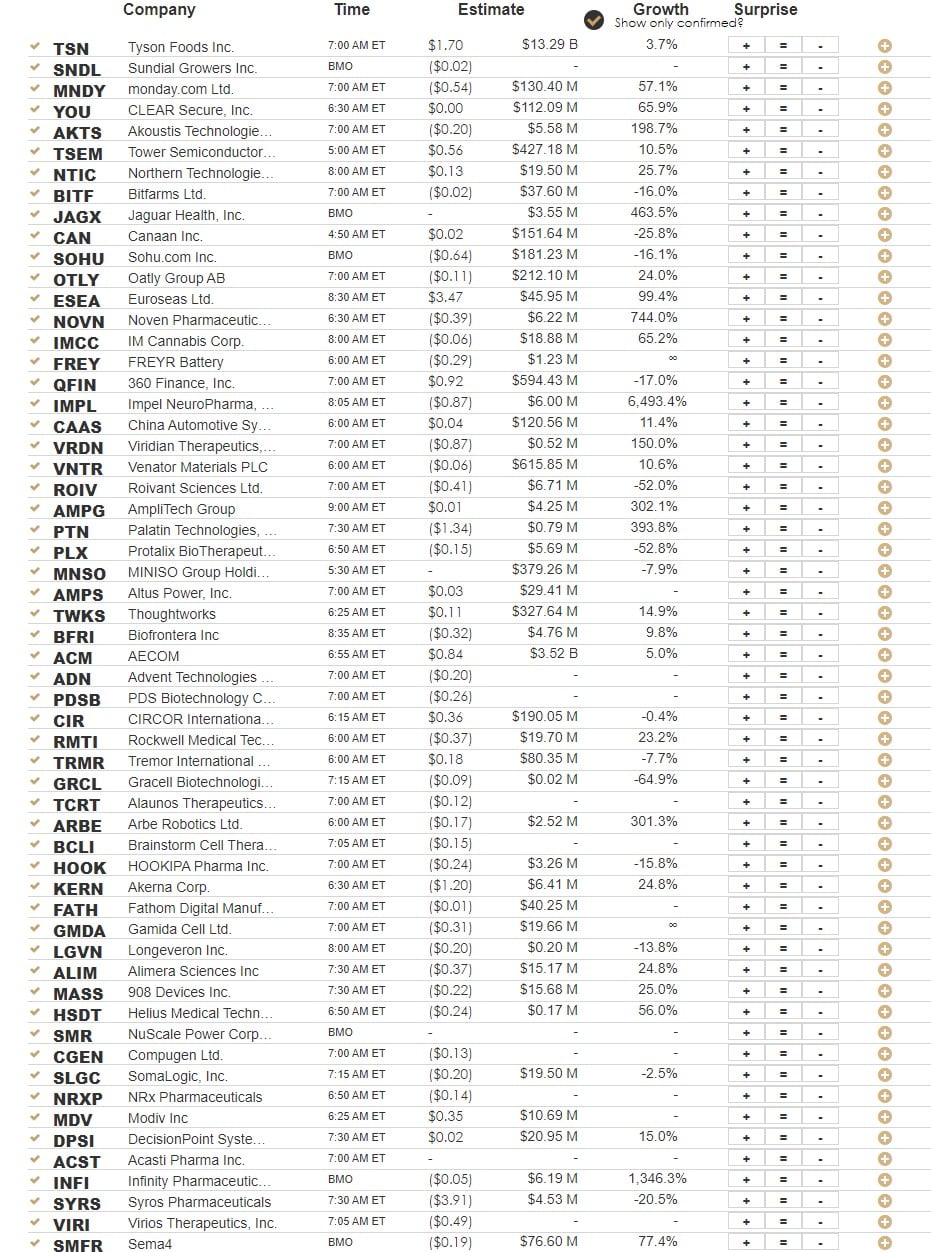
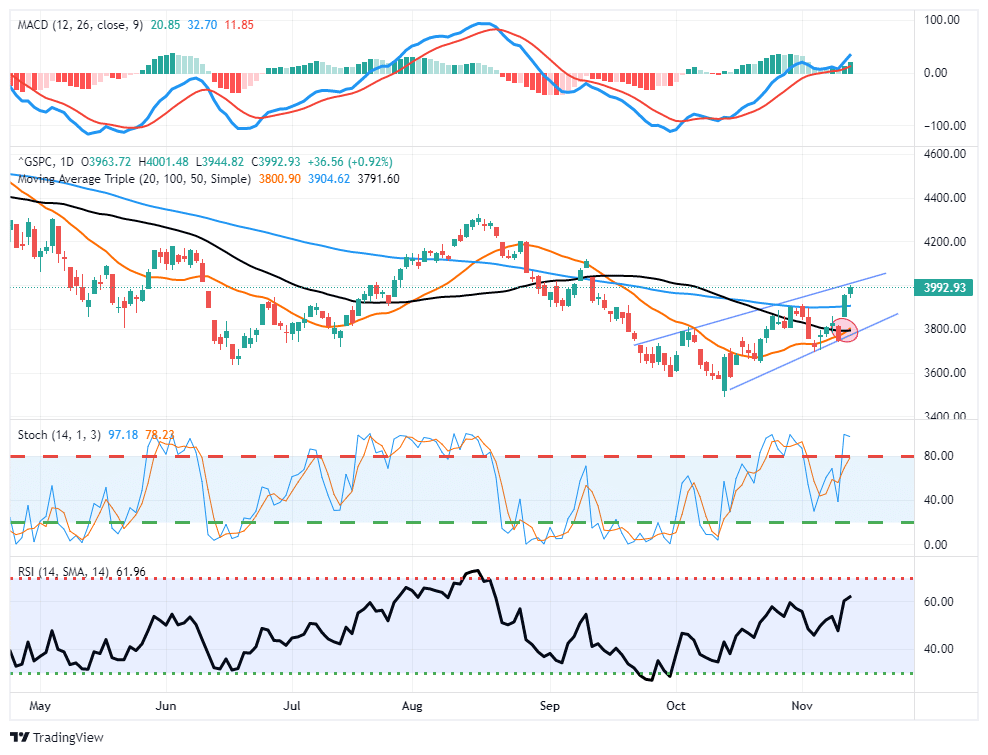
Market Trading Update
From a technical perspective, the market tested and held crucial support again at the 20-dma after the FTX (cryptocurrency) blowup on Wednesday. The subsequent rally off support turned our MACD “buy signal” higher, keeping it intact, and the market cleared critical resistance at the 100-dma. Such now sets the stage for a rally to the 200-dma between 4000 and 4100.
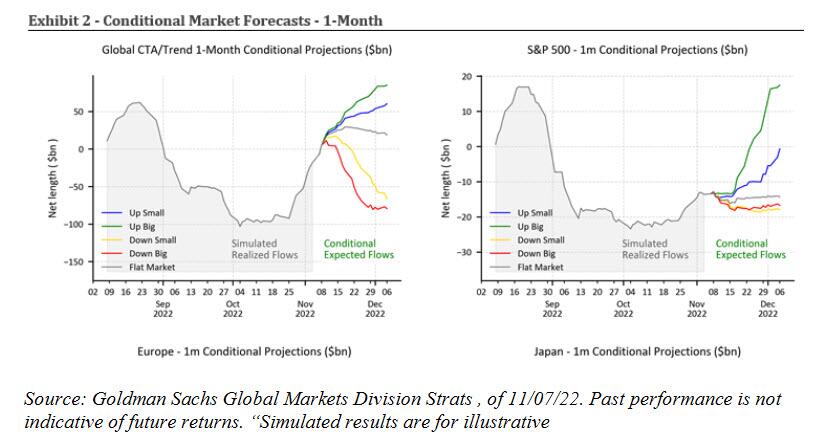
The surge in asset prices also cleared levels that are now forcing short-sellers to cover positions which will add “fuel to the rally” over the next few days. As noted by Goldman Sachs, CTAs bought $43BN last week and $79BN the previous month. Now that we are above the short-term trigger, Goldman calculates a whopping $38 billion to buy over the next week and substantially more (green line) if the market is up big. The chart below shows that the bank expects more than +$79 billion of net buying over the month.
While weaker inflation was evident in the latest report, such does not mean the Fed will stop hiking interest rates. However, as discussed last week following the FOMC meeting, the Fed has already clarified that they will slow the rate hike pace. Such was a point made by Philadelphia Fed President Patrick Harker on Thursday:
“In the upcoming months, in light of the cumulative tightening we have achieved, I expect we will slow the pace of our rate hikes as we approach a sufficiently restrictive stance.”
Moving from 75bps rate hikes to 50bps in December is still a significant “aggressive action” that will impact economic growth in 2023.
The surge in markets, while much needed, is likely another opportunity to reduce risk and rebalance portfolios as we head into 2023. Slower economic growth and falling inflation do not support currently elevated earnings and profit margins.
The Week Ahead
This week starts with another year-ahead consumer inflation expectations survey this morning. While the University of Michigan’s survey is trending higher lately, expectations, as measured by this survey, have not. Its year-ahead expectations for inflation have decreased for three consecutive months, most recently falling to 5.4%. The market will shift focus to October PPI on Tuesday now that CPI is out of the way. As we’ve written previously, the relationship between the two can provide insight into what to expect from profit margins. The consensus estimate is an increase of 0.5% MoM, compared to the October CPI growth of 0.4% MoM.
We’ll get October retail sales on Wednesday, and Thursday will bring an update on the state of the housing market with housing starts and building permits. Estimates bet on housing starts falling again in October to an annualized 1.41 million. Friday, we’ll end the week with existing home sales data for October. The consensus is for another decline to 4.39 million annualized as Fed policy roils the housing market.
Labor Market May Not be As Tight as We Think
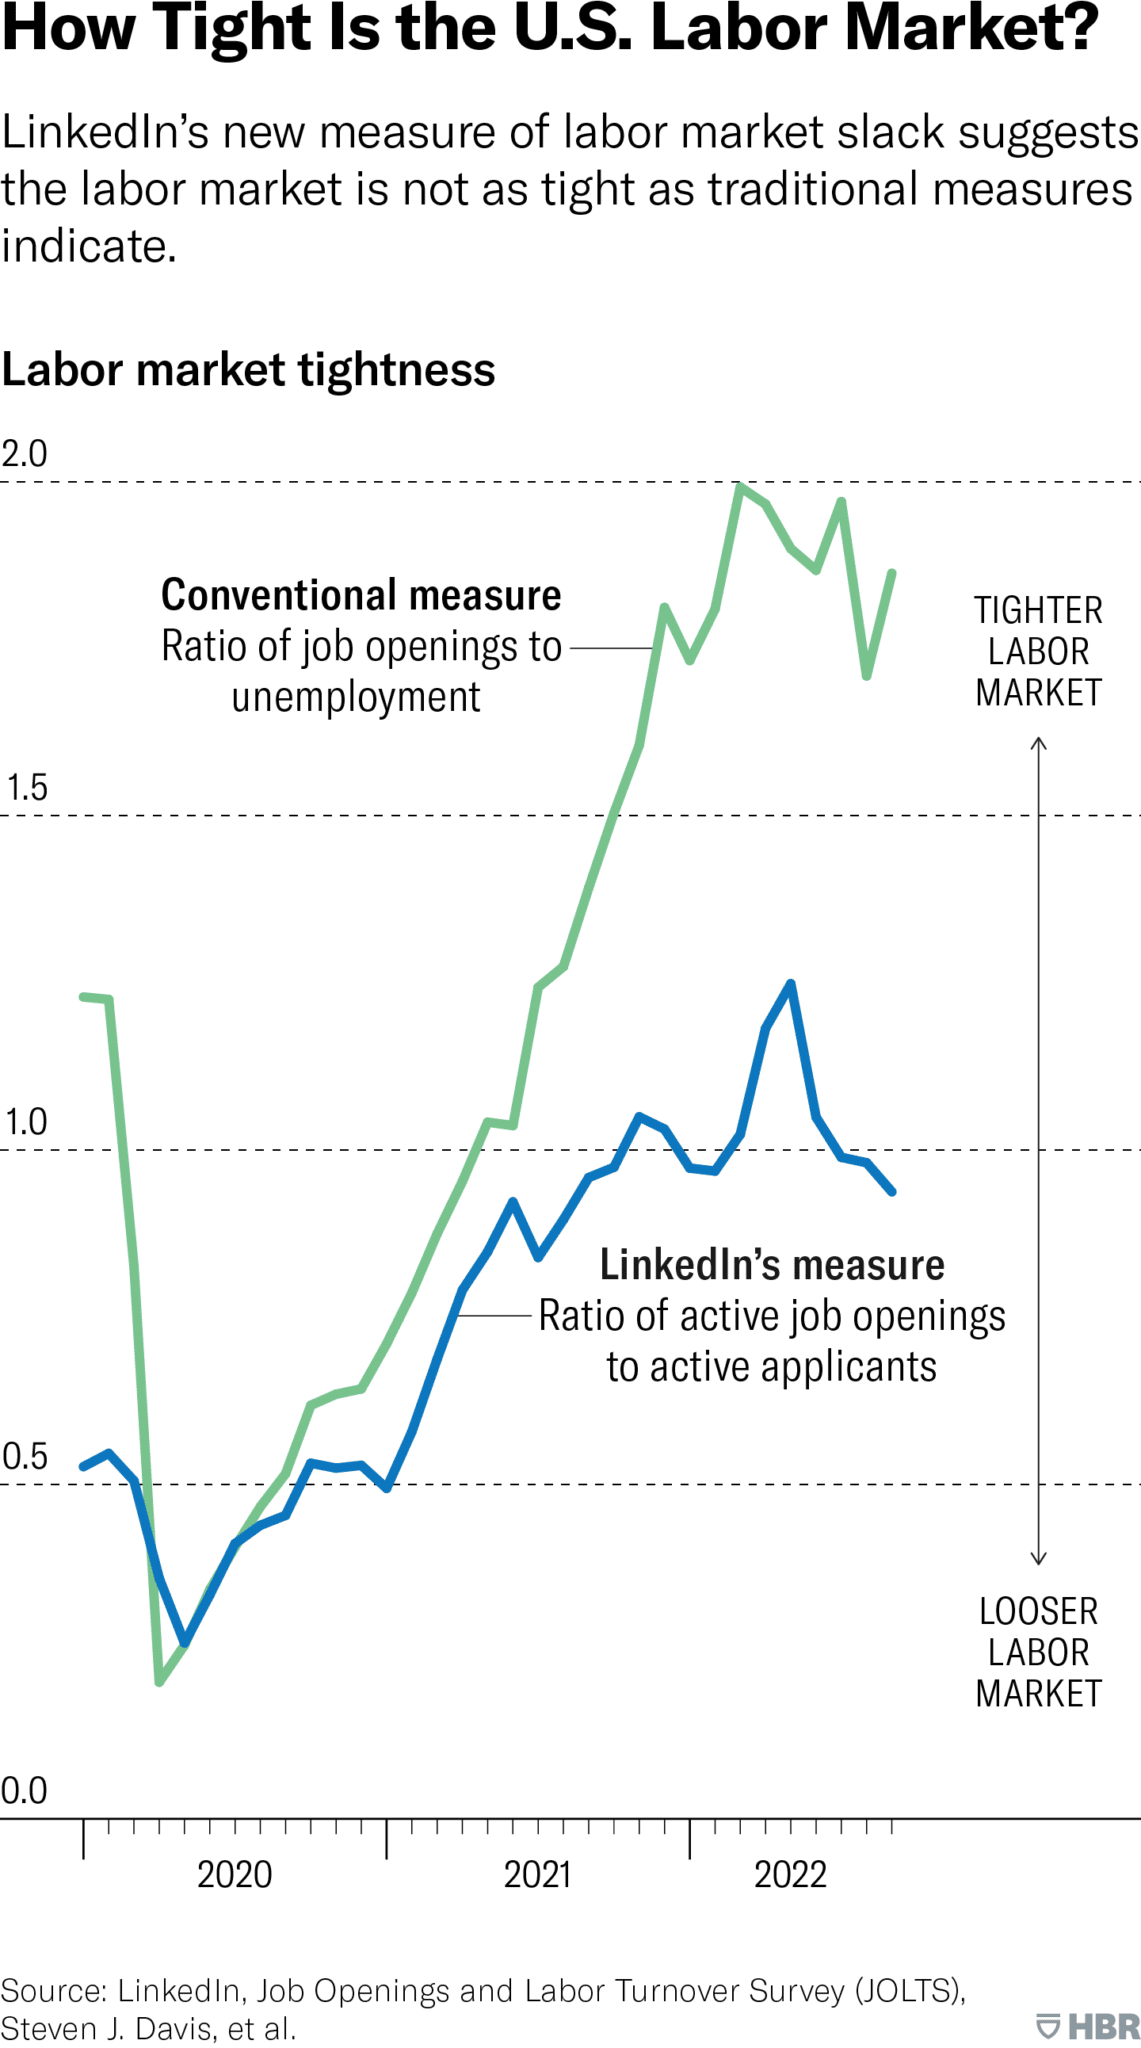
According to an article published by the Harvard Business Review, the labor market may not be as tight as we think. Three researchers at LinkedIn created a new measure of labor market tightness by leveraging the company’s vast data. The authors explain:
“The ratio of job openings to unemployment is over 1.85 today, suggesting that there are nearly two job openings for every unemployed individual looking for a job. This ratio is considerably higher than its pre-pandemic level and higher than the historical norm of about 0.7 since 2000. But if the job openings to unemployment ratio is indicative of a very tight labor market, then why does real wage growth continue to be so tepid? One potential reason for this anomaly is that the labor market is not actually that tight — that is, the standard measures of slack might not be telling the whole story.”
The LinkedIn model of tight labor market conditions attempts to account for active job openings and job seekers. It analyzes the ratio of active job openings posted directly on LinkedIn to active applicants.
“Active applicants are members who submit at least one application to a job opening in a given month. We measure active job openings as the stock of open job positions on the last business day of the month multiplied by an index of recruiting intensity. The idea behind recruiting intensity is to measure how actively employers are looking to fill vacant jobs.”
The chart below plots labor market tightness measured by the JOLTS survey against LinkedIn’s new measure. The stark but plausible difference raises the question of whether the Fed is walking into a trap, given its focus on the labor market.
The Technicality That Bolstered the CPI Report
Last week’s inflation data looked great from a high level prompting a sigh of relief for many— but digging into the numbers reveals a slightly less bullish story. The CPI for health insurance contributes 0.9% of headline and 1.1% of core inflation, dove -4%. This was the largest MoM drop in the data going back to 2005, and it was due to a periodic adjustment that has little to do with actual insurance premium inflation. Without that effect, month-over-month inflation (40bps) would have been 5bps higher.
So why does it matter that this technicality juiced the report? Because the market is taking this report in a more positive light than it should. The adjustment isn’t factored in the Fed’s preferred measure of inflation, the Core PCE Price Index. Furthermore, October PCE data won’t be released until two weeks before the next FOMC meeting, December 13th-14th. The FOMC won’t even consider a quarter of the MoM CPI surprise, so the excitement may be slightly overdone.
Tweet of the Day
Please subscribe to the daily commentary to receive these updates every morning before the opening bell.
If you found this blog useful, please send it to someone else, share it on social media, or contact us to set up a meeting.
Also Read


