An old saying cautions one to be careful of what one wishes for. Stock investors wishing for the Federal Reserve to pivot may want to rethink their logic and review the charts.
The second largest U.S. bank failure and the deeply discounted emergency sale of Credit Suisse have investors betting the Federal Reserve will pivot. They don’t seem to care that inflation is running hot and sticky, and the Fed remains determined to keep rates “higher for longer” despite the evolving crisis.
Like Pavlov’s dogs, investors buy when they hear the pivot bell ringing. Their conditioning may prove harmful if the past proves prescient.

The Bearish History of Rate Cuts
Since 1970, there have been nine instances in which the Fed significantly cut the Fed Funds rate. The average maximum drawdown from the start of each rate reduction period to the market trough was 27.25%.
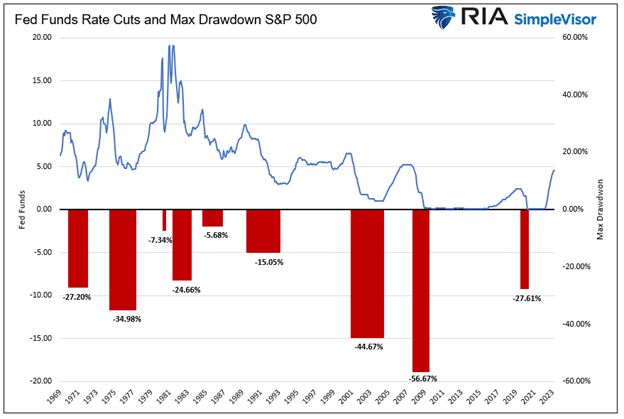
The three most recent episodes saw larger-than-average drawdowns. Of the six other experiences, only one, 1974-1977, saw a drawdown worse than the average.
So why are the most recent drawdowns worse than those before 1990? Before 1990, the Fed was more active. As such, they didn’t allow rates to get too far above or below the economy’s natural rate. Indeed, high inflation during the 1970s and early 1980s forced Fed vigilance. Regardless of the reason, higher interest rates helped keep speculative bubbles in check.
During the last 20 years, the Fed has presided over a low-interest rate environment. The graph below shows that real yields, yields less inflation expectations, have been trending lower for 40 years. From the pandemic until the Fed started raising rates in March 2022, the 10-year real yield was often negative.
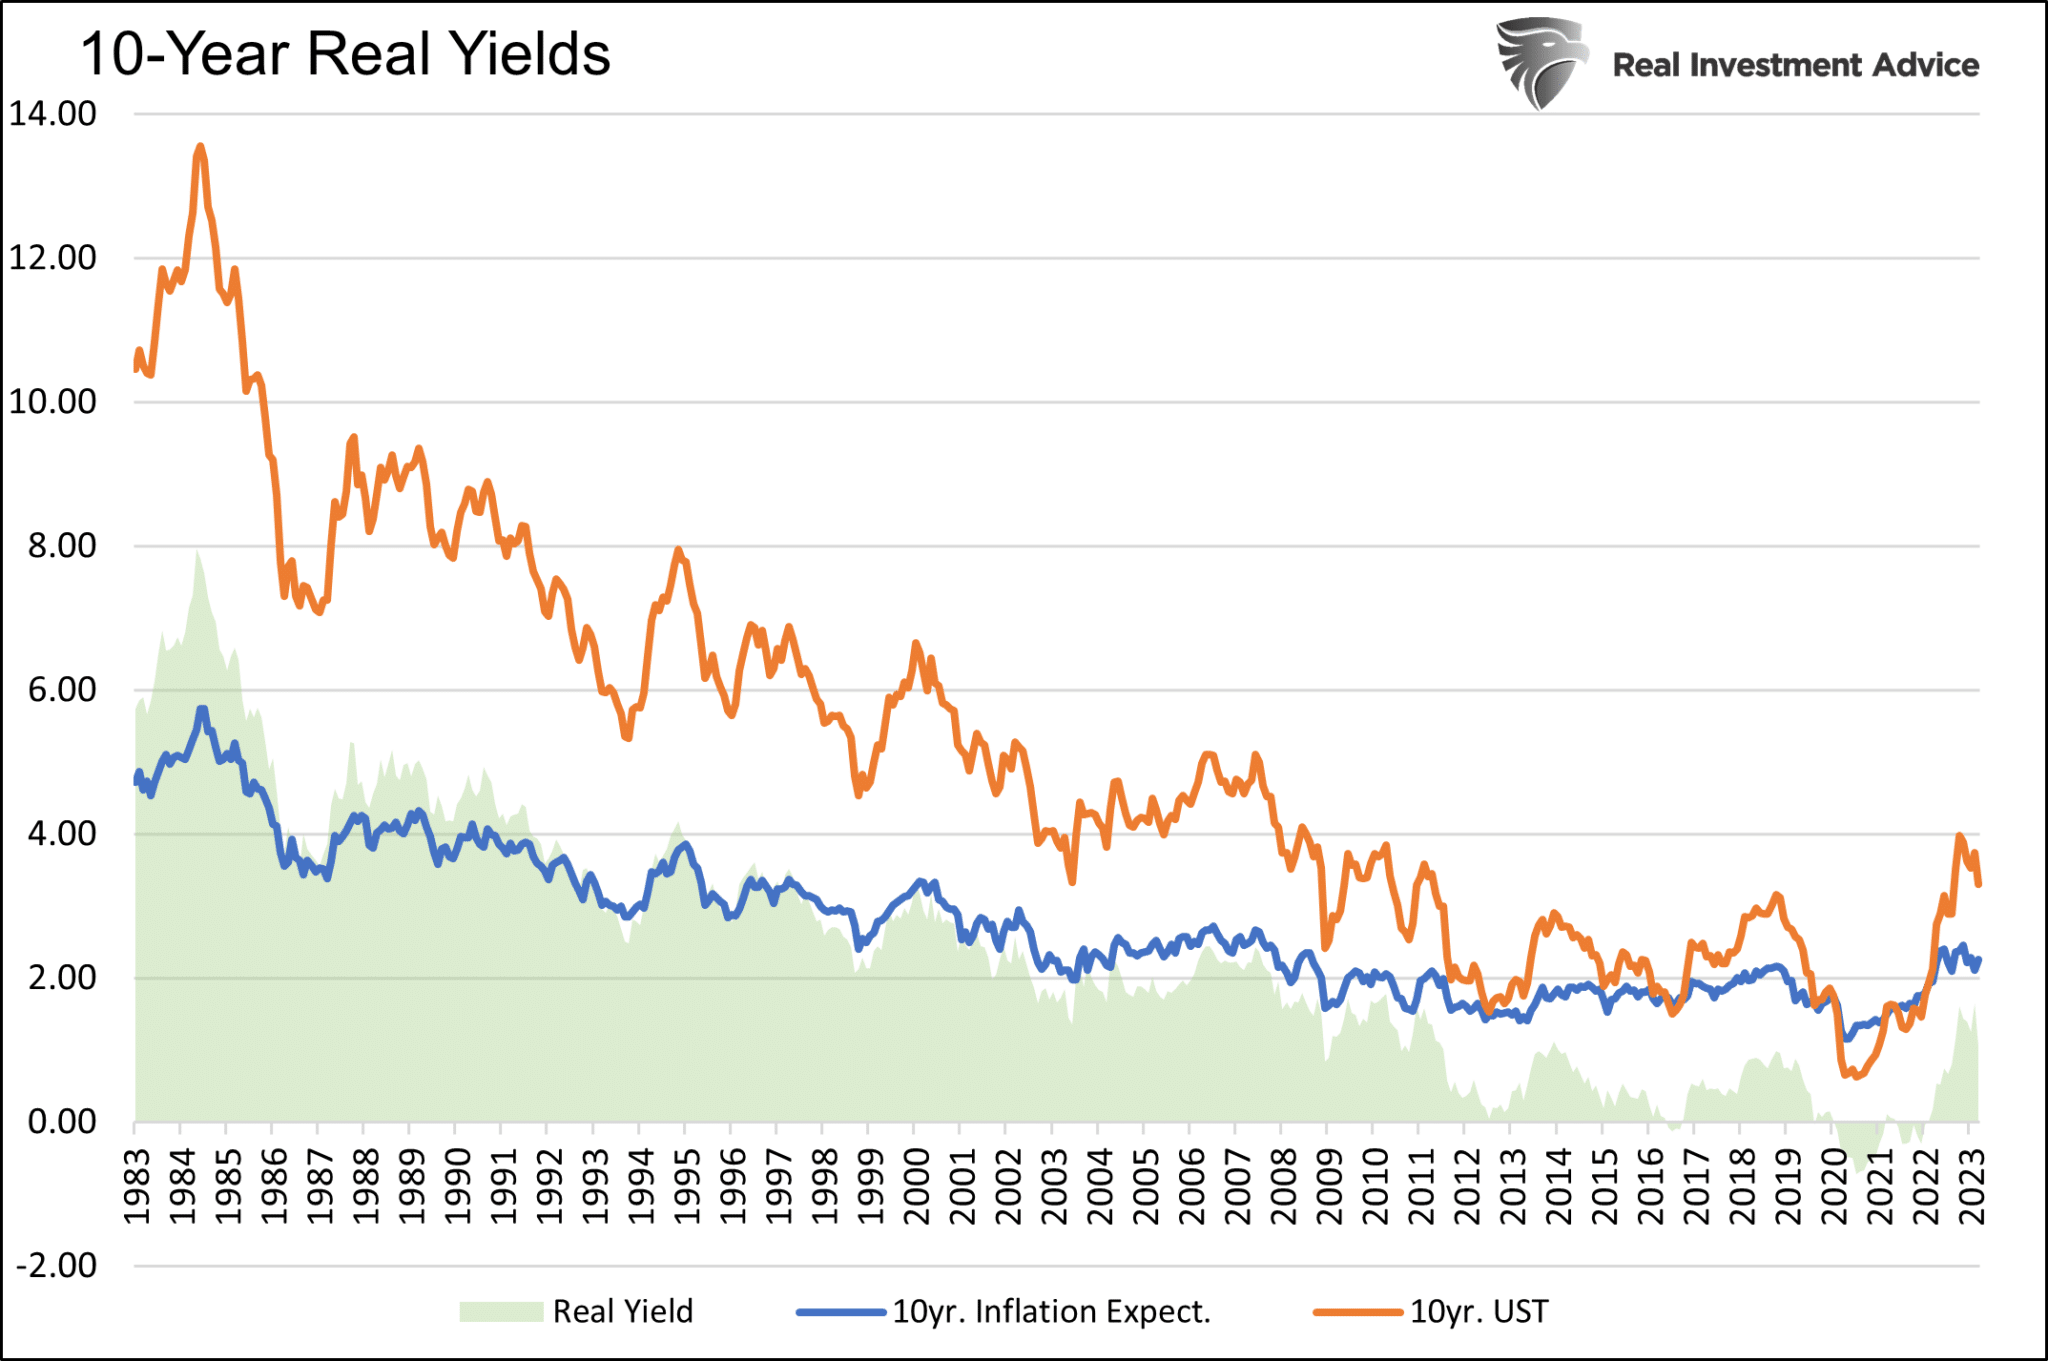
Speculation often blossoms when interest rates are predictably low. As we are learning, such speculative behavior emanating from Fed policy in 2020 and 2021 led to conservative bankers and aggressive hedge funds taking outsized risks. While not coming to their side, what was their alternative? Accepting a negative real return is not good for profits.
We take a quick detour to appreciate how the level of interest rates drives speculation.

Wicksell’s Elegant Model
A few years ago, we shared the logic of famed Swedish economist Knut Wicksell. The nineteenth-century economist’s model states two interest rates help assess economic activity. Per Wicksell’s Elegant Model:
First, there is the “natural rate,” which reflects the structural growth rate of the economy (which is also reflective of the growth rate of corporate earnings). The natural rate is the combined growth of the working-age population and productivity growth. Second, Wicksell holds that there is the “market rate” or the cost of money in the economy as determined by supply and demand.
Wicksell viewed the divergences between the natural and market rates as the mechanism by which the economic cycle is determined. If a divergence between the natural and market rates is abnormally sustained, it causes a severe misallocation of capital.
The bottom line:
Per Wicksell, optimal policy should aim at keeping the natural and market rate as closely aligned as possible to prevent misallocation. But when short-term market rates are below the natural rate, intelligent investors respond appropriately. They borrow heavily at the low rate and buy existing assets with somewhat predictable returns and shorter time horizons. Financial assets skyrocket in value while long-term, cash-flow-driven investments with riskier prospects languish.
The second half of 2020 and 2021 provide evidence of Wicksell’s theory. Despite brisk economic activity and rising inflation, the Fed kept interest rates at zero and added more to its balance sheet (QE) than during the Financial Crisis. The speculation resulting from keeping rates well below the natural rate was palpable.
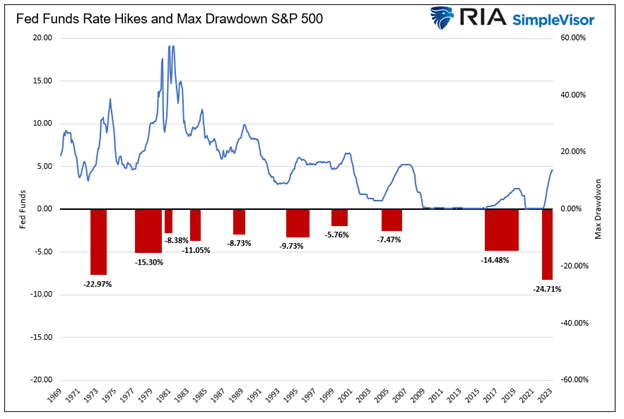
What Percentage Drawdown Should We Expect This Time?
Since the market experienced a decent drawdown during the rate hike cycle starting in March 2022, might a good chunk of the rate drawdown associated with a rate cut have already occurred?
The graph below shows the maximum drawdown from the beginning of rate hiking cycles. The average drawdown during rate hiking cycles is 11.50%. The S&P 500 experienced a nearly 25% drawdown during the current cycle.
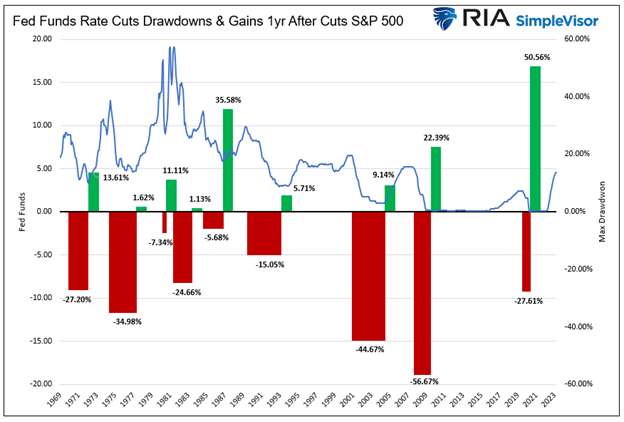
There are two other considerations in formulating expectations for what the next Federal Reserve pivot has in store for stocks.
First, the graph below shows the maximum drawdowns during rate-cutting periods and the one-year returns following the final rate cut. From May 2020 to May 2021, the one-year period following the last rate cut, the S&P 500 rose over 50%. Such is three times the 16% average of the prior eight episodes. Therefore, it’s not surprising the maximum drawdown during the current rate hike cycle was larger than average.
Second, valuations help explain why recent drawdowns during Federal Reserve pivots are worse than those before the dot-com bubble crash. The graph below shows the last three rate cuts started when CAPE10 valuations were above the historical average. The prior instances all occurred at below-average valuations.
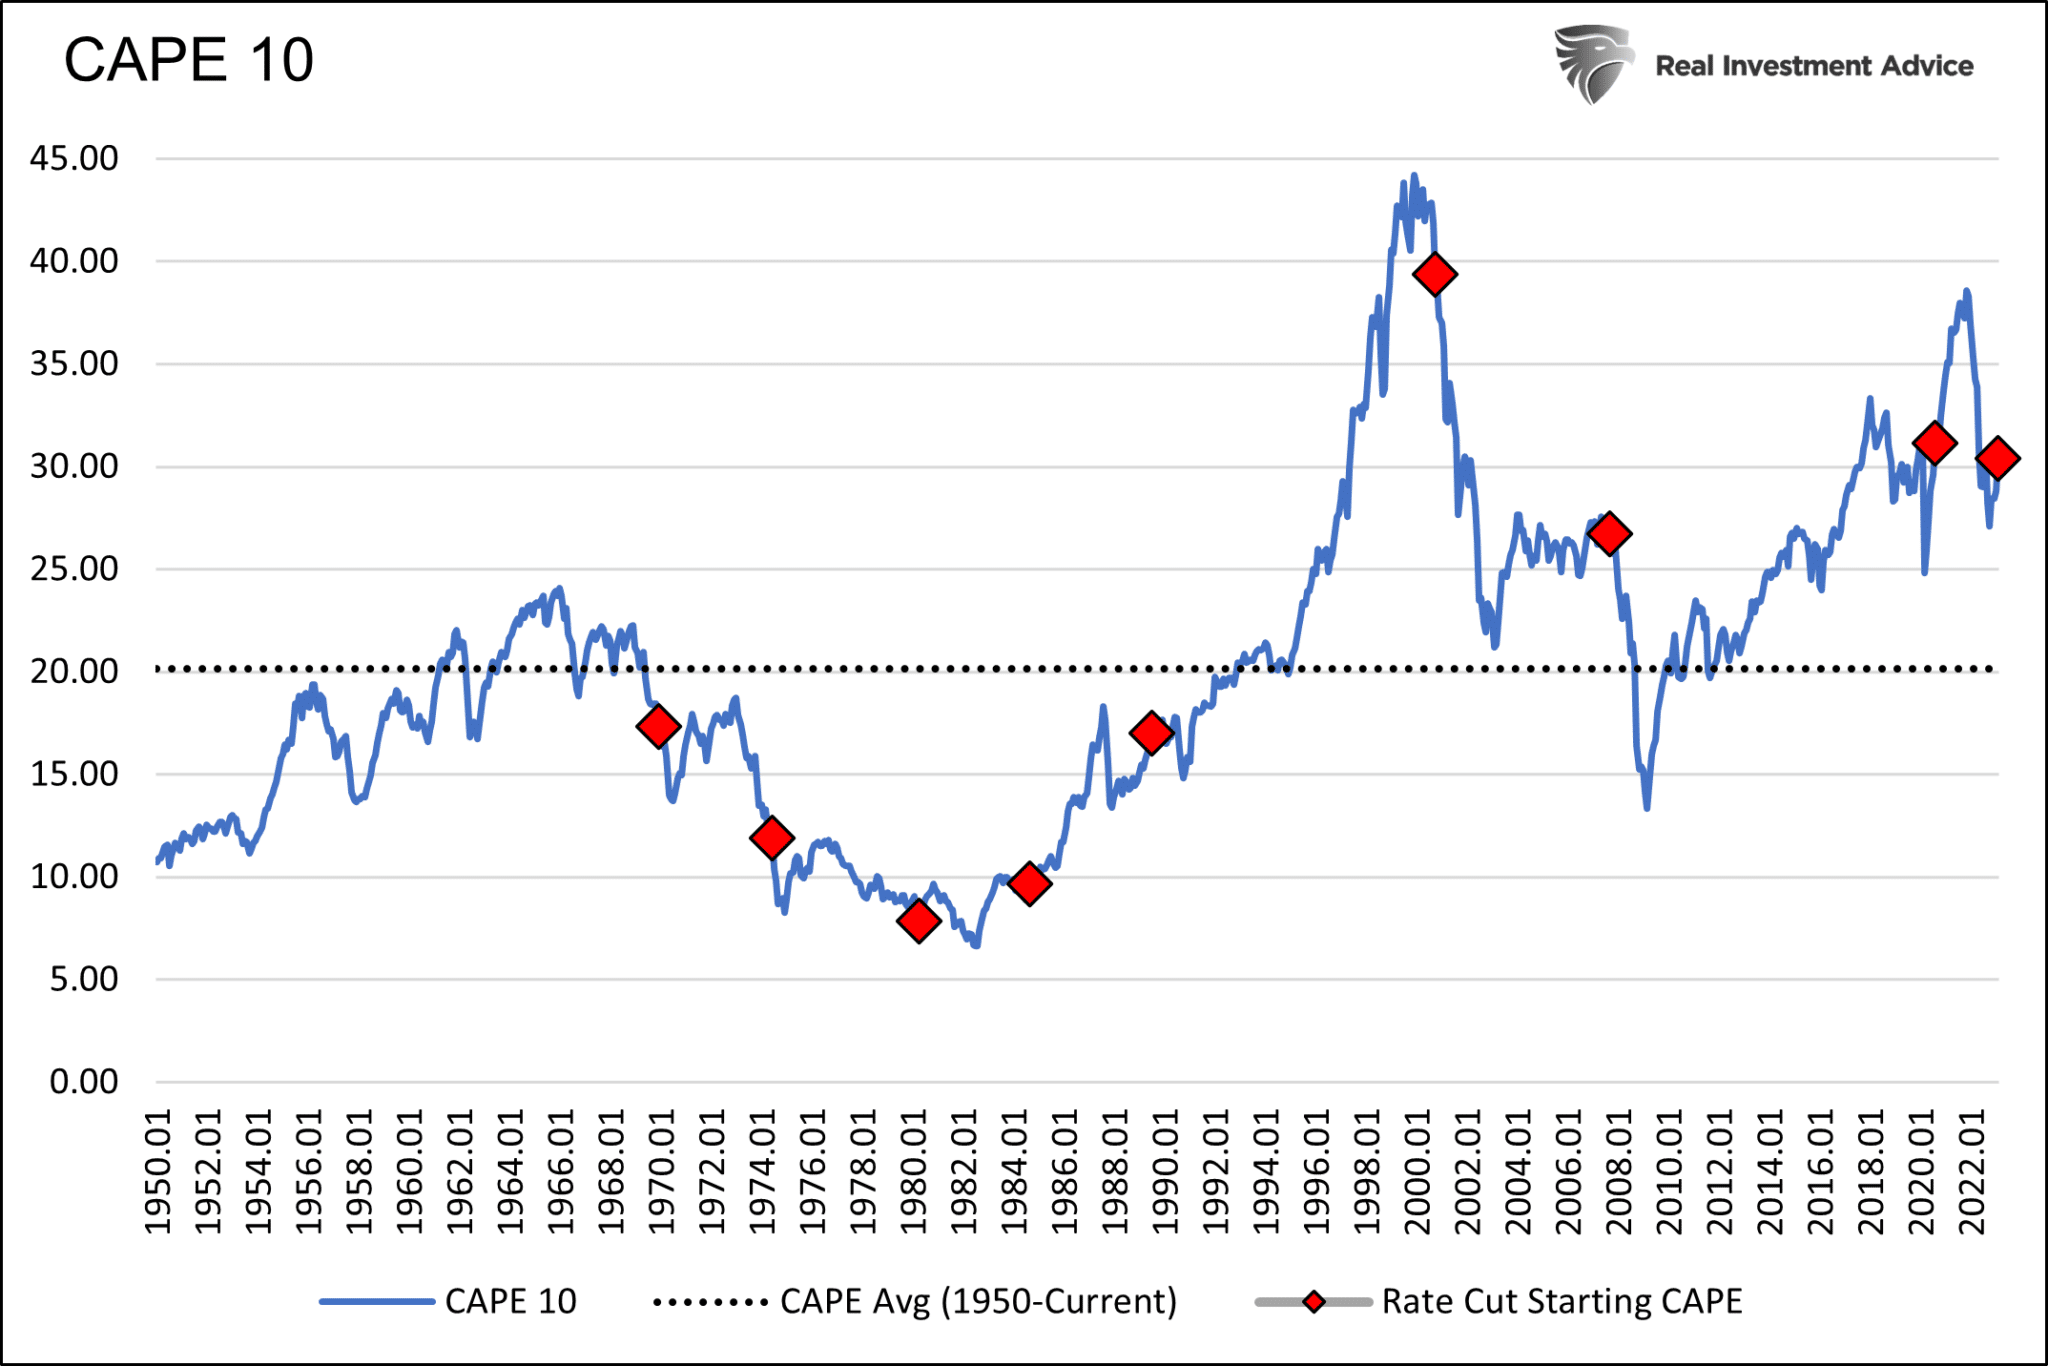
The current CAPE valuation is not as extended as in late 2021 but is about 50% above average. While the market has already corrected some, the valuation may still return to average or below it, as it did in 2003 and 2009.
It’s tough to draw conclusions about the 2020 drawdown. Unprecedented fiscal and monetary policies played a prominent role in boosting animal spirits and elevating stocks. Given inflation and political discord, we don’t think Fed members or politicians will be likely to gun the fiscal and monetary engines in the event of a more significant market decline.

Summary
The Federal Reserve is outspoken about its desire to get inflation to its 2% target. If they were to pivot by as much and as soon as the market predicts, something has broken. Currently, it would take a severe negative turn to the banking crisis or a rapidly deteriorating economy to justify a pivot, the likes of which markets imply. Mind you, something breaking, be it a crisis or recession, does not bode well for corporate earnings and stock prices.
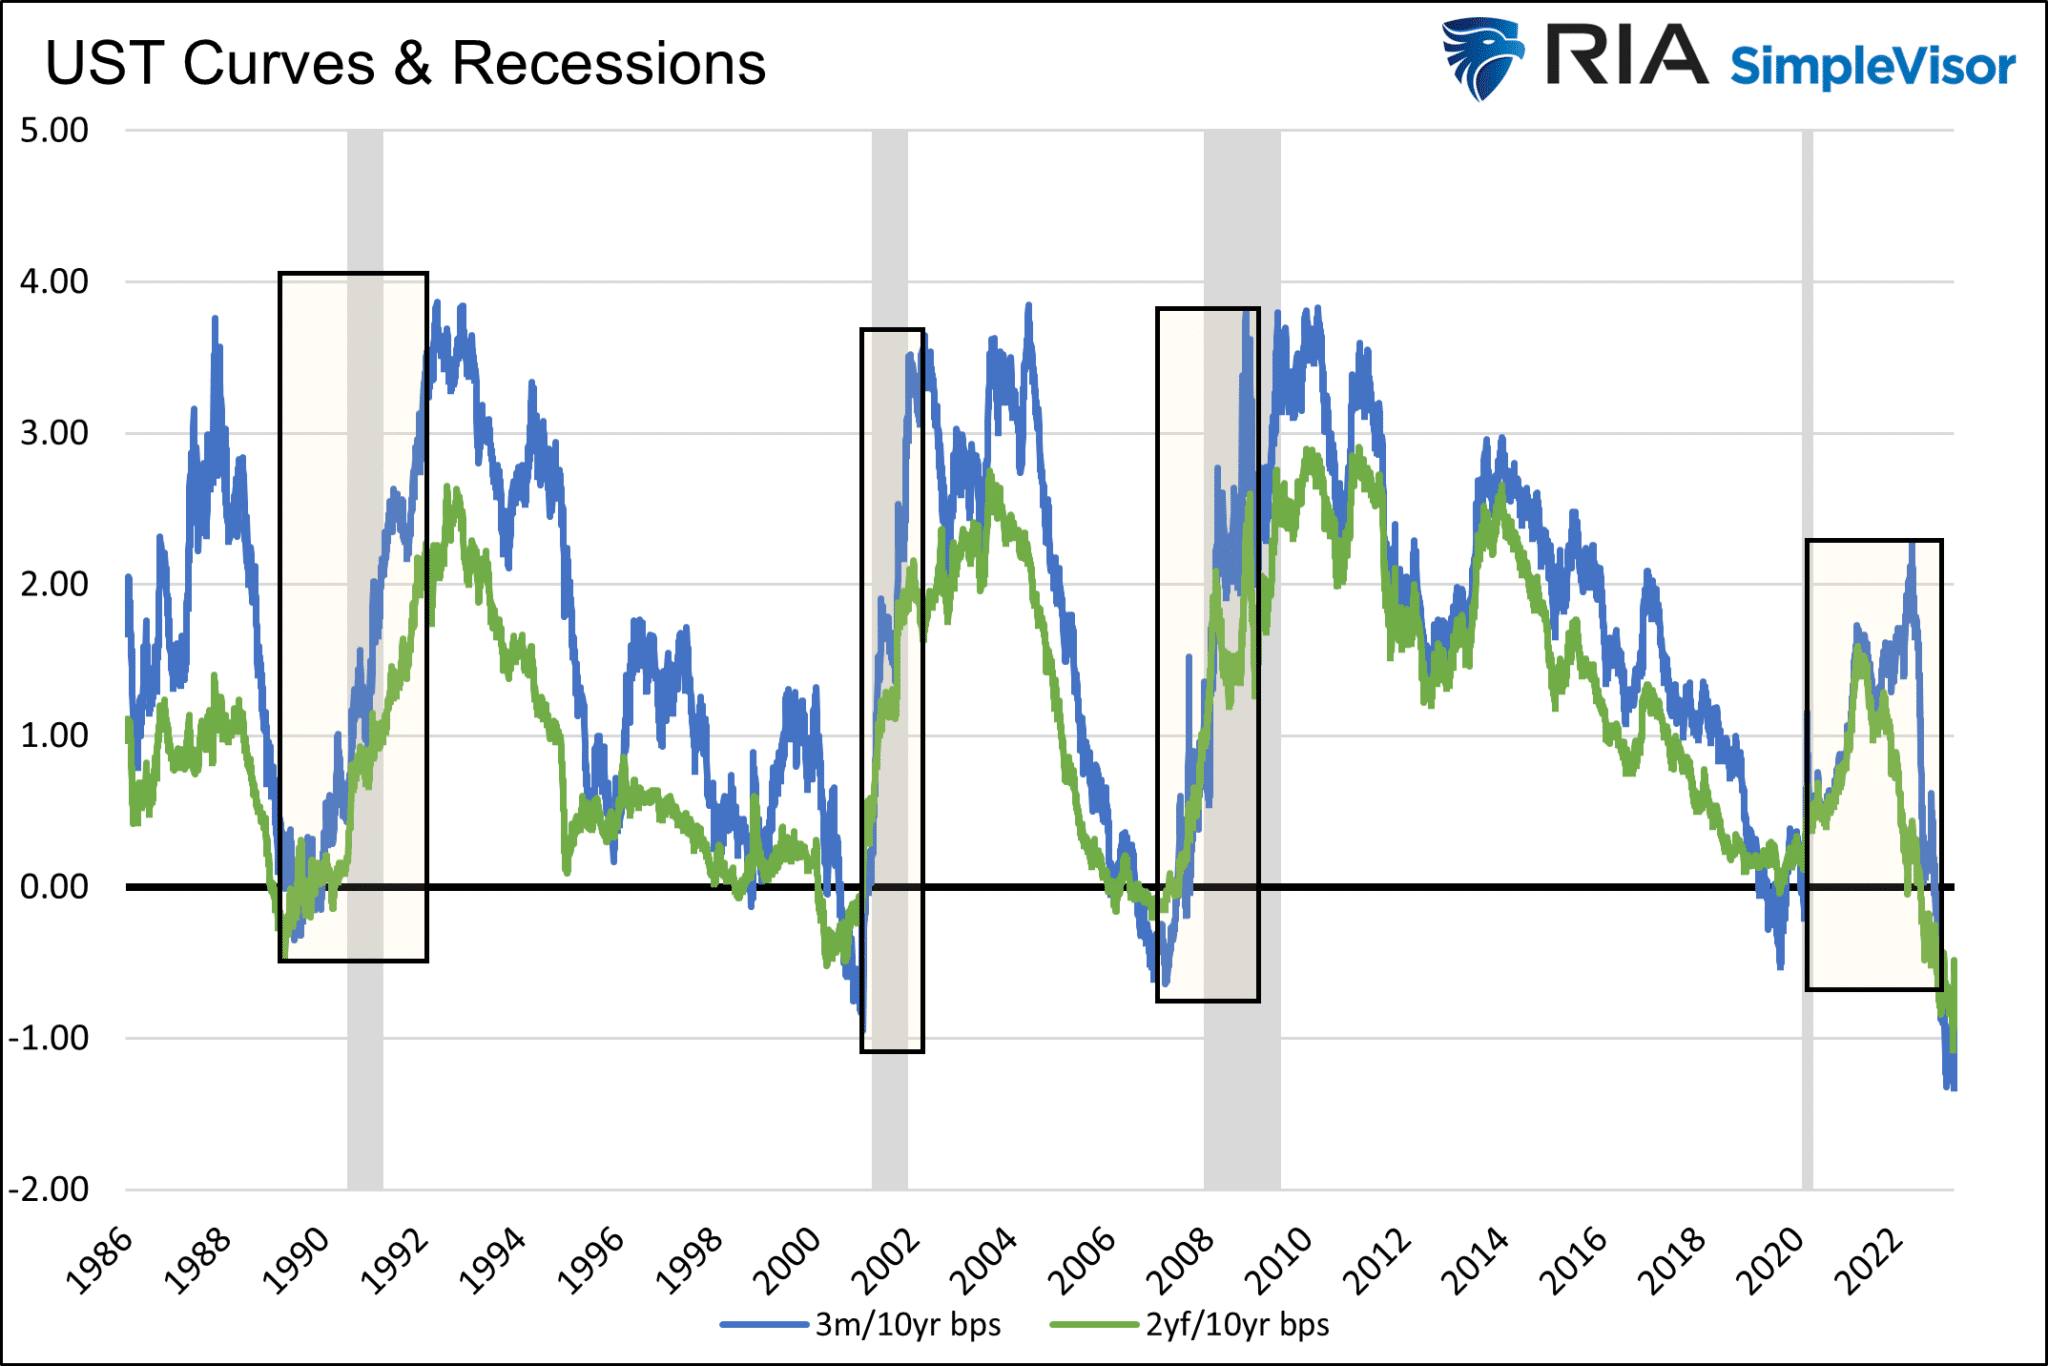
There is one more point worth considering regarding a Federal Reserve pivot. If the Fed cuts Fed Funds, the yield curve will likely un-invert and return to a normal positive slope. Historically yield curve inversions, as we have, are only recession warnings. The un-inversion of yield curves has traditionally signaled that a recession is imminent.
The graph below shows two well-followed Treasury yield curves. The steepening of both curves, shown in all four cases and other instances before 1990, accompanied a recession.
Over the past two weeks, the two-year- ten-year UST yield curve has steepened by 60 bps!