This past weekend, we received this question from a reader. The question is in reference to our recent article, Bull Steepener is Bearish. Specifically, the article points out that historically, stocks tend to do poorly when the yield curve exhibits a bullish steepening. However, gold miners and gold have both averaged positive returns during such yield curve shifts. Moreover, during these periods, gold miners produced a better return than gold. Therefore, the question from our reader is, are gold miners better than gold if the yield curve continues to steepen bullishly?
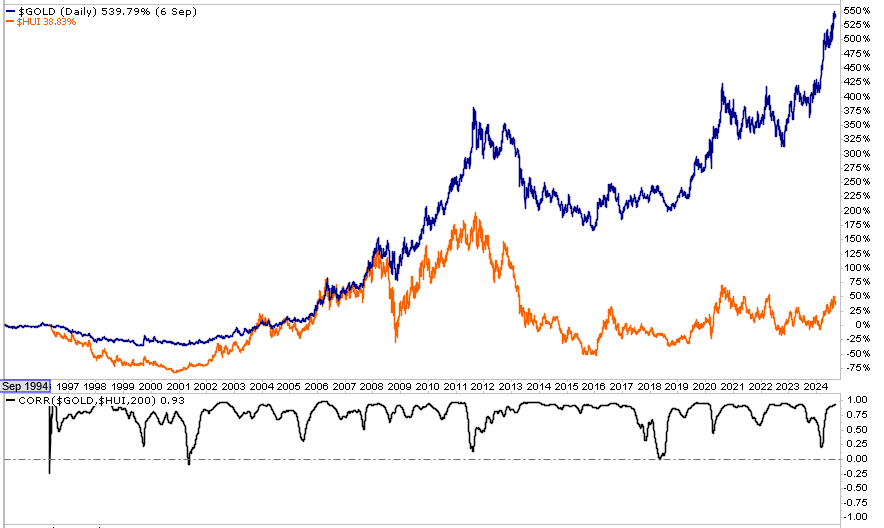
While our data on the last five bull steepenings argues the answer is yes, historically, gold miners have been a poor substitute for gold. As shown in the graph below, since 1994, the NYSE Gold BUGS Index (HUI), which tracks gold miner stocks, has been up a mere 38%. At the same time, gold has risen over 10x that amount (540%). Miners should provide better returns during gold bull markets as they are leveraged to the price of gold. However, time and time again, we find that faulty management decisions more than offset the benefits of leverage. This is not to say all gold miners underperform or will underperform gold. But choose wisely if you decide to invest in a gold miner over gold.
What To Watch Today
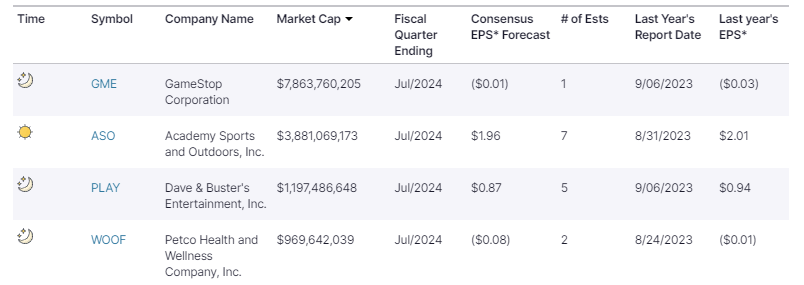
Earnings
Economy
- No notable economic reports today.
Market Trading Update
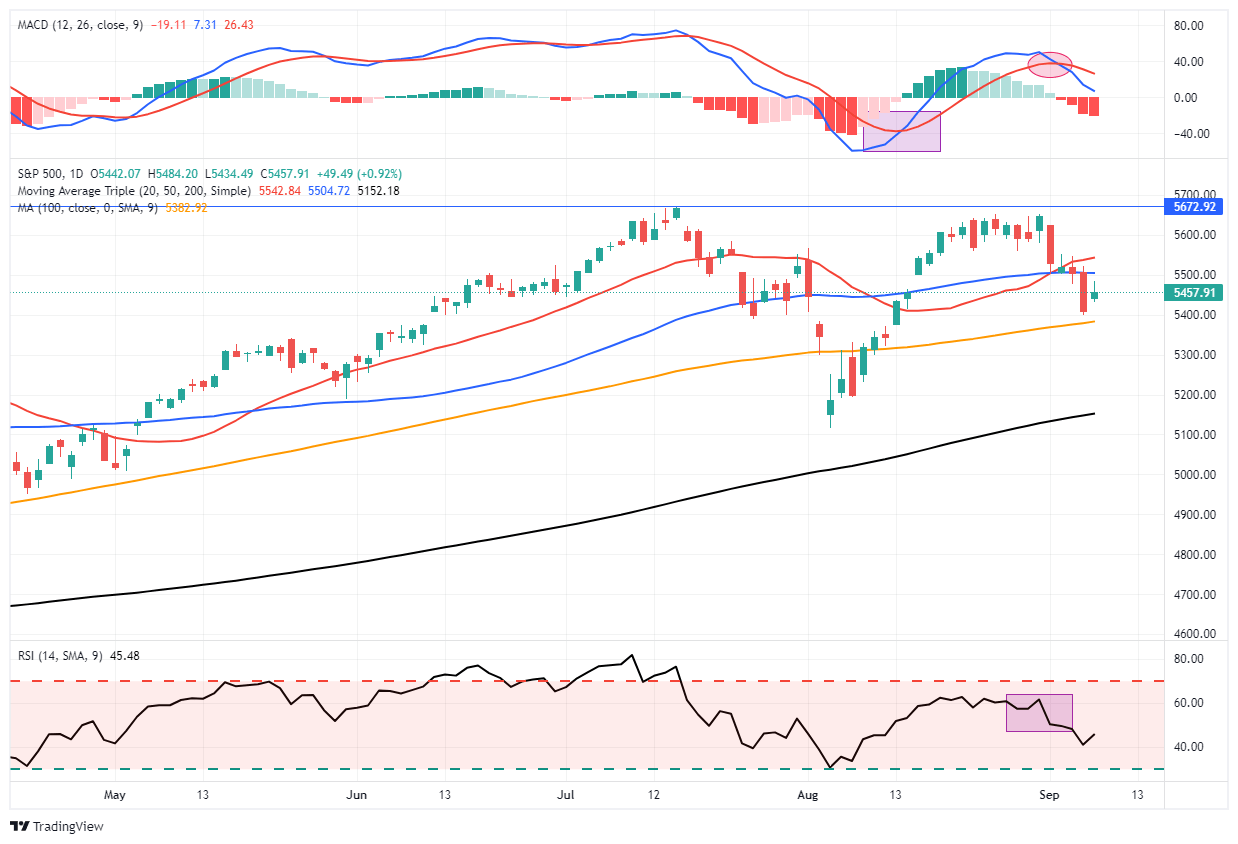
As noted yesterday, the market broke through the 50-DMA on Friday testing initial support at the 100-DMA. The good news is that the market bounced off the initial test of support. The bad news is that the bounce was rather weak, with sellers showing up repeatedly throughout the day knocking down the gains. During a correctional period, as we are in now, bounces tend to be very short-lived as sellers look for an exit.
The good news is that the markets are decently oversold, and a rally to the 50-DMA remains a likely first test. However, there is no guarantee this market will not go lower first, so manage risk accordingly. As is always the case, markets can and do remain overbought or sold for longer than many imagine. Therefore, use rallies opportunistically and take nothing for granted until this correctional process is complete.

Private Jobs Don’t Signal A Recession Yet
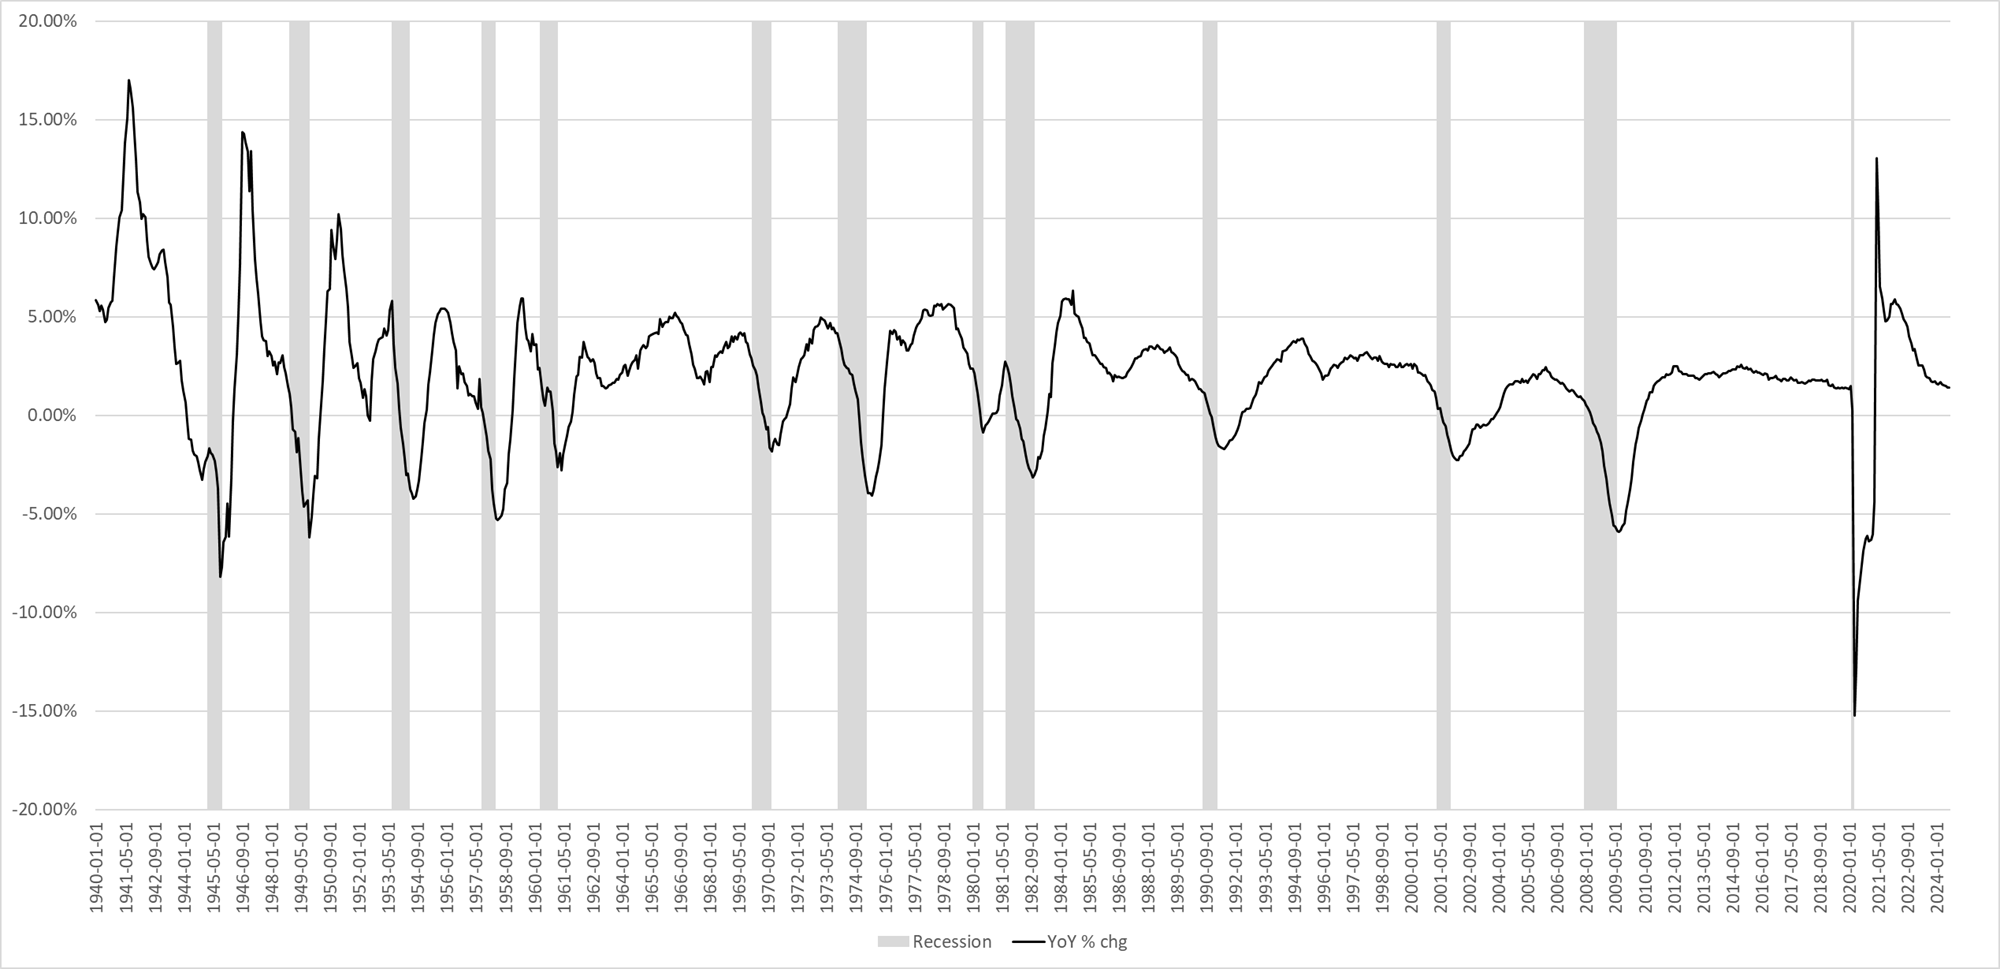
There are many ways to slice and dice the BLS employment report. Most analyses point to a steady weakening of the labor market but not a net loss of jobs and certainly not a recession. One of our clients closely follows economic data and shared with us a unique way to use the BLS report as a potential recession indicator. To wit, he says that every time the year-over-year change in employment was negative for consecutive months, a recession was soon to follow, or the economy was already in a recession.
Currently, as he shows below, the year-over-year rate is still positive. But he warns:
The point being is the recent YoY% change in Private Employment has been decreasing for some time now as shown in the chart below. Currently that annual growth rate is a positive +140 bps. However, this could turn negative in the next couple of months and just something to keep an eye out.
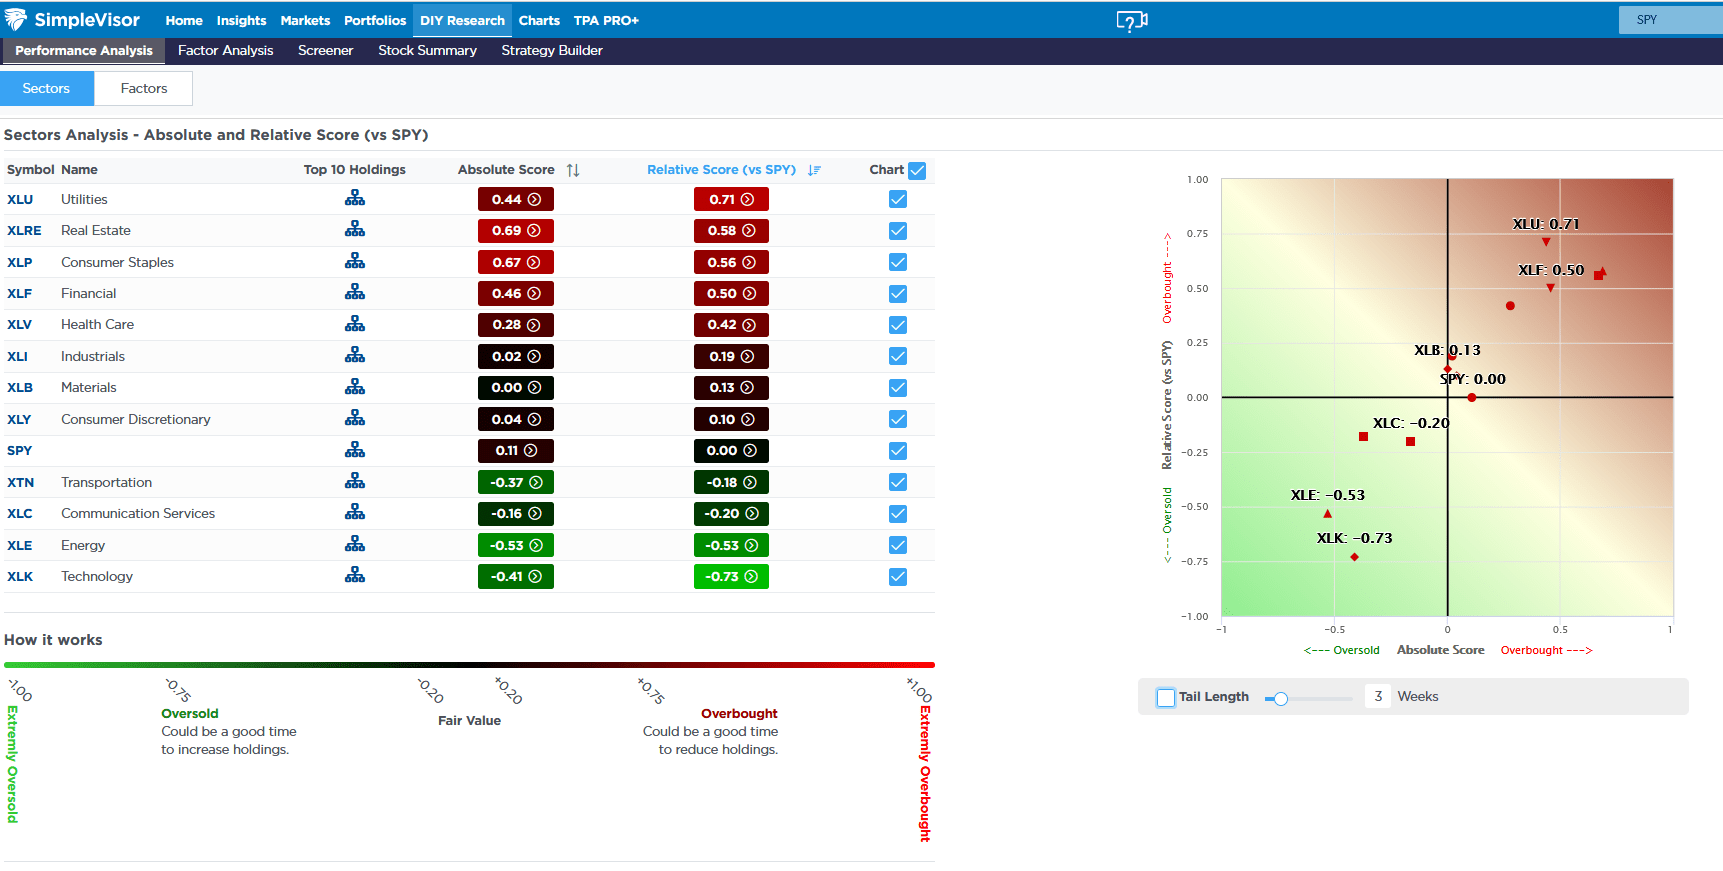
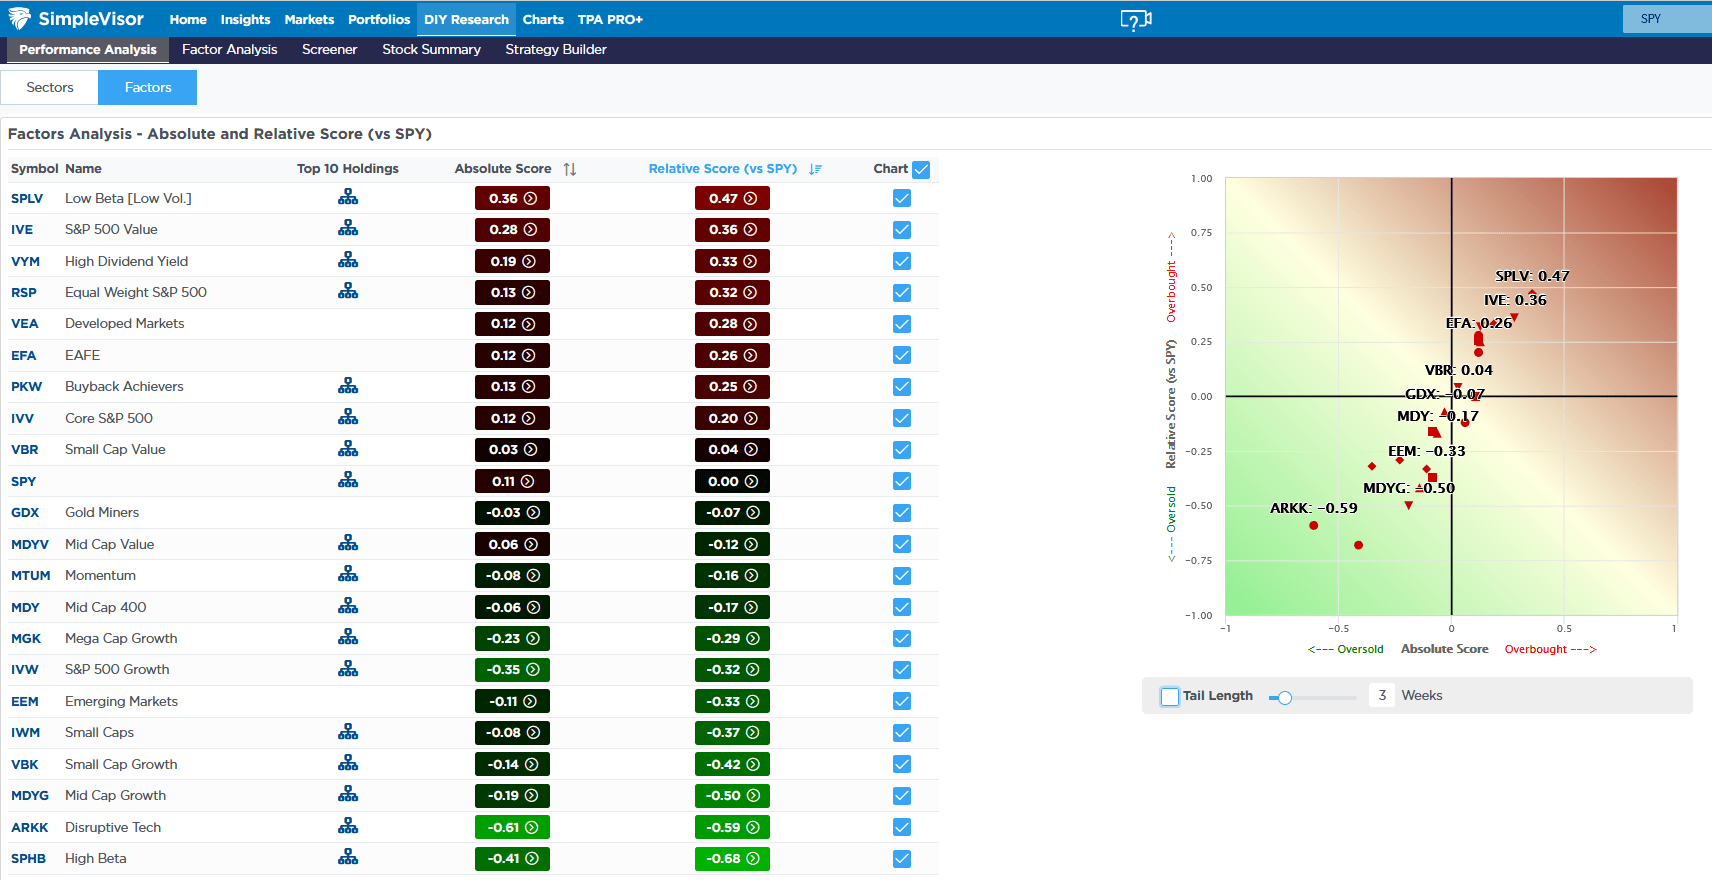
SimpleVisor Weekly Sector And Factor Analysis
The two SimpleVisor tables below show investors are gravitating toward sectors and factors with the least risk and higher dividends. Conversely, higher beta, technology, and growth have been lagging. This shift to safety occurs as the yield curve un-inverts and the Fed is set to embark on a rate-cutting campaign. The market seems to appreciate the slowing economy and is paying attention to some warnings.
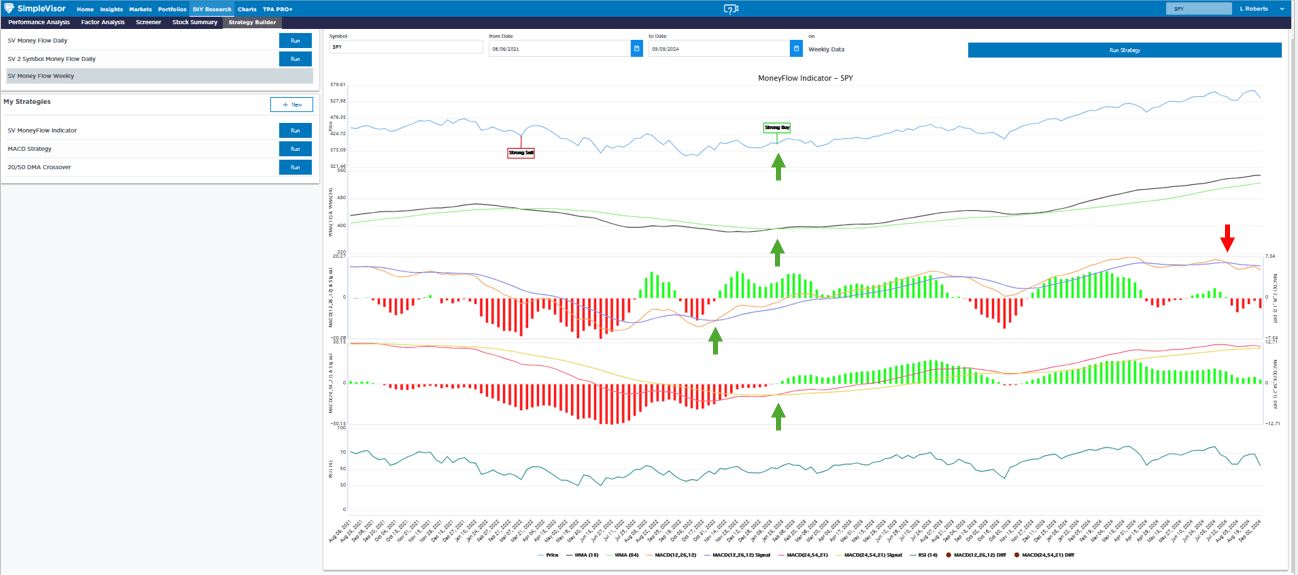
Another warning comes from our weekly SV Money Flow Weekly. This analysis uses weekly data and three indicators to help spot longer-term bullish and bearish trends. To produce a buy or sell signal, all three indicators must confirm a trend change. The green arrows show that the three indicators turned bullish in late 2022 and early 2023. Moreover, the “strong buy” alert was added to the graph when the third indicator flipped bullishly.
Currently, the shorter-term MACD has had a bearish crossing, as shown by the red arrow. However, the other two are still in bullish trends. but the longer-term MACD is very close to turning bearish. The top indicator shows the converging 13- and 34-week moving averages but it could still be weeks or even a month or two from crossing bearishly. It’s important to wait for all three to cross. For example, in late 2023, the lower two indicators crossed, but the 13- and 34-week moving averages didn’t. Thus a sell signal was not generated and after a slight pause the market continued upward.
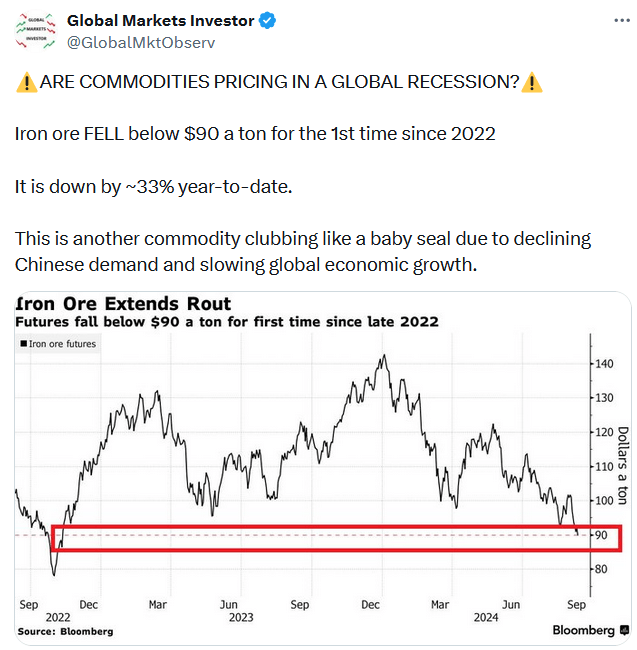
Tweet of the Day
“Want to achieve better long-term success in managing your portfolio? Here are our 15-trading rules for managing market risks.”
Please subscribe to the daily commentary to receive these updates every morning before the opening bell.
If you found this blog useful, please send it to someone else, share it on social media, or contact us to set up a meeting.