


While the WSJ telegraphed the potential for a 75bps rate hike on Tuesday, the Fed’s decision to raise the Fed Funds rate by 75bps to 1.50% at yesterday’s FOMC meeting shocked many investors. 75bps is the largest rate hike since 1994. The Fed now expects to raise Fed Funds by another 2% by year-end. The driving force behind the Fed’s aggressive 75bps rate hike was its upward revision to its year-end inflation (PCE) expectation (from 4.3% to 5.2%).
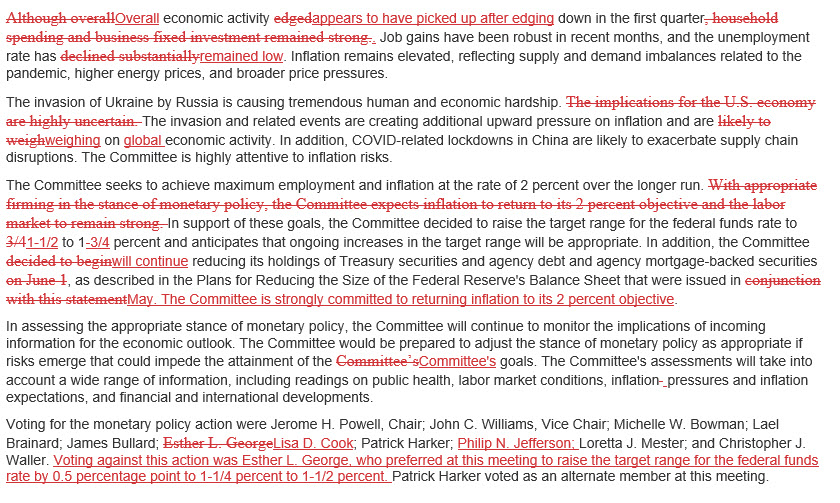
Per the statement: “The Committee is strongly committed to returning inflation to its 2% objective.” The Fed seems to have an optimistic prognosis for economic activity. They said: “Overall economic activity appears to have picked up after edging down in the first quarter.” Paradoxically, the statement came two hours after the Atlanta Fed GDPNow revised its second-quarter growth estimate to 0.0%.
Stocks and bonds took solace in the Fed’s commitment to fighting inflation. The S&P 500 rose about 1.5%, and Treasury bond yields fell by about 20bps. The “red lined” FOMC statement below shows the changes in the Fed’s position since the last meeting.

What To Watch Today
Economy
- 8:30 a.m. ET: Housing Starts, May (1.696 mil expected, 1.724 mil prior, revised to 1.823 mil)
- 8:30 a.m. ET: Building Permits, May (1.780 mil expected, 1.819 mil prior, revised to 1.823 mil)
- 8:30 a.m. ET: Housing Starts, MoM, May (-1.6% expected, -0.2% prior, revised to -3.0%)
- 8:30 a.m. ET: Building Permits, MoM, May (-2.4% expected, -3.2% prior, revised to -3.0%)
- 8:30 a.m. ET: Philadelphia Fed Business Outlook Index, June (5.0 expected, 2.6 prior)
- 8:30 a.m. ET: Initial jobless claims, week ended June 11 (217,000 expected, 229,000 prior)
Earnings
Pre-market
- Kroger (KR) to report adjusted earnings of $1.30 on revenue of $44.09 billion
- Jabil (JBL) to report adjusted earnings of $1.62 on revenue of $8.23 billion
Post-market
- Adobe (ADBE) to report adjusted earnings of $3.31 on revenue of $4.35 billion
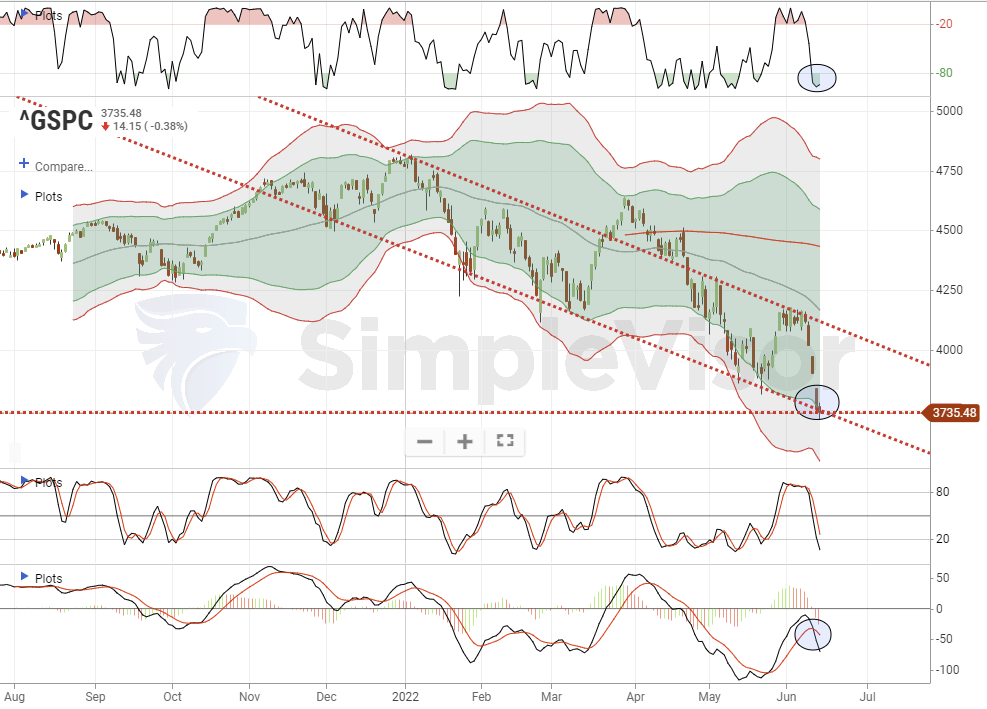
Market Trades On Fed Announcement, Time For A Rally?
Yesterday, the market widely expected the 75bps hike from the Federal Reserve. The waterfall selloff over the last several days was pricing that in. With the rate hike now behind us and the market trading to the bottom of its current downtrend, the question is whether traders can muster a rally. The market is oversold enough to support that, but the MACD has triggered a fresh sell signal.
This morning futures are sharply lower as the reality of a recession is sinking in. However, any rally that does occur will be a “relief rally” to be sold into as there are still many trapped longs looking for an exit, especially after the recent drop. Caution remains advised.
An Earnings Recession Is Coming
We penned an exclusive article for MarketWatch which was published yesterday.
“Of course, since earnings are highly correlated to economic growth, earnings don’t survive rate hikes. As the arrows below show, Fed rate increases consistently lead to earnings recessions.”
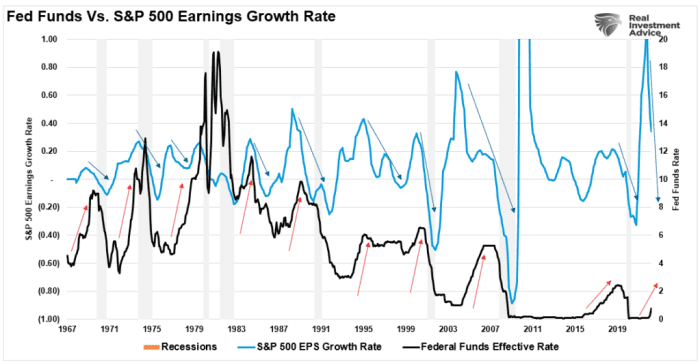
Read the full article here.
The Fed Is Still TOO Optimistic About Economic Growth
The Federal Reserve regularly releases its economic projections for each quarter. The only thing they are good for is to remind ourselves the Federal Reserve members are the worst economic forecasters on the planet. As shown, just since the release of their last projections, their view has dropped sharply. In fact, going back in history, they have never accurately forecasted economic activity since they started this exercise in 2011.
Regardless, their current views of economic growth for the rest of 2022 remain too elevated as a recession quickly approaches.

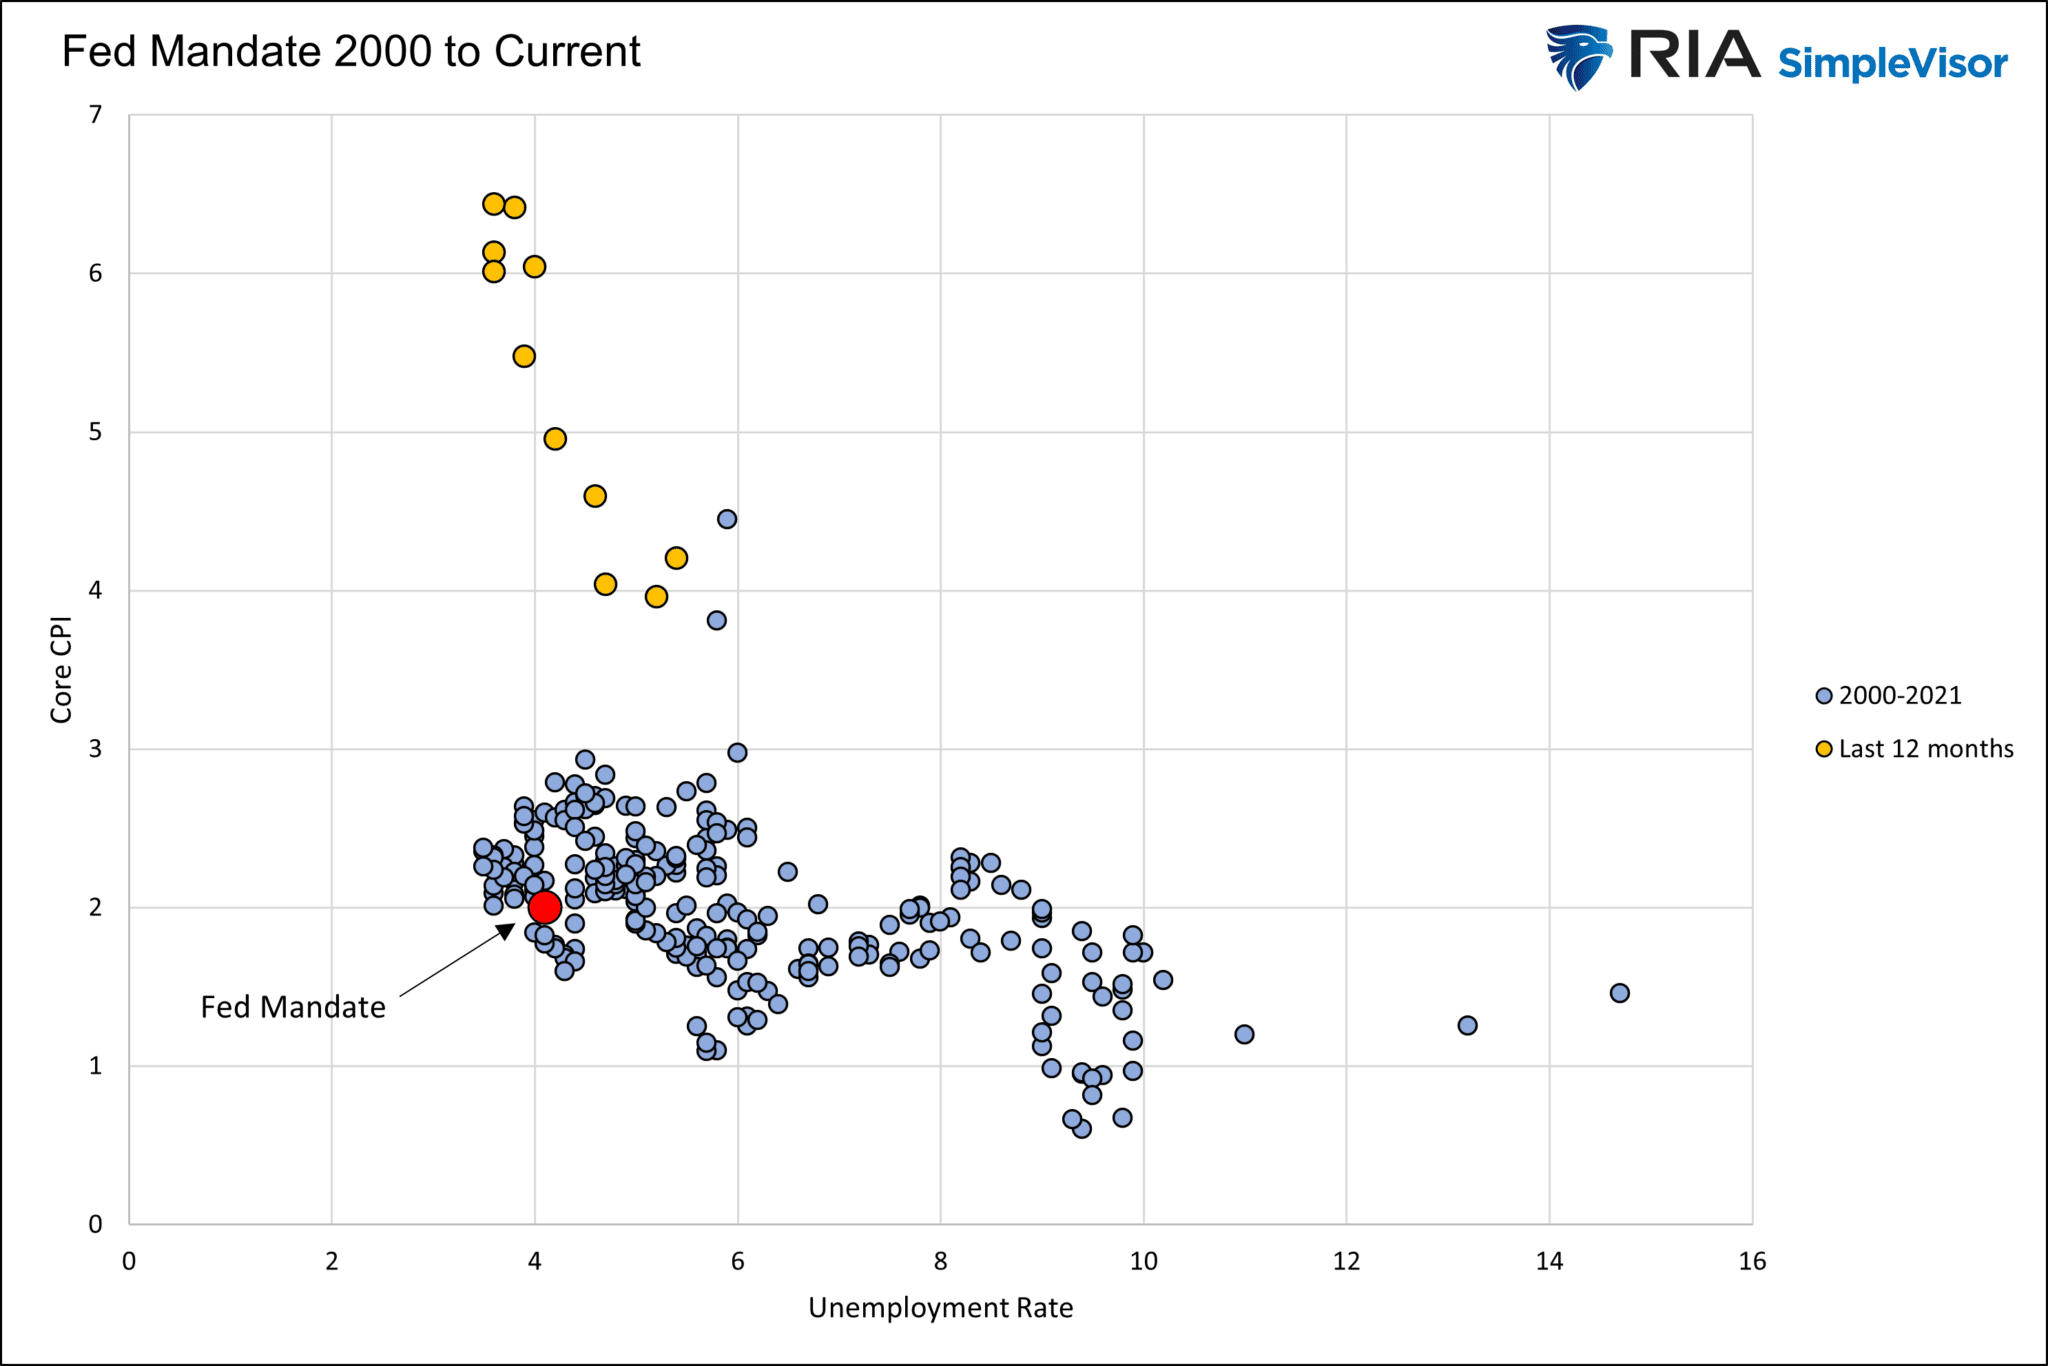
Visualizing The Fed’s Trap
To understand why the Fed hiked by 75bps and plans on continuing aggressive monetary tightening, the graph below helps visualize its problem. Over the last 20 years, the Fed has been predominately focused on maximizing its full employment mandate. They had little need to worry about inflation. That allowed for easy monetary policy more often than not. Today, however, they have the opposite problem. They must sacrifice employment to temper inflation. Such a goal requires hawkish policy. The graph below shows the current situation (yellow dots) is far different than the last 20 years.
Retail Sales, Empire State Index, and Import Prices
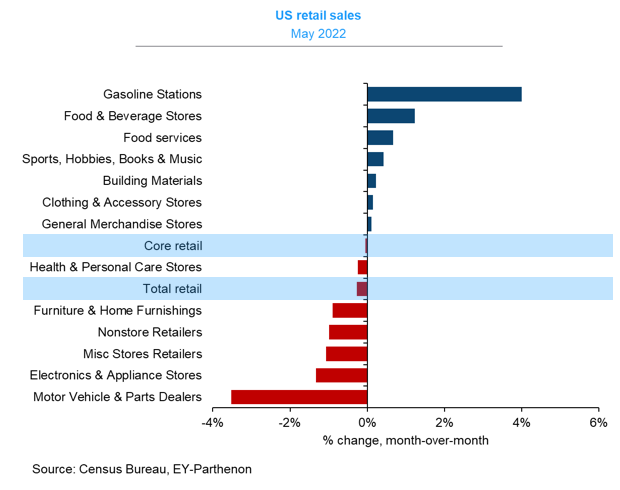
Retail sales were disappointing, coming in at -.3% versus expectations for a slight gain. But, making matters worse, the number is nominal, not inflation-adjusted. CPI was +1% in May, meaning that retail sales fell by 1.3% on an inflation-adjusted basis. The control group retail sales figure, which directly feeds GDP, was flat. The graph below shows that more money is being spent on necessities like gas and food and less on discretionary goods.
The Fed’s Empire State Manufacturing Index remains in economic contraction territory but improved from last month. Yesterday’s negative reading was the fourth this year. While the index is solely for New York, the Fed’s regional indexes have an excellent track record of predicting national economic activity.
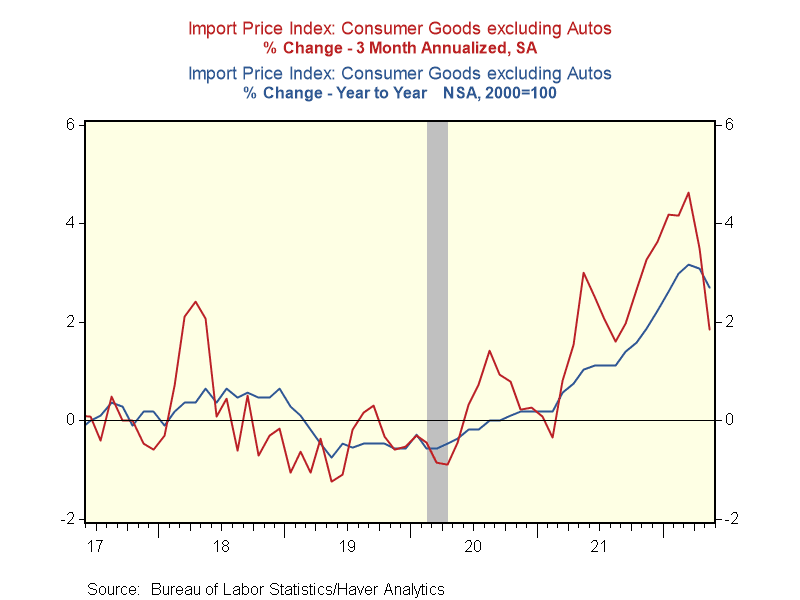
Unlike the Empire Index and Retail Sales, the Import Prices Index provided good news. Import Prices excluding fuel fell by 0.3%. It was the first decline since 2020. As shown below, the 3-month index is falling rapidly, and the year over year is beginning to turn lower. No doubt, dollar strength is helping this price gauge.
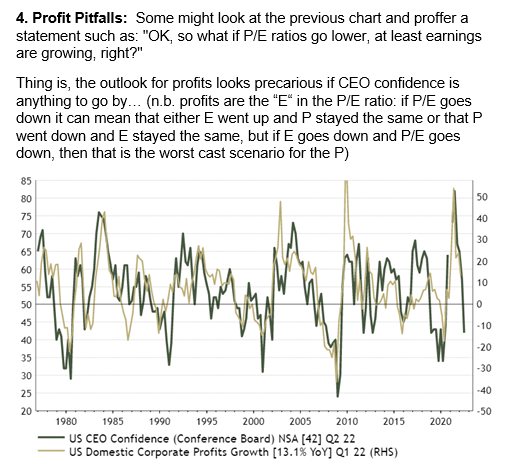
Corporate Profits, Inflation, Confidence, and S&P 2500
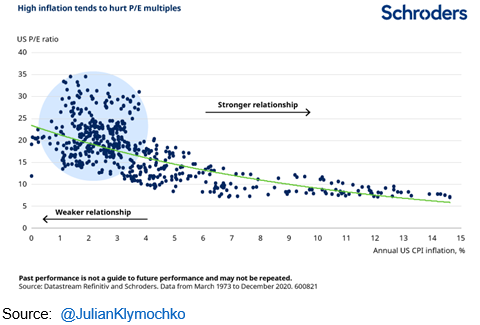
Wall Street has yet to materially downgrade corporate profits forecasts. However, the economy is slowing rapidly, and many personal and business confidence indicators are falling rapidly. The first graph below from Callum Thomas shows the strong correlation between confidence and earnings. His commentary refers to the second chart showing the strong correlation between falling P/E ratios and higher inflation. Putting the graphs together allows us to form expectations on where the S&P 500 might go based on inflation and P/E. The S&P 500’s P/E is approximately 20. If inflation drops to 4%, the P/E ratio falls to 15 (second graph), and earnings fall 10% (first graph), the S&P would need to fall to approximately 2500!
Please subscribe to the daily commentary to receive these updates every morning before the opening bell.
If you found this blog useful, please send it to someone else, share it on social media, or contact us to set up a meeting.
Also Read


