Special Report: Fed Launches A Bazooka As Markets Hit Our Line In The Sand
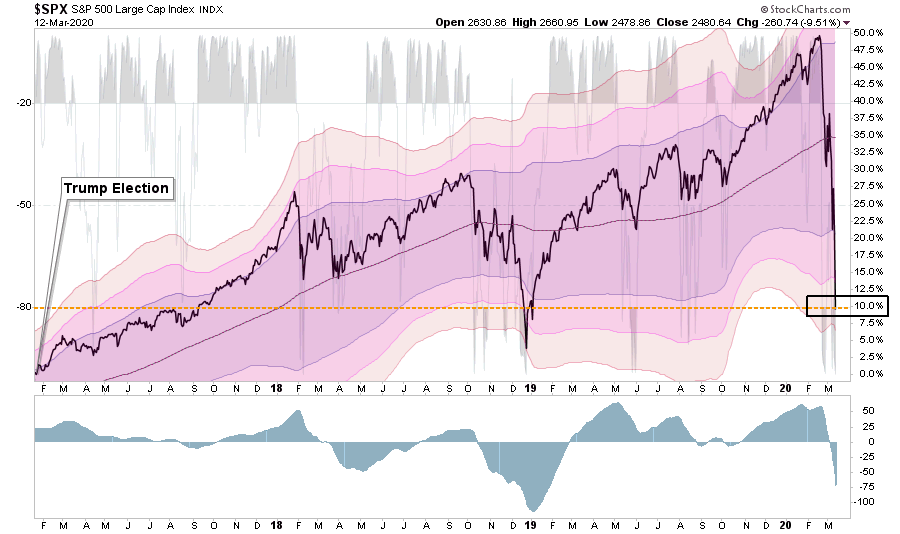
The severity of the recent market rout has been quite astonishing. As shown below, in just three very short weeks, the market has reversed almost the entirety of the “Trump Stock Market” gains.
The decline has been unrelenting, and despite the Fed cutting rates last week, and President Trump discussing fiscal stimulus, the markets haven’t responded. In mid-February we were discussing the markets being 3-standard deviations above their 200-dma which is a rarity. Three short weeks later, the markets are now 4-standard deviations below which is even a rarer event.
On Wednesday, the Federal Reserve increased “Repo operations” to $175 Billion.
Still no response from the market.
Then on Thursday, the Fed brought out their “big gun.”
The Fed Bazooka
Yesterday, the Federal Reserve stepped into financial markets for the second day in a row, this time dramatically ramping up asset purchases amid the turmoil created by the combination of the spreading coronavirus and the collapse in oil prices.
In a statement from the New York Fed:
The Federal Reserve said it would inject more than $1.5 trillion of temporary liquidity into Wall Street on Thursday and Friday to prevent ominous trading conditions from creating a sharper economic contraction.
‘These changes are being made to address highly unusual disruptions in Treasury financing markets associated with the coronavirus outbreak.’
The New York Fed said it would conduct three additional repo offerings worth an additional $1.5 trillion this week, with two separate $500 billion offerings that will last for three months and a third that will mature in one month.
If the transactions are fully subscribed, they would swell the central bank’s $4.2 trillion asset portfolio by more than 35%.” – WSJ
“The Fed can label this however they want, but it’s another round of QE.”
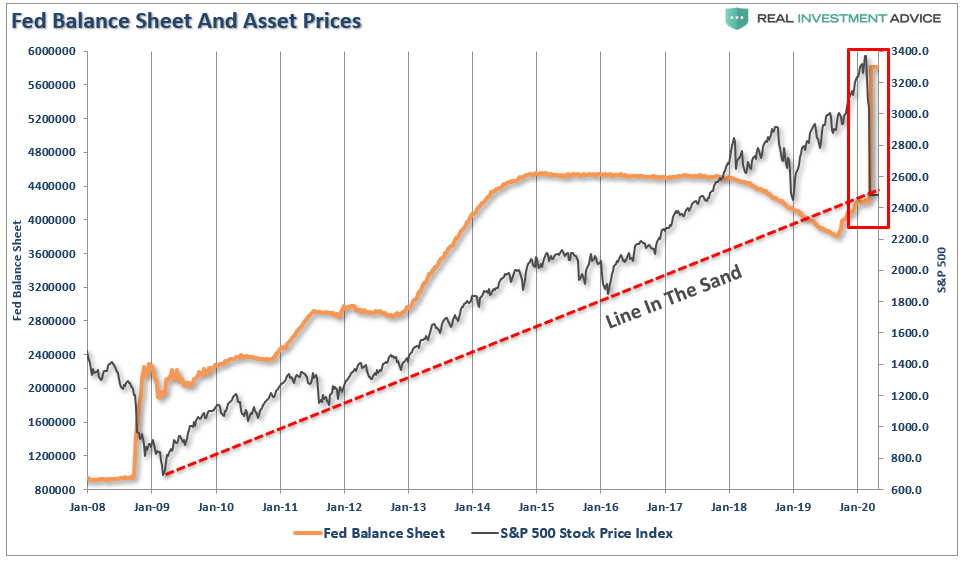
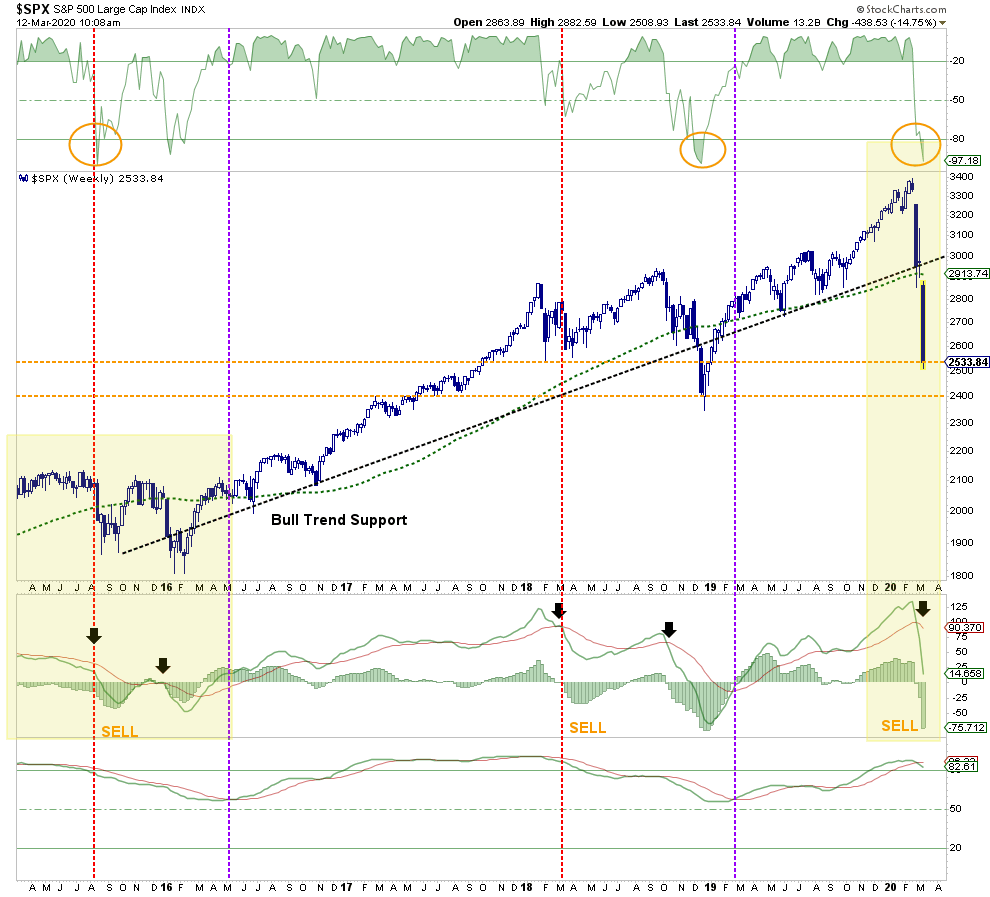
As you can see in the chart below, this is a massive surge of liquidity hitting the market at a time the market is hitting important long-term trend support.
Of course, this is what the market has been hoping for:
Rate cuts? Check
Liquidity? Check
It is now, or never, for the markets.
With our portfolios already at very reduced equity levels, the break of this trendline will take our portfolios to our lowest levels of exposure. However, given the extreme oversold condition, noted above, it is likely we are going to see a bounce, which we will use to reduce risk into.
What happened today was an event we have been worried about, but didn’t expect to see until after a break of the trendline – “margin calls.”
This is why we saw outsized selling in “safe assets” such as REITs, utilities, bonds, and gold.
Cash was the only safe place to hide.
This also explains why the market “failed to rally” when the Fed announced $500 billion today. There is another $500 billion coming tomorrow. We will see what happens.
We aren’t anxious to “fight the Fed,” but the markets may have a different view this time.
Use rallies to raise cash, and rebalance portfolio risk accordingly.
We are looking to be heavy buyers of equities when the market forms a bottom, we just aren’t there as of yet.
Special Report: Panic Sets In As “Everything Must Go”
Note: All charts now updated for this mornings open.
It has, been a heck of a couple of weeks for the market with daily point swings running 1000, or more, points in either direction.
However, given Tuesday’s huge rally, it seemed as if the market’s recent rout might be over with the bulls set to take charge? Unfortunately, as with the two-previous 1000+ point rallies, the bulls couldn’t maintain their stand.
But with the markets having now triggered a 20% decline, ending the “bull market,” according to the media, is all “hope” now lost? Is the market now like an “Oriental Rug Factory” where “Everything Must Go?”
It certainly feels that way at the moment.
“Virus fears” have run amok with major sporting events playing to empty crowds, the Houston Live Stock Show & Rodeo was canceled, along with Coachella, and numerous conferences and conventions from Las Vegas to New York. If that wasn’t bad enough, Saudi Arabia thought they would start an “oil price” war just to make things interesting.
What is happening now, and what we have warned about for some time, is that markets needed to reprice valuations for a reduction in economic growth and earnings.
It has just been a much quicker, and brutal, event than even we anticipated.
The questions to answer now are:
Are we going to get a bounce to sell into?
Is the bear market officially started – from a change in trend basis; and,
Just how bad could this get?
A Bounce Is Likely
In January, when we discussed taking profits out of our portfolios, we noted the markets were trading at 3-standard deviations above their 200-dma, which suggested a pullback, or correction, was likely.
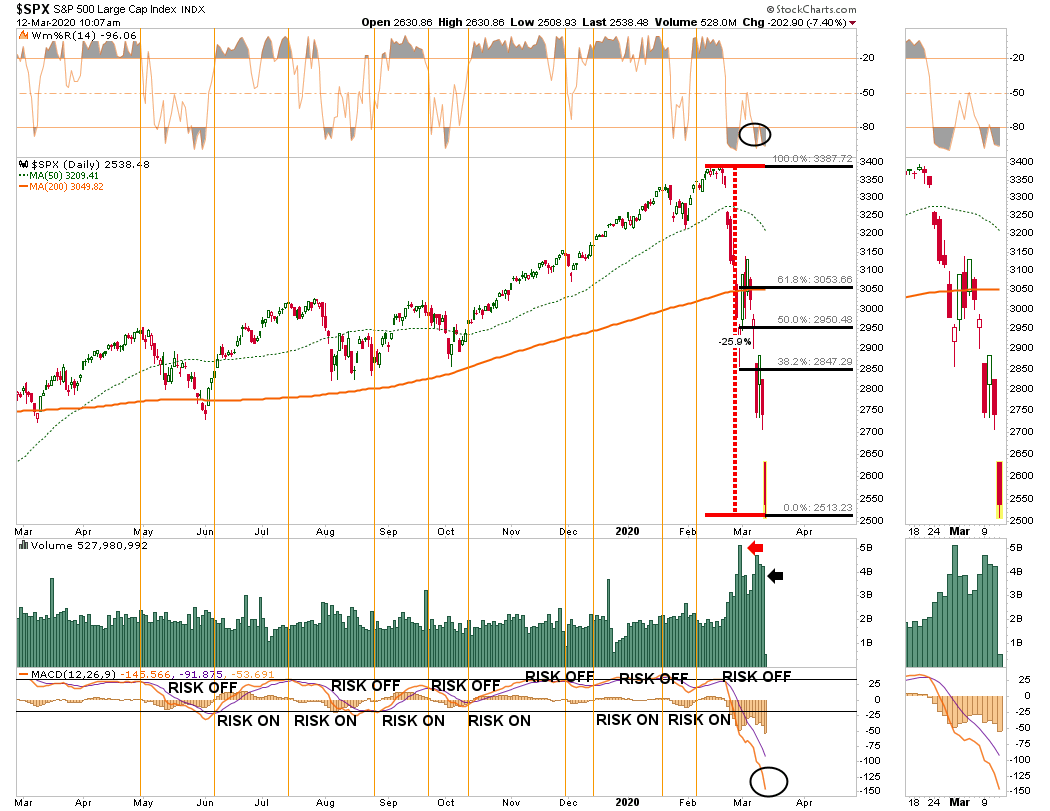
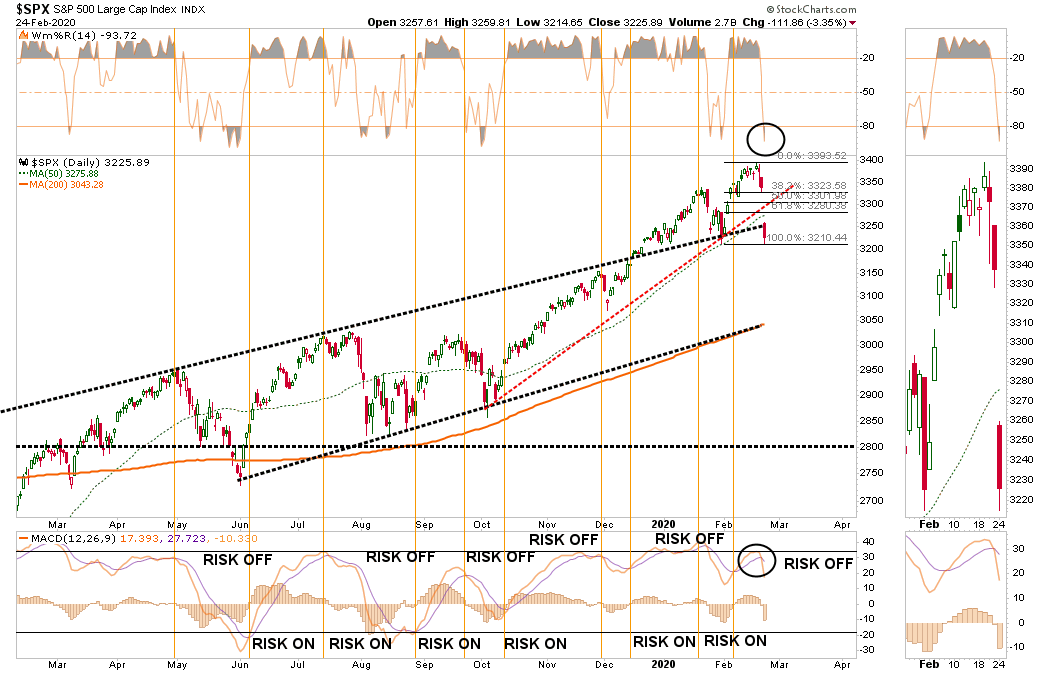
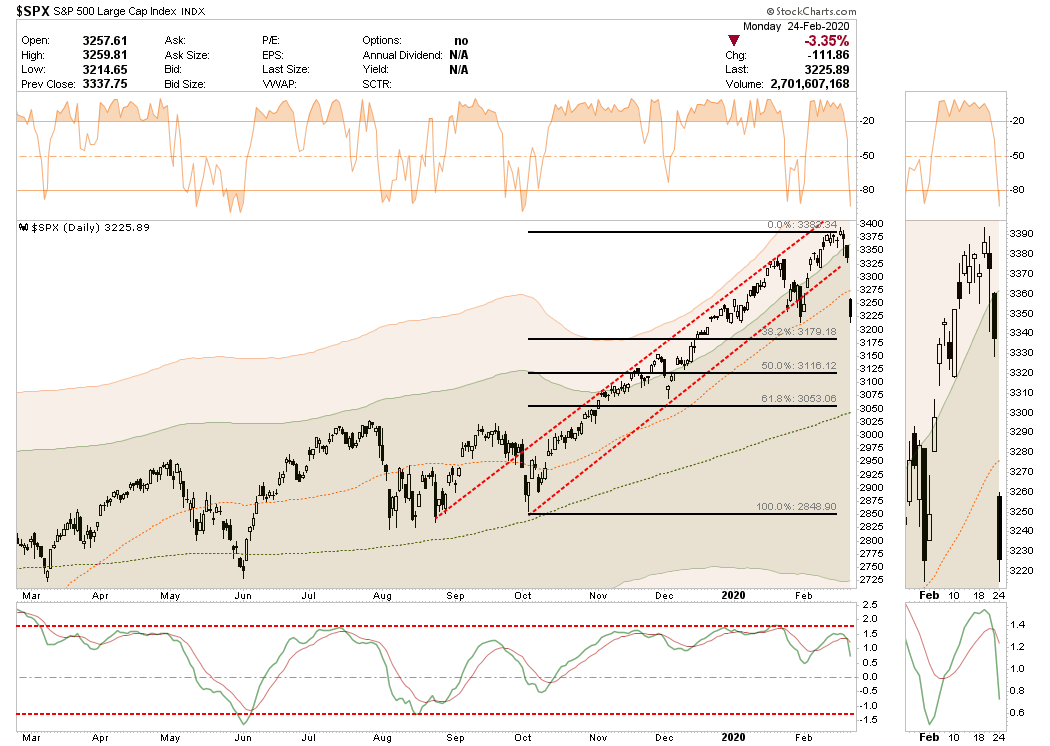
Now, it is the same comment in reverse. The correction over the last couple of weeks has completely reversed the previous bullish exuberance into extreme pessimism. On a daily basis, the market is back to oversold. Historically, this condition has been sufficient for a bounce. Given that the oversold condition (top panel) is combined with a very deep “sell signal” in the bottom panel, it suggests a fairly vicious reflexive rally is likely. The question, of course, is how far could this rally go.
Looking at the chart above, it is possible we could see a rally back to the 38.2%, or the 50% retracement level is the most probable. However, with the severity of the break below the 200-dma, that level will be very formidable resistance going forward. A rally to that level will likely reverse much of the current oversold condition, and set the market up for a retest of the lows.
The deep deviation from the 200-dma also supports this idea of a stronger reflexive rally. If we rework the analysis a bit, the 3-standard deviation discussed previously has now reverted to 4-standard deviation move below the 200-dma. The market may find support there, and with the deeply oversold condition, it again suggests a rally is likely.
Given that rally could be sharp, it will be a good opportunity to reduce risk as the impact from the collapse in oil prices, and the shutdown of the global supply chain, has not been fully factored in as of yet.
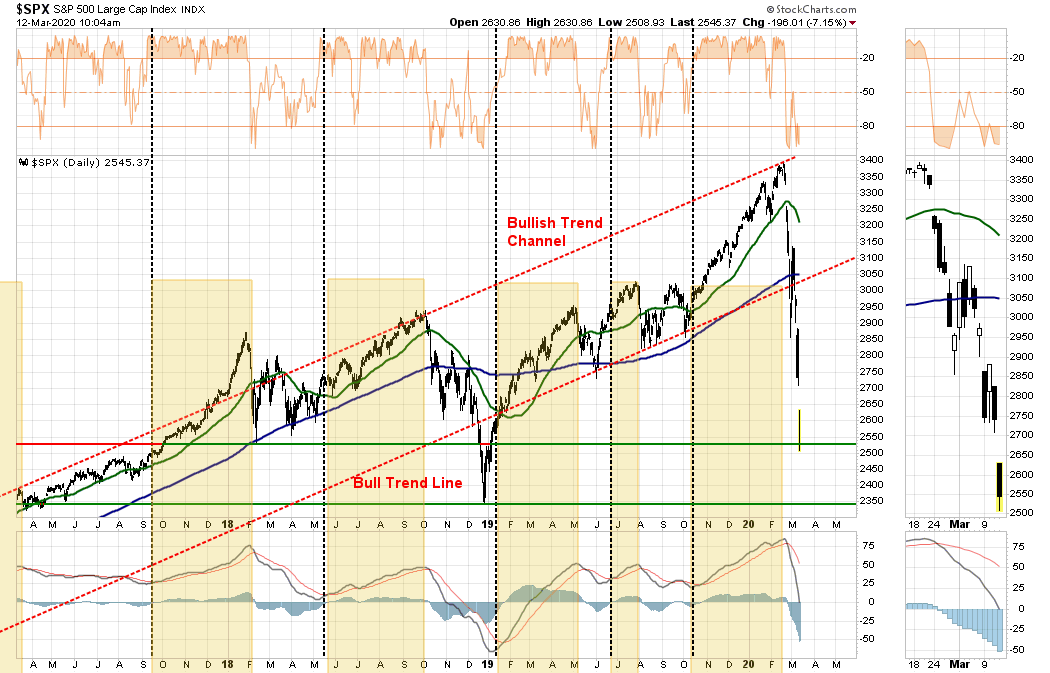
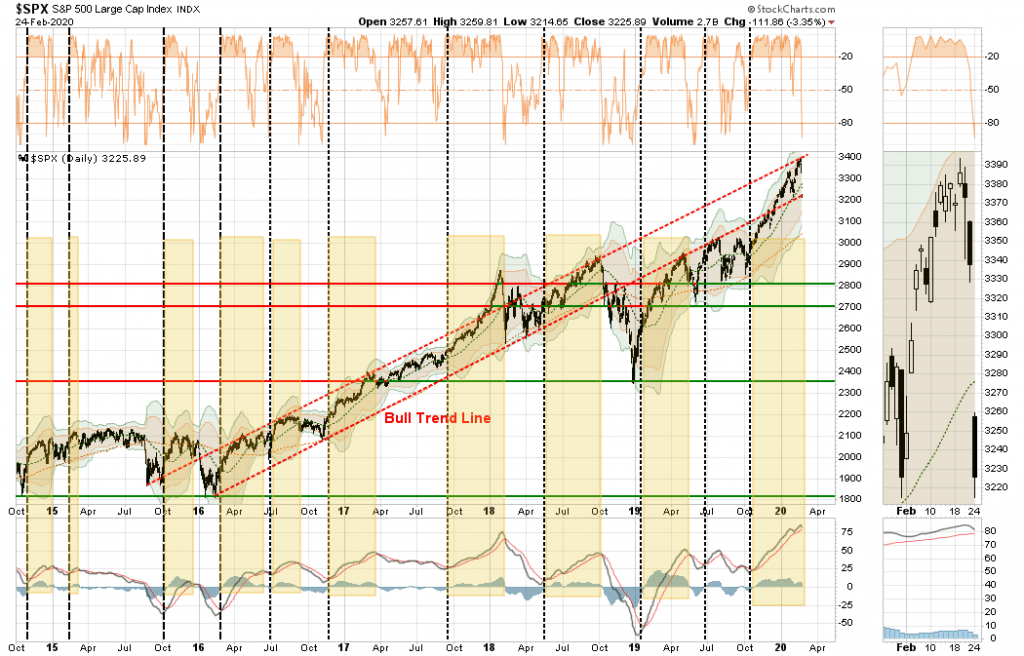
The following chart is a longer-term analysis of the market and is the format we use for “onboarding” our clients into their allocation models. (Vertical black lines are buy periods)
The triggering of the “sell signals” suggests we are likely in a larger correction process. With the “bull trend” line now broken, a rally toward the 200-dma, which is coincident with the bull trend line, will likely be an area to take additional profits, and reduce risk accordingly.
The analysis becomes more concerning as we view other time frames.
Has A Bear Market Started?
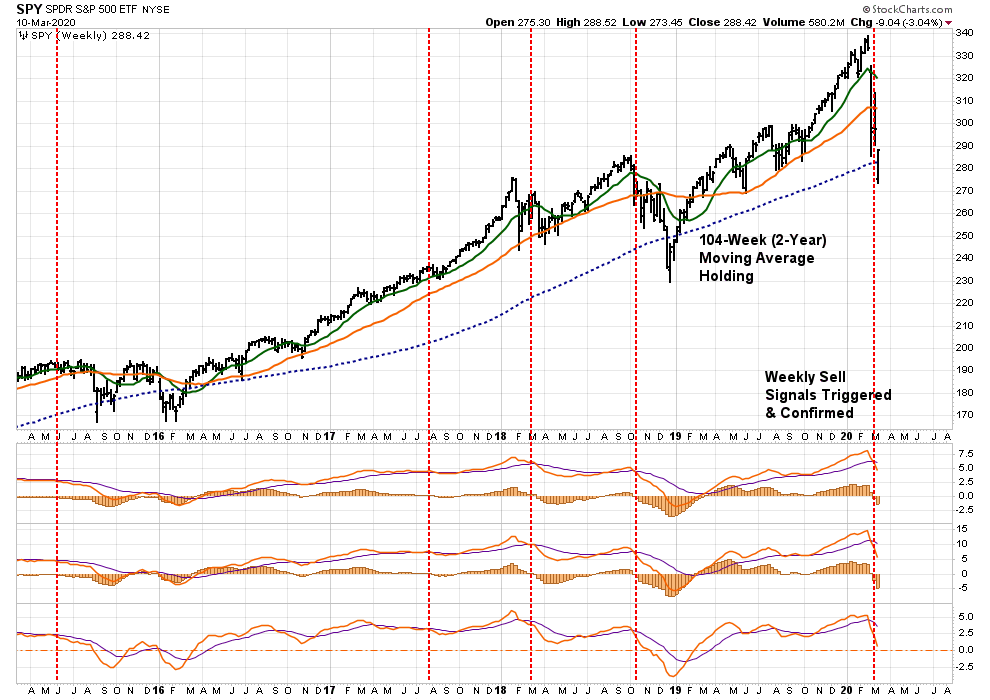
On a weekly basis, the rising trend from the 2016 lows is clear. The market has NOW VIOLATED that trend, which suggests a “bear market” has indeed started. This means investors should consider maintaining increased cash allocations in portfolios currently. With the two longer-term sell signals, bottom panels, now triggered, it suggests that whatever rally may ensue short-term will likely most likely fail. (Also a classic sign of a bear market.)
With the market oversold on a weekly basis, a counter-trend, or “bear market” rally is likely. However, as stated, short-term rallies should be sold into, and portfolios hedged, until the correction process is complete.
With all of our longer-term weekly “sell signals” now triggered from fairly high levels, it suggests the current selloff is much like what we saw in 2015-2016. (Noted in the chart above as well.) In other words, we will see a rally, followed by a secondary failure to lower lows, before the ultimate bottom is put in. If the market fails to hold current levels, the 2018 lows are the next most likely target.
Just How Bad Can It Get?
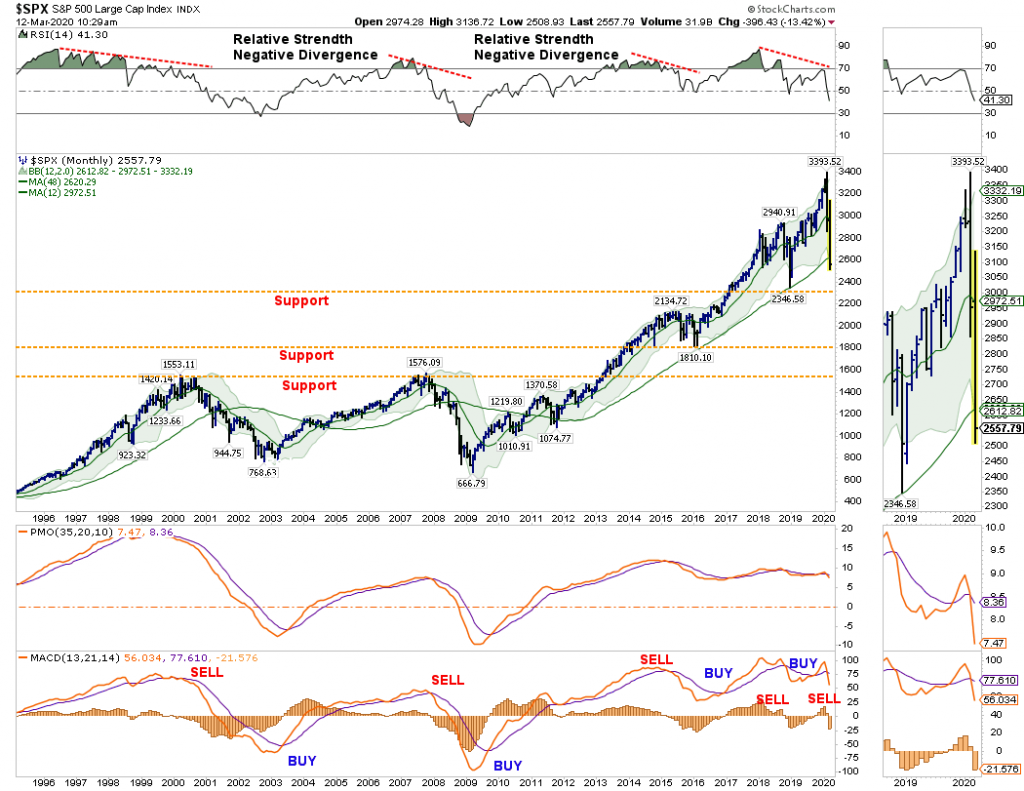
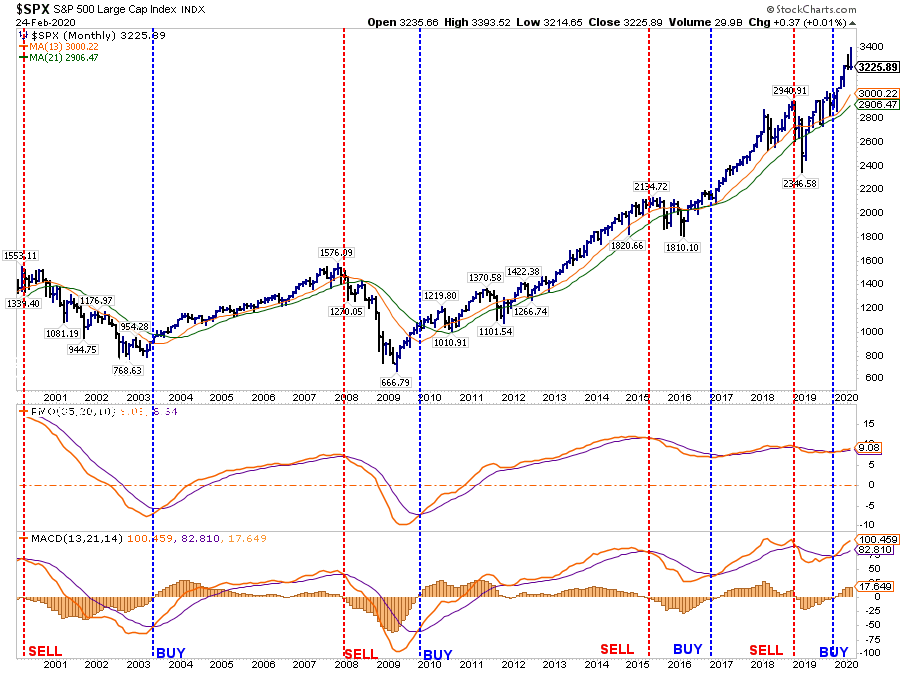
The idea of a lower bottom is also supported by the monthly data.
NOTE: Monthly Signals Are ONLY Valid At The End Of The Month.
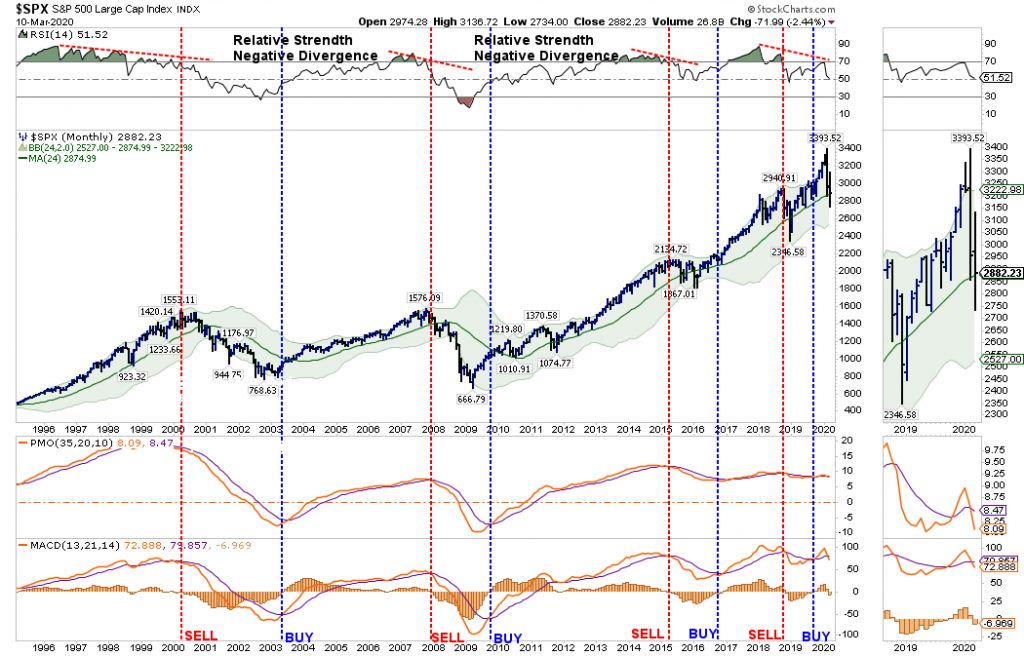
On a monthly basis, sell signals have also been triggered, but we will have to wait until the end of the month for confirmation. However, given the depth of the decline, it would likely take a rally back to all-time highs to reverse those signals. This is a very high improbability.
Assuming the signals remain, there is an important message being sent, as noted in the top panel. The “negative divergence” of relative strength has only been seen prior to the start of the previous two bear markets, and the 2015-2016 slog. While the current sell-off resembles what we saw in late 2015, there is a risk of this developing into a recessionary bear market later this summer. The market is very close to violating the 4-year moving average, which is a “make or break” for the bull market trend from the 2009 lows.
How bad can the “bear market” get? If the 4-year moving average is violated, the 2018 lows become an initial target, which is roughly a 30% decline from the peak. However, the 2016 lows also become a reasonable probability if a “credit event” develops in the energy market which spreads across the financial complex. Such a decline would push markets down by almost 50% from the recent peak, and not unlike what we saw during the previous two recessions.
Caution is advised.
What We Are Thinking
Since January, we have been regularly discussing taking profits in positions, rebalancing portfolio risks, and, most recently, moving out of areas subject to slower economic growth, supply-chain shutdowns, and the collapse in energy prices. This led us to eliminate all holdings in international, emerging markets, small-cap, mid-cap, financials, transportation, industrials, materials, and energy markets.(RIAPRO Subscribers were notified real-time of changes to our portfolios.)
While there is “some truth” to the statement “that no one” could have seen the fallout of the “coronavirus” being escalated by an “oil price” war, there has been mounting risks for quite some time from valuations, to price deviations, and a complete disregard of risk by investors. While we have been discussing these issues with you, and making you aware of the risks, it was often deemed as “just being bearish” in the midst of a “bullish rally.”However, it is managing these types of risks, which is ultimately what clients pay advisors for.
It isn’t a perfect science. In times like these, it gets downright messy. But this is where working to preserve capital and limit drawdowns becomes most important. Not just from reducing the recovery time back to breakeven, but in also reducing the “psychological stress” which leads individuals to make poor investment decisions over time.
Given the extreme oversold and deviated measures of current market prices, we are looking for a reflexive rally that we can further reduce risk into, add hedges, and stabilize portfolios for the duration of the correction. When it is clear, the correction, or worse a bear market, is complete, we will reallocate capital back to equities at better risk/reward measures.
We highly suspect that we have seen the highs for the year. Most likely,,we are moving into an environment where portfolio management will be more tactical in nature, versus buying and holding. In other words, it is quite probable that “passive investing” will give way to “active management.”
Given we are longer-term investors, we like the companies we own from a fundamental perspective and will continue to take profits and resize positions as we adjust market exposure accordingly. The biggest challenge coming is what to do with our bond exposures now that rates have gotten so low OUTSIDE of a recession.
But that is an article for another day.
As we have often stated, “risk happens fast.”
Special Report: S&P 500 – Bounce Or Bull Market
Headlines from the past two days:
Dow sinks 2,000 points in worst day since 2008, S&P 500 drops more than 7%
Dow rallies more than 1,100 points in a wild session, halves losses from Monday’s sell-off
Actually its been a heck of a couple of weeks for the market with daily point swings running 1000, or more, points in either direction.
However, given Tuesday’s huge rally, is the market’s recent rout over with the bulls set to take charge? Or is this just a reflexive rally, with a retest of lows set to come?
Let’s take a look at charts to see what we can determine.
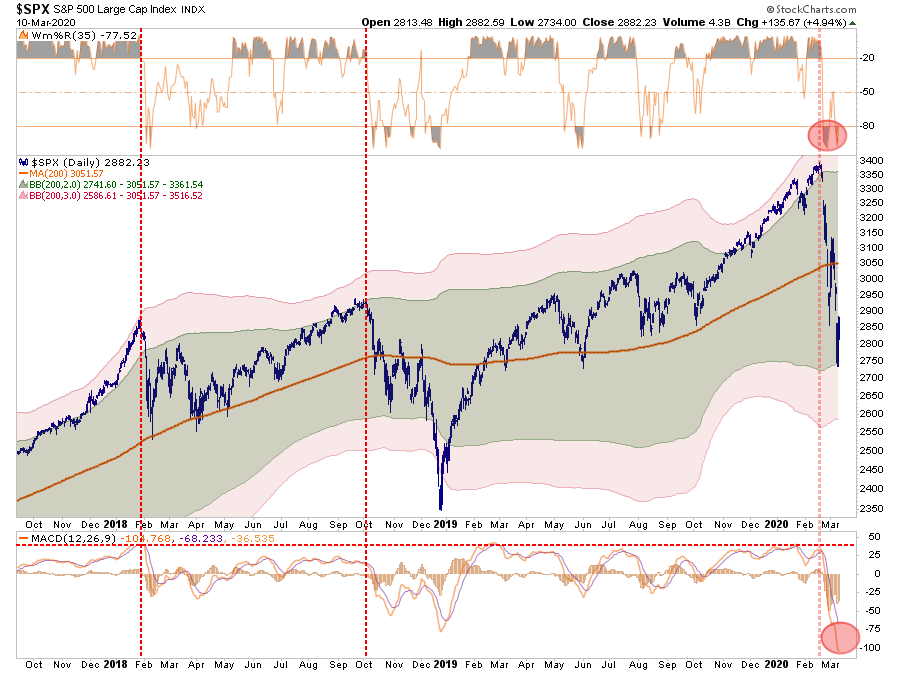
Daily
On a daily basis, the market is back to oversold. Historically, this condition has been sufficient for a bounce. Given that the oversold condition (top panel) is combined with a very deep “sell signal” in the bottom panel, it suggested a fairly vicious reflexive rally was likely. The question, of course is how far could this rally go.
Looking at the chart above, it is quite possible we could well see a rally back to the 32.8%, or even the 50% retracement level which is where the 200-dma currently resides. A rally to that level will likely reverse much of the current oversold condition and set the market up for a retest of the lows.
This idea of a stronger reflexive rally is also supported by the deep deviation from the 200-dma. If we rework the analysis a bit, the 3-standard deviation discussed previously has now reverted to 2-standard deviations below the 200-dma. The market found support there, and with the deep oversold condition it again suggests a rally to the 200-dma is likely.
Given that rally could be sharp, it will likely be a good opportunity to reduce risk as the impact from the collapse in oil prices and the shutdown of the global supply chain has not been fully factored in as of yet.
The following chart is a longer-term analysis of the market and is the format we use for “onboarding” our clients into their allocation models. (Vertical black lines are buy periods)
The triggering of the “sell signals” suggests we are likely in a larger correction process. With the “bull trend” line now broken, a rally back to toward the 200-dma, which is coincident with the bull trend line, will likely be an area to take profits and reduce risk accordingly.
The analysis becomes more concerning as we view other time frames.
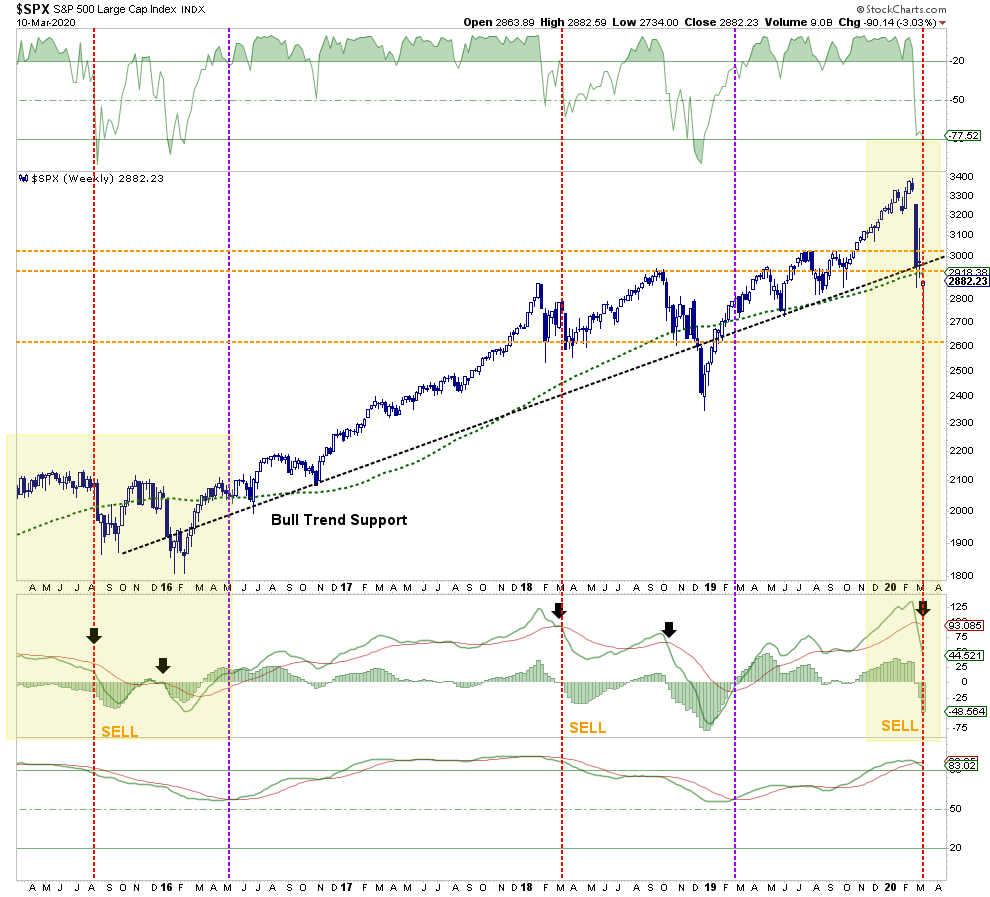
Weekly
On a weekly basis, the rising trend from the 2016 lows is clear. The market has NOW VIOLATED that trend, which suggests maintaining some allocation to cash in portfolios currently. With the two longer-term sell signals, bottom panels, now triggered, it suggests that whatever rally may ensue short-term will likely fail.
The market is getting oversold on a weekly basis which does suggest a counter-trend rally is likely. However, as stated, short-term rallies should likely be sold into, and portfolios hedged, until the correction process is complete.
With all of our longer-term weekly “sell signals” now triggered from fairly high levels, it suggests the current selloff is much like what we saw in 2015-2016. (Noted in chart above as well.) In other words, we will see a rally, a failure to lower lows, before the ultimate bottom is put in.
Monthly
The idea of a lower bottom is also supported by the monthly data.
On a monthly basis, sell signals have also been triggered. HOWEVER, these signals must remain through the end of the month to be valid. These monthly signals are “important,” and one of the biggest concerns, as noted in the top panel, is the “negative divergence” of relative strength which was only seen prior to the start of the previous two bear markets, and the 2015-2016 slog. Again, the current sell-off resembles what we saw in late 2015, but there is a risk of this developing into a recessionary bear market later this summer. Caution is advised.
What We Are Thinking
Since January we have been taking profits in positions, rebalancing portfolio risks, and recently moving out of areas subject to slower economic growth, a supply-chain shut down, and the collapse in energy prices. (We have no holdings in international, emerging markets, small-cap, mid-cap, financial or energy currently.)
We are looking for a rally that can hold for more than one day to add some trading exposure for a move back to initial resistance levels where we will once again remove those trades and add short-hedges to the portfolio.
We highly suspect that we have seen the highs for the year, so we will likely move more into a trading environment in portfolios to add some returns while we maintain our longer-term holdings and hedges.
Given we are longer-term investors, we like the companies we own from a fundamental perspective and will continue to take profits and resize positions as we adjust market exposure accordingly. The biggest challenge coming is what to do with our bond exposures now that rates have gotten so low OUTSIDE of a recession.
We will keep you updated accordingly.
Special Report: S&P 500 Plunges On Coronavirus Impact
Dow plunges 1,000 points on coronavirus fears, 3.5% drop is worst in two years
“Stocks fell sharply on Monday as the number of coronavirus cases outside China surged, stoking fears of a prolonged global economic slowdown from the virus spreading.“ – CNBC
According to CNBC’s logic, the economy was perfectly fine on Friday, even though the market sold off then as well. However, over the weekend, stocks are plunging because the virus is now important?
No, this has been a correction in the making for the past several weeks that we have been discussing in our weekly market updates. Here was whatwe posted yesterday morning:
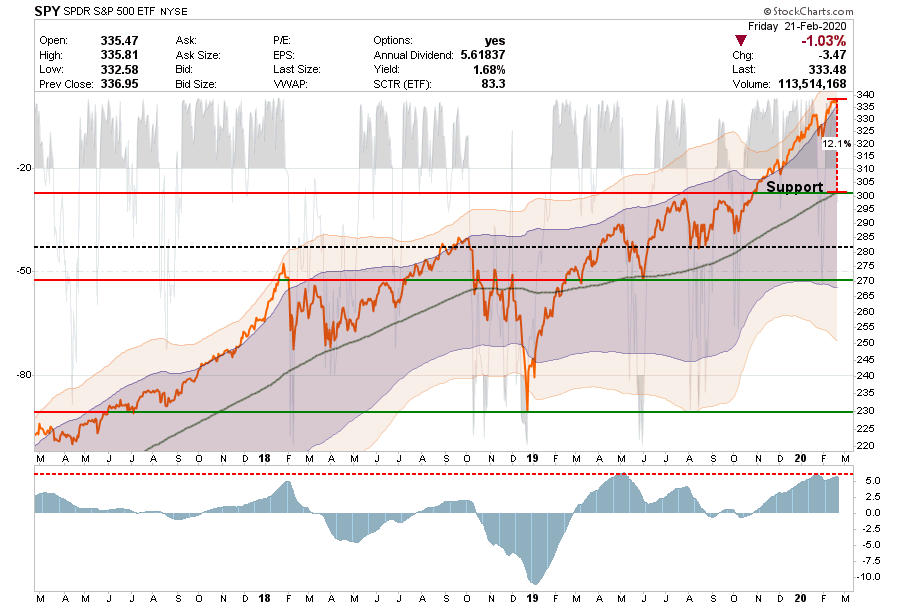
As noted last week: “With the market now trading 12% above its 200-dma, and well into 3-standard deviations of the mean, a correction is coming.” That correction started last Friday.
Currently, there is a strong bias to “buy the dip” of every corrective action. We recognize this and given the S&P 500 hit initial support on Friday we did add 1/2 position of VOOG to the Dynamic Model. The model is underallocated to equities and has a short hedge so we are taking this opportunity to add slowly. However, we suspect there is more to this corrective action to come this week.
As noted previously, extensions to this degree rarely last long without a correction. There is more work to be done before the overbought and extended condition is corrected. We will look to add to our holdings during that process.
While the correction occurred all in one day, which wasn’t our preference, it nonetheless set the markets up for a short-term bounce. We highly suggest using that bounce to rebalance portfolio risks accordingly.
Daily
On a daily basis, the market is back to oversold. Historically, this condition has been sufficient for a bounce. The difference, however, is the current oversold condition (top panel) is combined with a “sell signal” in the bottom panel. This suggests that any rally in the markets over the next few days should be used to reduce equity risk, raise cash, and add hedges.
If we rework the analysis a bit, the 3-standard deviation discussed previously is in the correction process. However, with the break of the 50-dma, uptrend channel, and triggering a short-term sell signal, the 200-dma comes into focus as important support.
As with the chart above, the market is oversold on a short-term basis, and a rally from current support back to the 50-dma is quite likely.
Again, that rally should be used to reduce risk.
The following chart is a longer-term analysis of the market and is the format we use for “onboarding” our clients into their allocation models. (Vertical black lines are buy periods)
Notice that while the market has been rising since early 2016, the momentum indicators are extremely stretched. Historically, such divergences result in markedly lower asset prices. In the short-term, as noted above, the market remains confined to a rising trend which is denoted by the trend channel. At this juncture, the market has not violated any major support points and does not currently warrant a drastically lower exposure to risk. However, if the “sell signals” are triggered, it will suggest a larger “reduction” of risk.
The analysis becomes more concerning as view other time frames.
Weekly
On a weekly basis, the rising trend from the 2016 lows is clear. The market has not violated that trend currently, which suggests maintaining some allocation to equity risk in portfolios currently. However, the two longer-term sell signals, bottom panels, are closing. If they both confirm, it will suggest a more significant correction process is forming.
The market is still very overbought on a weekly basis which confirms the analysis above that short-term rallies should likely be sold into, and portfolios hedged, until the correction process is complete.
Monthly
On a monthly basis, the bulls remain in control currently, which keeps our portfolios primarily allocated to equity risk. As we have noted previously, the market had triggered a “buy” signal in October of last year as the Fed “repo” operations went into overdrive. These monthly signals are “important,” but it won’t take a tremendous decline to reverse those signals. It’s okay to remain optimistic short-term, just don’t be complacent.
Don’t Panic Sell
The purpose of the analysis above is to provide you with the information to make educated guesses about the “probabilities” versus the “possibilities” of what could occur in the markets over the months ahead.
It is absolutely “possible” the markets could find a reason to rally back to all-time highs and continue the bullish trend. (For us, such would be the easiest and best outcome.)
However, the analysis currently suggests the risks currently outweigh potential reward and a deeper correction is the most “probable” at this juncture.
Don’t take that statement lightly.
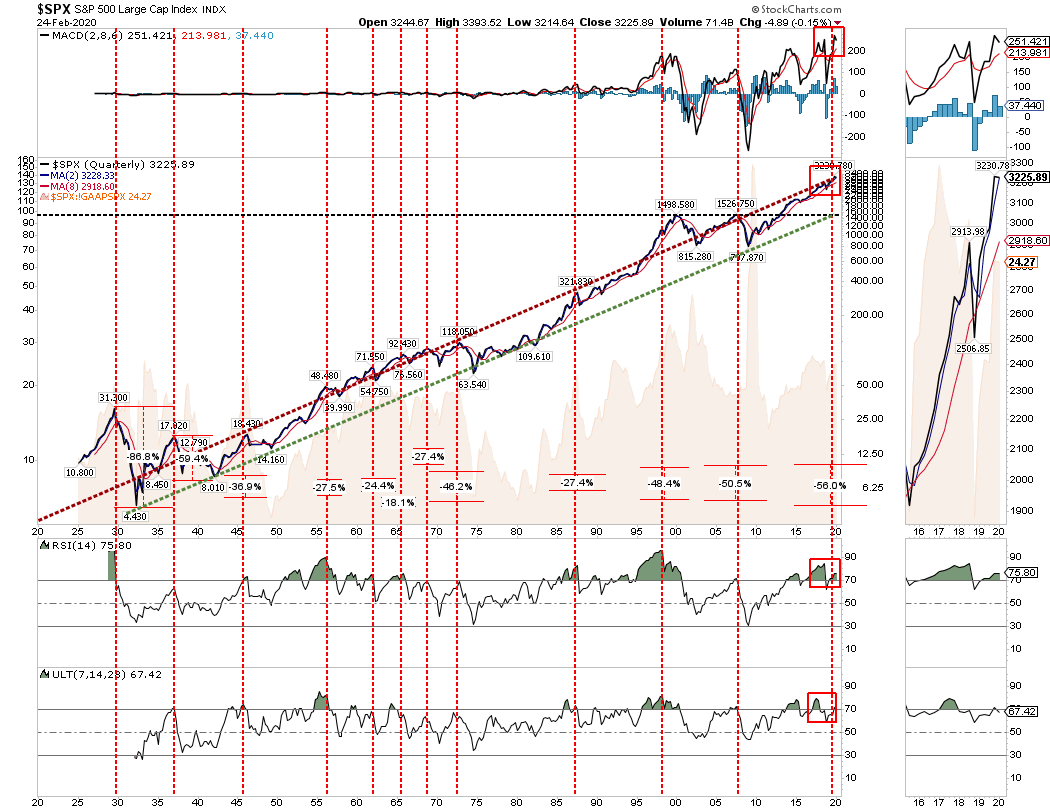
I am suggesting reducing risk opportunistically, and being pragmatic about your portfolio, and your money. Another 50% correction is absolutely possible, as shown in the chart below.
(The chart shows ever previous major correction from similar overbought conditions on a quarterly basis. A similar correction would currently entail a 58.2% decline.)
So, what should you be doing now. Here are our rules that we will be following on the next rally.
Move slowly. There is no rush in adding equity exposure to your portfolio. Use pullbacks to previous support levels to make adjustments.
If you are heavily UNDER-weight equities, DO NOT try and fully adjust your portfolio to your target allocation in one move. This could be disastrous if the market reverses sharply in the short term. Again, move slowly.
Begin by selling laggards and losers. These positions are dragging on performance as the market rises and tends to lead when markets fall. Like “weeds choking a garden,” pull them.
Add to sectors, or positions, that are performing with, or outperforming the broader market.
Move “stop-loss” levels up to current breakout levels for each position. Managing a portfolio without “stop-loss” levels is like driving with your eyes closed.
While the technical trends are intact, risk considerably outweighs the reward. If you are not comfortable with potentially having to sell at a LOSS what you just bought, then wait for a larger correction to add exposure more safely. There is no harm in waiting for the “fat pitch” as the current market setup is not one.
If none of this makes any sense to you – please consider hiring someone to manage your portfolio for you. It will be worth the additional expense over the long term.
While we remain optimistic about the markets currently, we are also taking precautionary steps of tightening up stops, adding non-correlated assets, raising some cash, and looking to hedge risk opportunistically.
Everyone approaches money management differently. This is just our approach to the process of controlling risk.
We hope you find something useful in it.
SOTM 2020: State Of The Markets
“I am thrilled to report to you tonight that our economy is the best it has ever been.” – President Trump, SOTU
In the President’s “State of the Union Address” on Tuesday, he used the podium to talk up the achievements in the economy and the markets.
Low unemployment rates
Tax cuts
Job creation
Economic growth, and, of course,
Record high stock markets.
While it certainly is a laundry list of items he can claim credit for, it is the claim of record-high stock prices that undermines the rest of the story.
Let me explain.
The stock market should be a reflection of actual economic growth. Since corporate earnings are derived primarily from consumptive spending, corporate investments, and imports and exports, actual economic activity should be reflected in the price investors are willing to pay for the earnings being generated.
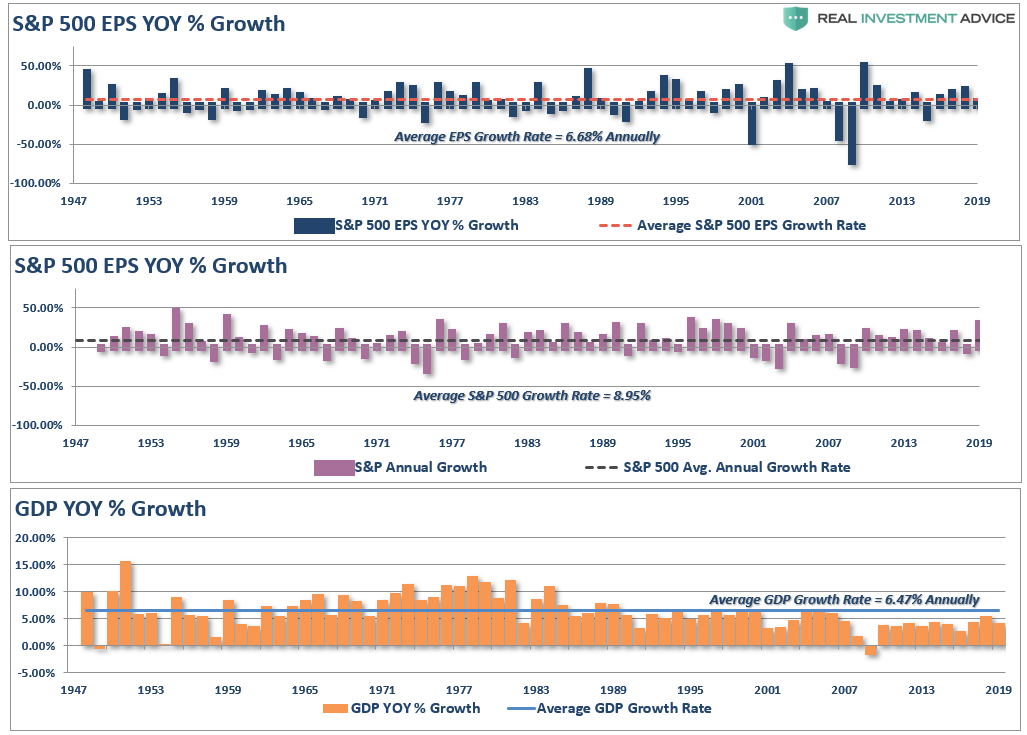
For the majority of the 20th century, this was indeed the case as corporate earnings were reflective of economic activity. The chart below shows the annual change in reported earnings, nominal GDP, and the price of the S&P 500.
Not surprisingly, as the economy grew at 6.47% annually, earnings also grew at 6.68% annually as would be expected. Since investors are willing to a premium for earnings growth, the S&P 500 grew at 9% annually over that same period.
Importantly, note that long-term economic growth has averaged 6% annually. However, as shown in the lower panel, economic growth has been running below the long-term average since 2000, but has been substantially weaker since 2007, growing at just 2% annually.
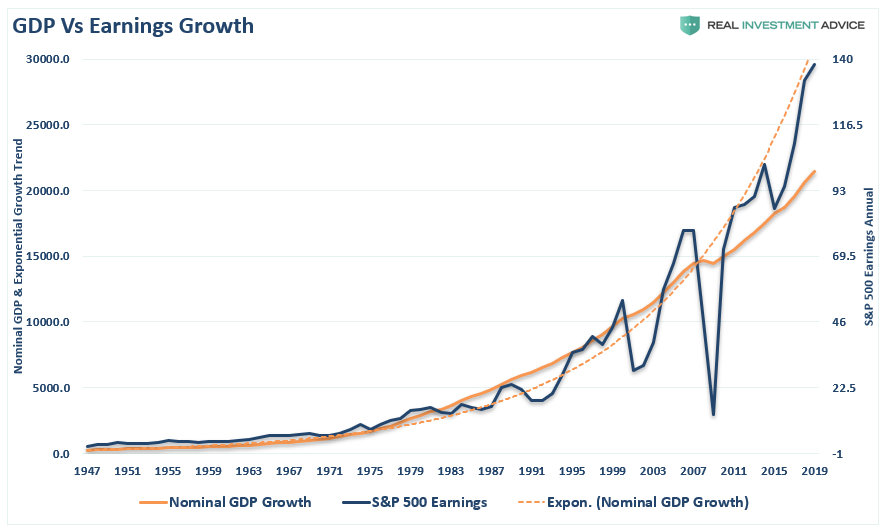
The next chart shows this weaker growth more clearly. Since the financial crisis, economic growth has failed to recover back to its long-term exponential growth trend. However, reported earnings are exceedingly deviated from what actual underlying economic growth can generate. This is due to a decade of accounting gimmickry, share buybacks, wage suppression, low interest rates, and high corporate debt levels.
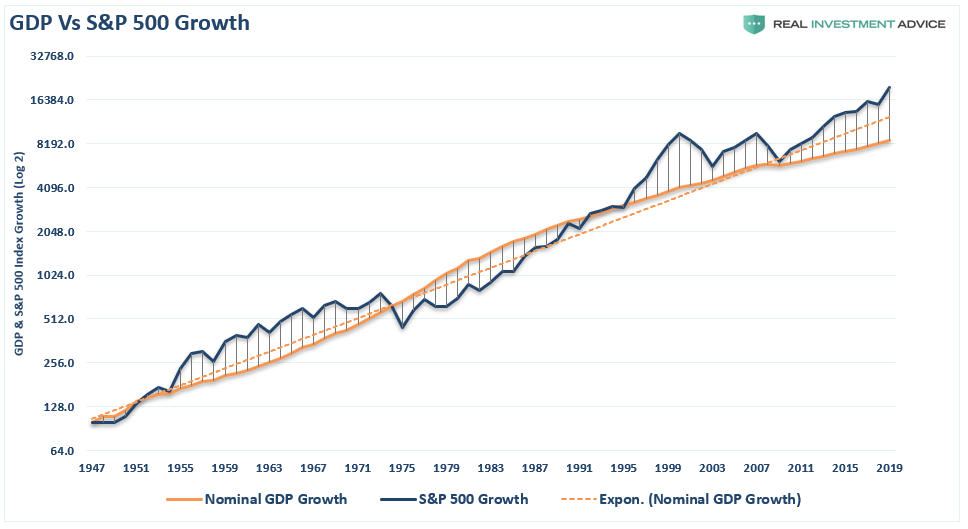
The next chart looks at the deviation by looking at the market itself versus long-term economic growth. The S&P 500 and GDP have been scaled to 100, and displayed on a log-scale for comparative purposes.
The current growth trend of the economy is running well below its long-term exponential trend, but the S&P 500 is currently at the most significant deviation from that growth on record. (It should be noted that while these deviations from economic growth can last for a long-time, the eventual mean reversion always occurs.)
The Spending Mirage
Take a look at the following chart.
While the President’s claims of an exceptionally strong economy rely heavily on historically low unemployment and jobless claims numbers, historically high levels of asset prices, and strong consumer spending trends, there is an underlying deterioration which goes unaddressed.
So, here’s your pop quiz?
If consumer spending is strong, AND unemployment is near the lowest levels on record, AND interest rates are low, AND job creation is high – then why is the economy only growing at 2%?
Furthermore, if the economy was doing as well as government statistics suggest, then why does the Federal Reserve need to continue providing the economy with “emergency measures,” cutting rates, and giving “verbal guidance,” to keep the markets from crashing?
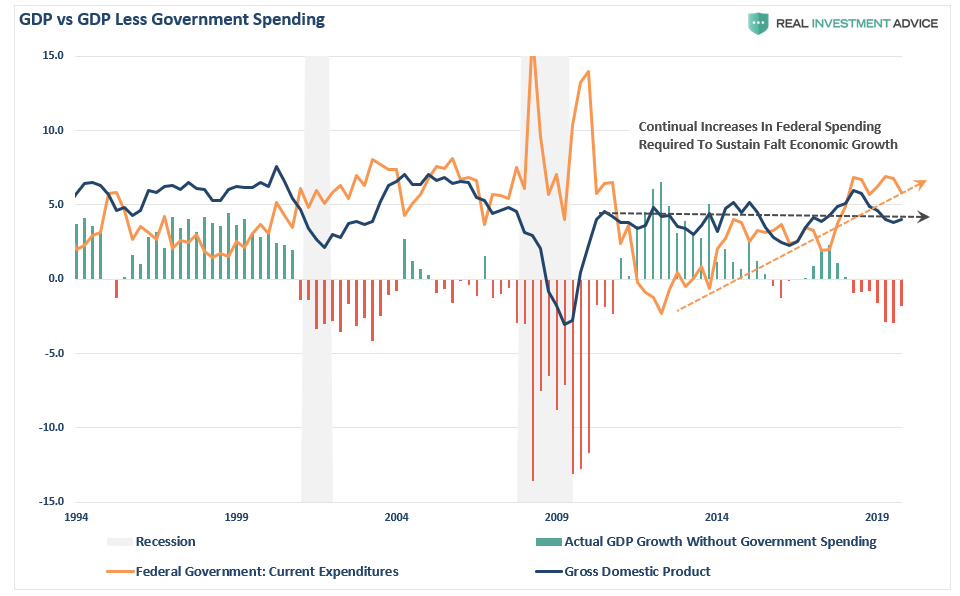
The reality is that if it wasn’t for the Government running a massive trillion-dollar fiscal deficit, economic growth would actually be recessionary.
In GDP accounting, consumption is the largest component. Of course, since it is impossible to “consume oneself to prosperity,” the ability to consume more is the result of growing debt. Furthermore, economic growth is also impacted by Government spending, as government transfer payments, including Medicaid, Medicare, disability payments, and SNAP (previously called food stamps), all contribute to the calculation.
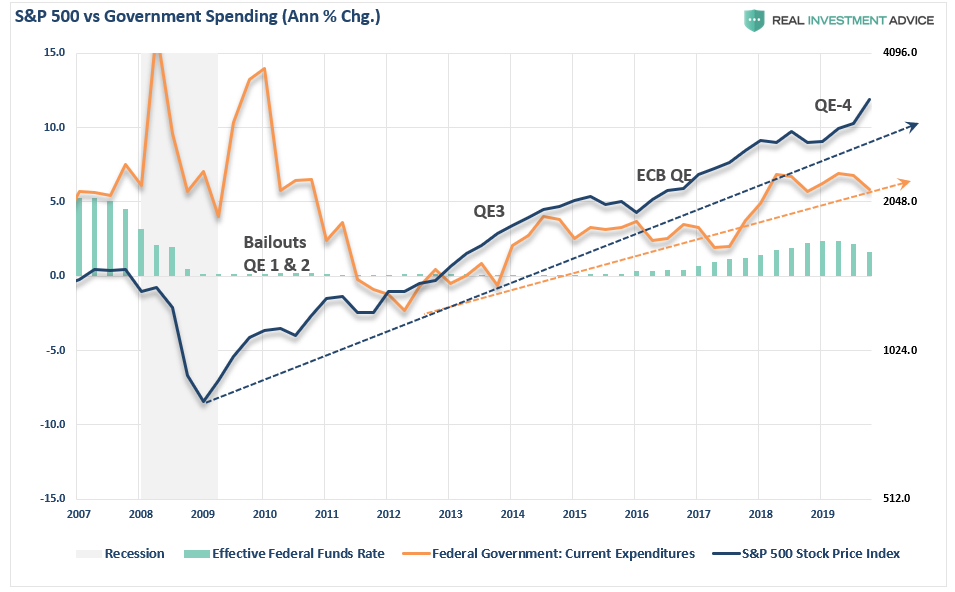
As shown below, between the Federal Reserve’s monetary infusions and the ballooning government deficit, the S&P 500 has continued to find support.
However, nothing is “produced” by those transfer payments. They are not even funded. As a result, national debt rises every year, and that debt adds to GDP.
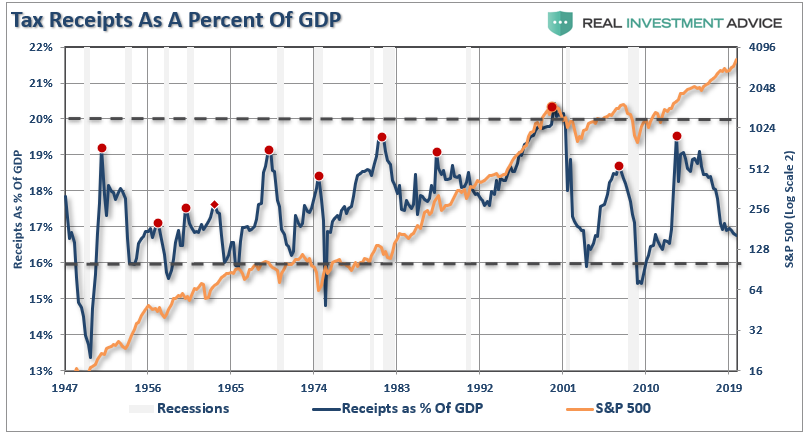
Another way to look at this is through tax receipts as a percentage of GDP. If the economy was indeed “the strongest ever,” then we should see an increase in wage growth commensurate with increased economic activity. As a result of higher wages, there should be an increase in the taxes collected by the Government from wages, consumption, imports, and exports.
See the problem here?
Clearly, this is not the case as tax receipts as a percentage of GDP peaked in 2012, and have now declined to levels which historically are more coincident with economic recessions, rather than expansions. Yet, currently, because of the artificial interventions, the stock market remains well detached from what economic data is actually saying.
Corporate Profits Tell The Real Story
When it comes to the state of the market, corporate profits are the best indicator of economic strength.
The detachment of the stock market from underlying profitability guarantees poor future outcomes for investors. But, as has always been the case, the markets can certainly seem to “remain irrational longer than logic would predict,” but it never lasts indefinitely.
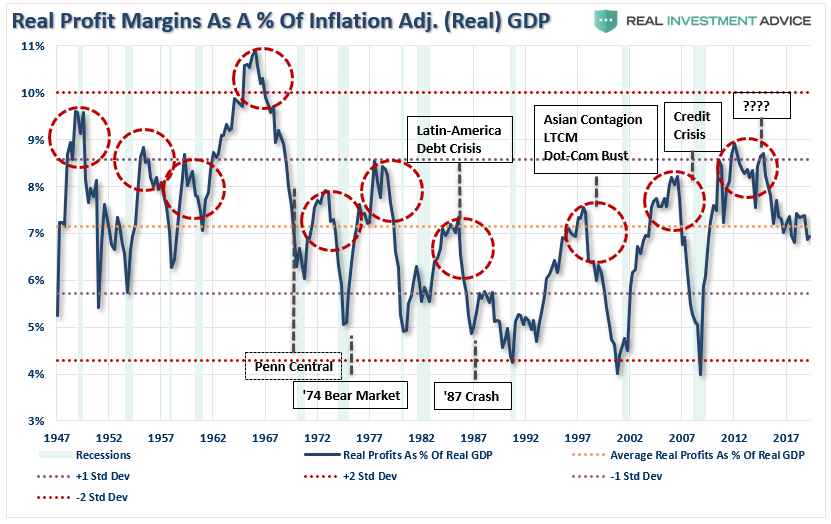
“Profit margins are probably the most mean-reverting series in finance, and if profit margins do not mean-revert, then something has gone badly wrong with capitalism. If high profits do not attract competition, there is something wrong with the system, and it is not functioning properly.” – Jeremy Grantham
As shown, when we look at inflation-adjusted profit margins as a percentage of inflation-adjusted GDP, we see a clear process of mean-reverting activity over time. Of course, those mean reverting events are always coupled with recessions, crises, or bear markets.
More importantly, corporate profit margins have physical constraints. Out of each dollar of revenue created, there are costs such as infrastructure, R&D, wages, etc. Currently, the biggest contributors to expanding profit margins has been the suppression of employment, wage growth, and artificially suppressed interest rates, which have significantly lowered borrowing costs. Should either of the issues change in the future, the impact to profit margins will likely be significant.
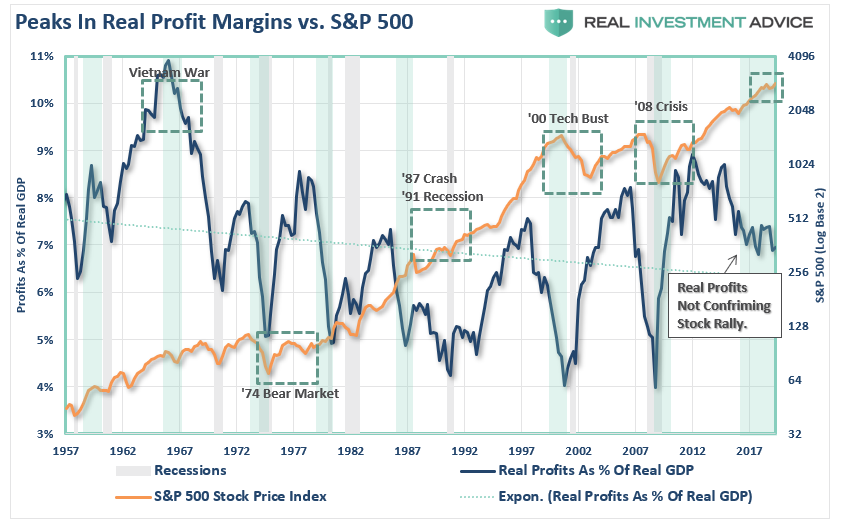
The chart below shows the ratio overlaid against the S&P 500 index.
I have highlighted peaks in the profits-to-GDP ratio with the green vertical bars. As you can see, peaks, and subsequent reversions, in the ratio have been a leading indicator of more severe corrections in the stock market over time. This should not be surprising as asset prices should eventually reflect the underlying reality of corporate profitability.
It is often suggested that, as mentioned above, low interest rates, accounting rule changes, and debt-funded buybackshave changed the game. While that statement is true, it is worth noting that each of those supports are artificial and finite.
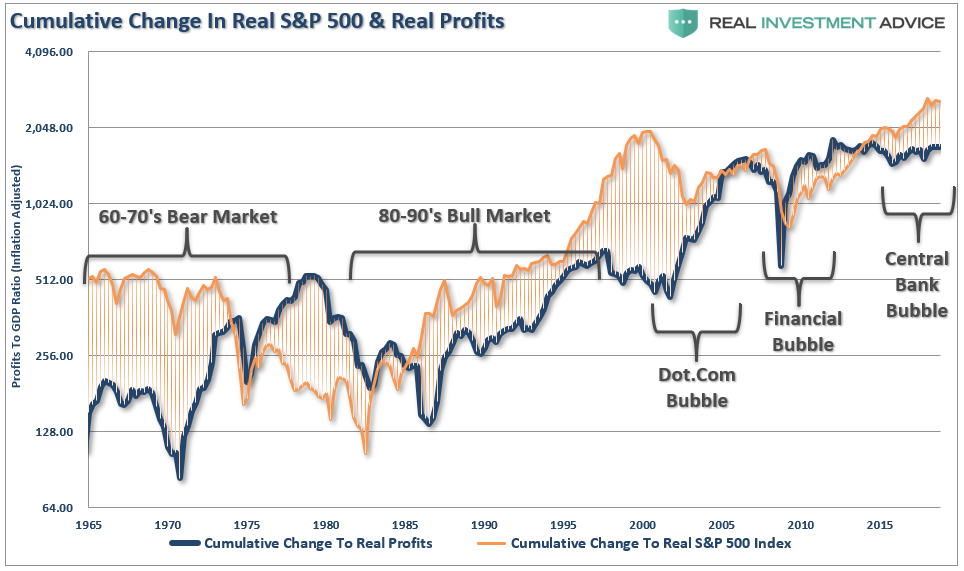
Another way to look at the issue of profits as it relates to the market is shown below. When we measure the cumulative change in the S&P 500 index as compared to the level of profits, we find again that when investors pay more than $1 for a $1 worth of profits, there is an eventual mean reversion.
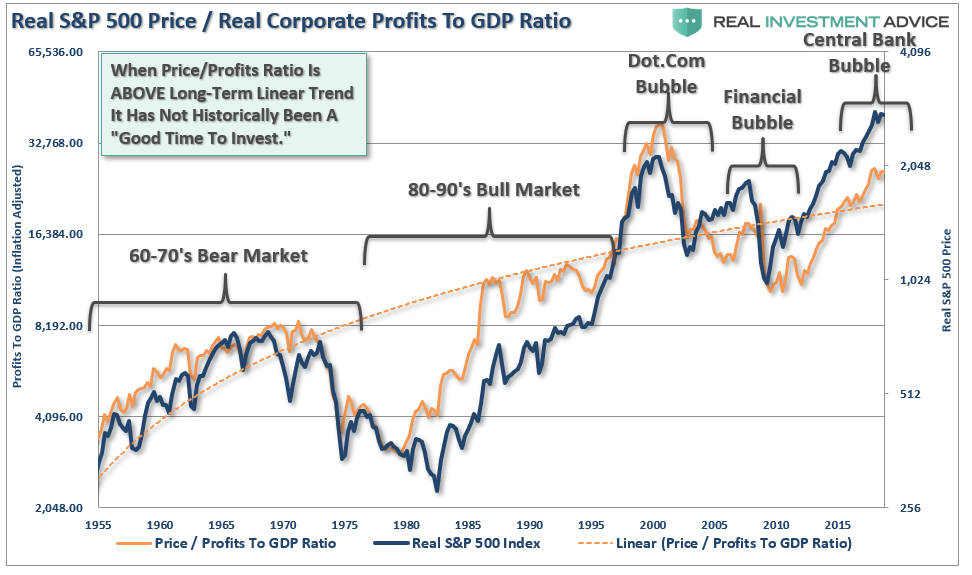
The correlation is clearer when looking at the market versus the ratio of corporate profits to GDP. (Again, since corporate profits are ultimately a function of economic growth, the correlation is not unexpected.)
It seems to be a simple formula for investors that as long as the Fed remains active in supporting asset prices, the deviation between fundamentals and fantasy doesn’t matter.
However, investors are paying more today than at any point in history for each $1 of profit, which history suggests will not end well.
While the media is quick to attribute the current economic strength, or weakness, to the person who occupies the White House, the reality is quite different.
The political risk for President Trump is taking too much credit for an economic cycle which was already well into recovery before he took office. Rather than touting the economic numbers and taking credit for liquidity-driven financial markets, he should be using that strength to begin the process of returning the country to a path of fiscal discipline rather than a “drunken binge” of government spending.
With the economy, and the financial markets, sporting the longest-duration in history, simple logic should suggest time is running out.
This isn’t doom and gloom, it is just a fact.
Politicians, over the last decade, failed to use $33 trillion in liquidity injections, near-zero interest rates, and surging asset prices to refinance the welfare system, balance the budget, and build surpluses for the next downturn.
Instead, they only made the deficits worse, and the U.S. economy will enter the next recession pushing a $2 Trillion deficit, $24 Trillion in debt, and a $6 Trillion pension gap, which will devastate many in their retirement years.
While Donald Trump talked about “Yellen’s big fat ugly bubble” before he took office, he has now pegged the success of his entire Presidency on the stock market.
It will likely be something he eventually regrets.
“Then said Jesus unto him, Put up again thy sword into his place: for all they that take the sword shall perish with the sword.” – Matthew 26, 26:52
We respect your privacy and will only send you email that is related to what you subscribed to and why you subscribed. You can unsubscribe whenever you want with just a click of your mouse. For more information please see... Disclosure & Privacy Policy.