Tag Archives: trade war

Technically Speaking: The One Thing – Playing The “Bear Market” Rally.

Let’s flashback to a time not so long ago, May 2019.

“It was interesting to see Federal Reserve Chairman Jerome Powell, during an address to the Fernandina Beach banking conference, channel Ben Bernanke during his speech on corporate ‘sub-prime’ debt (aka leveraged loans.)

‘Many commentators have observed with a sense of déjà vu the buildup of risky business debt over the past few years. The acronyms have changed a bit—’CLOs’ (collateralized loan obligations) instead of ‘CDOs’ (collateralized debt obligations), for example—but once again, we see a category of debt that is growing faster than the income of the borrowers even as lenders loosen underwriting standards. Likewise, much of the borrowing is financed opaquely, outside the banking system. Many are asking whether these developments pose a new threat to financial stability.

In public discussion of this issue, views seem to range from ‘This is a rerun of the subprime mortgage crisis’ to ‘Nothing to worry about here.’ At the moment, the truth is likely somewhere in the middle. To preview my conclusions, as of now, business debt does not present the kind of elevated risks to the stability of the financial system that would lead to broad harm to households and businesses should conditions deteriorate.’ – Jerome Powell, May 2019

In other words, corporate debt is ‘contained.’”

As we concluded at that time:

“Unfortunately, while Jerome Powell may be currently channeling Ben Bernanke to keep markets stabilized momentarily, the real risk is some unforeseen exogenous event, such as Deutsche Bank going bankrupt, that triggers a global credit contagion.”

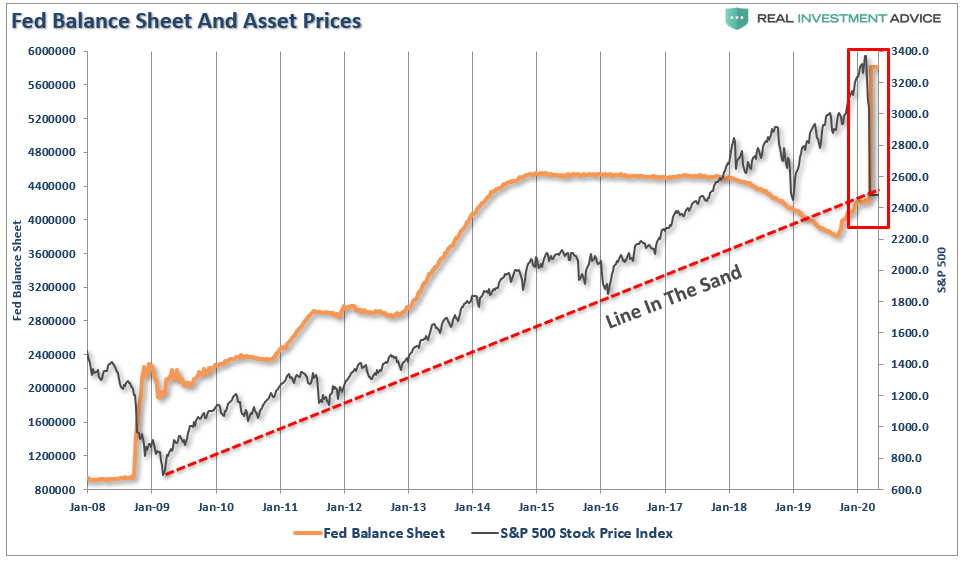
While the “exogenous event” was a “virus,” it led to a “credit event” which has crippled markets globally, leading the Federal Reserve to throw everything possible at trying to stem the crisis. With the Fed’s balance sheet set to expand towards $10 Trillion, the Federal deficit to balloon to $4 trillion, it is “all hands on deck” to stop the next “Great Depression” before it takes hold.

However, this is what we have been warning about:

“Pay attention to the market. There action this year is very reminiscent of previous market topping processes. Tops are hard to identify during the process as ‘change happens slowly.’The mainstream media, economists, and Wall Street will dismiss pickup in volatility as simply a corrective process. But when the topping process completes, it will seem as if the change occurred ‘all at once.’

The same media which told you ‘not to worry,’ will now tell you ‘no one could have seen it coming.’”

The only question which remains to be answered is whether the MORE debt and monetary stimulus can fix a debt and monetary stimulus bubble?

In other words, can the Fed inflate the fourth bubble to offset the implosion of the third?

Think about the insanity of that statement, but that is what the markets, and the economy, are banking on.

We do expect that with the flood of fiscal and monetary stimulus, a “bear market rally” becomes a real probability, at least in the short-term.

How big of a rally? What should you do? These are the important points in today’s missive.

The One Thing

The “ONE Thing” you need to do TODAY, right now, is “accept” where you are.

What you had, what was lost, and the mistakes you made, CAN NOT be corrected. They are in the past. However, by hanging on to those “emotions,” we lock ourselves out of the ability to take actions that will begin the corrective process.

Let me dispel some myths:

  • “Hope” is not an investment strategy. Hanging on to some stock you lost money in waiting for it to “get back to even,” costs you opportunity.
  • You aren’t a loser. Whatever happened previously is over, and it doesn’t make you a “loser.” However, staying in losing positions or strategies will continue to cost you. 
  • Selling does NOT lock in losses. The losses have already occurred. Selling, however, gives you the ability to take advantage of “opportunity” to begin the recovery process.  

Okay, now that we have the right “mindset,” let’s take an educated guess on what happens next.

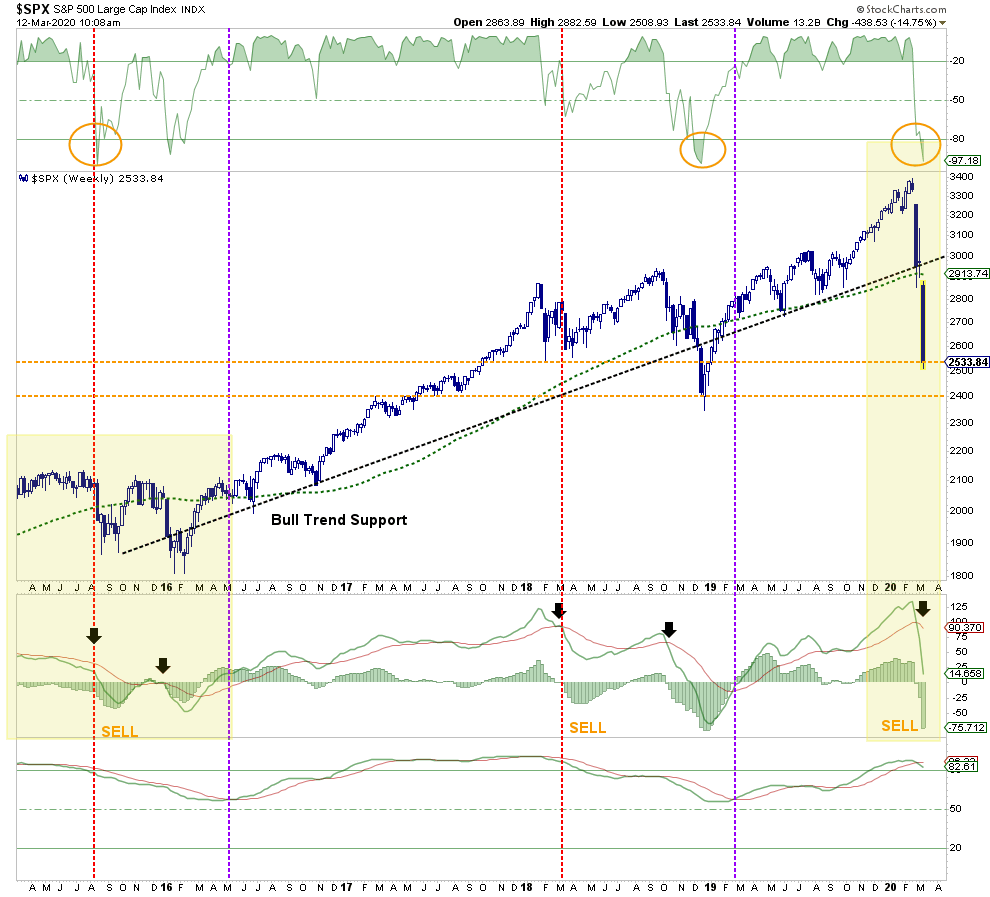
The current bear market is exhibiting many of the same “technical traits” as seen in both the “Dot.com” and “Financial Crisis.” 

In each previous case, the market experienced a parabolic advance to the initial peak. A correction ensued, which was dismissed by the mainstream media, and investors alike, as just a “pause that refreshes.” They were seemingly proved correct as the markets rebounded shortly thereafter and even set all-time highs. Investors, complacent in the belief that “this time was different” (1999 – a new paradigm, 2007 – Goldilocks economy), continued to hold out hopes the bull market was set to continue.

That was a mistake.

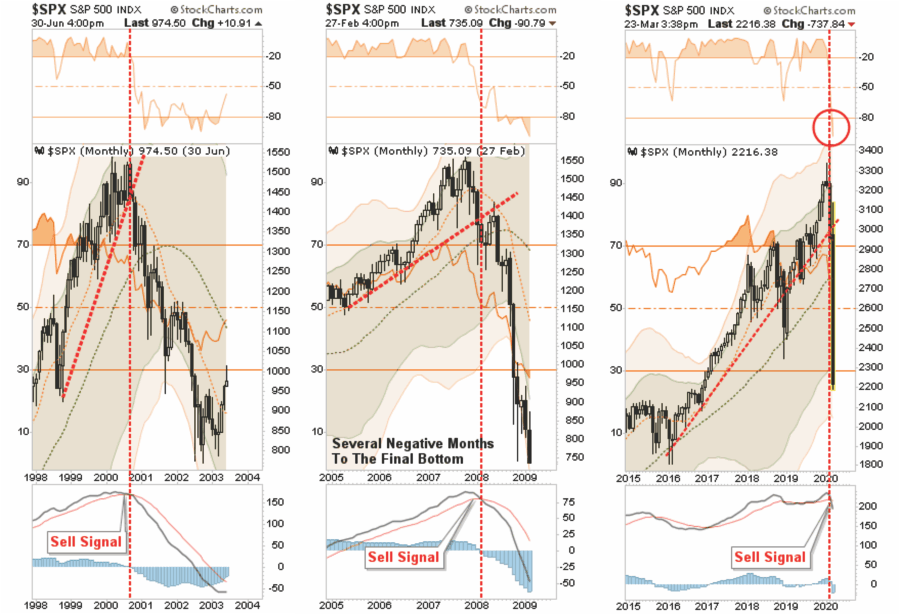
Also, in each period, once the monthly “sell signal” was triggered from a high level, the ensuing correction process took months to complete. This not only reset the market, but valuations as well. In both previous periods, reflexive rallies occurred, which eventually failed. While the 2008 plunge following the Lehman crisis was most similar to the current environment, there was a brief rally following the passage of TARP, which sucked investors in before the additional 22% decline in the first two months of 2009.

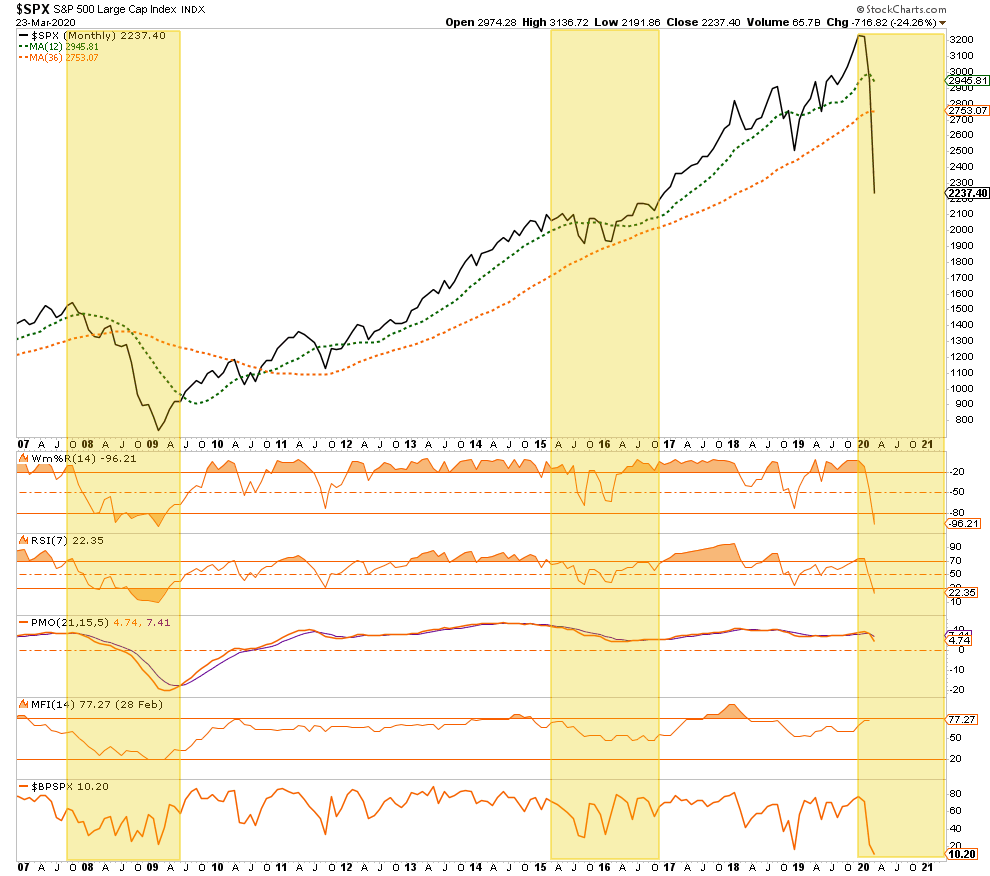
Most importantly, the market got very oversold early in both previous bear markets, and stayed that way for the entirety of the bear market. Currently, the market has only just now gotten to a similar oversold condition.

What all the indicators currently suggest is that while the current correction has been swift and brutal, bear markets are not resolved in a single month. 

This is going to take some time.

Bear Market Rally

Over the past couple of week’s, we have been talking about a potential reflexive bounce.

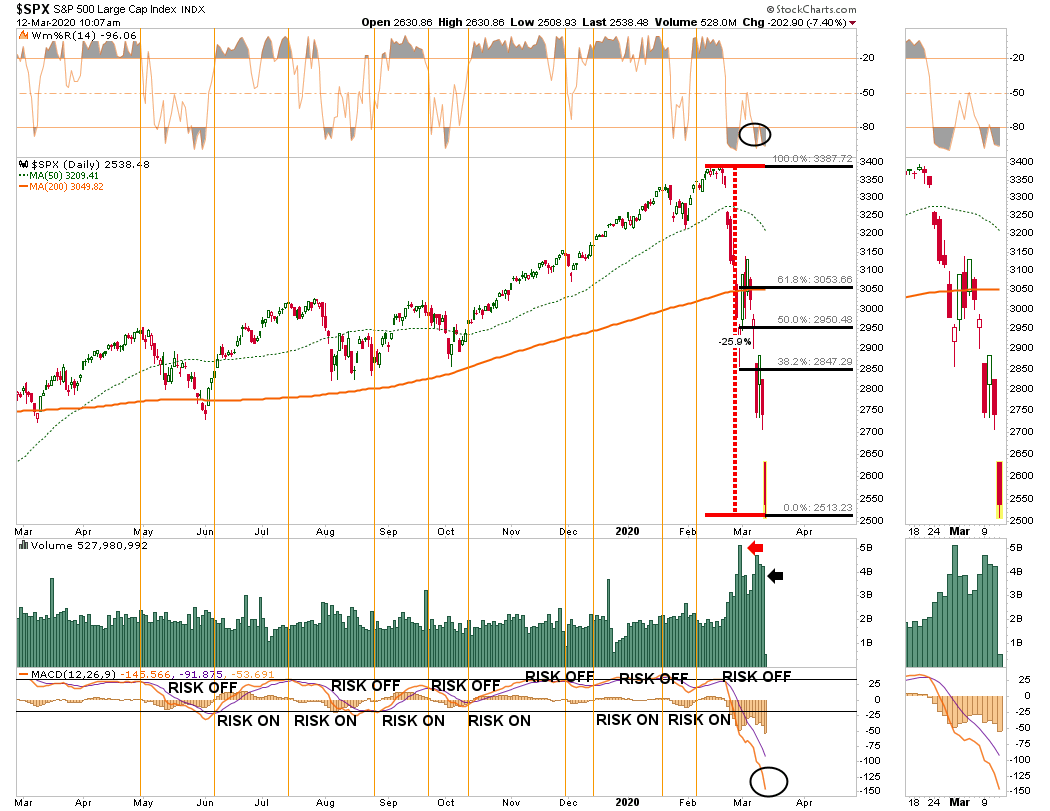
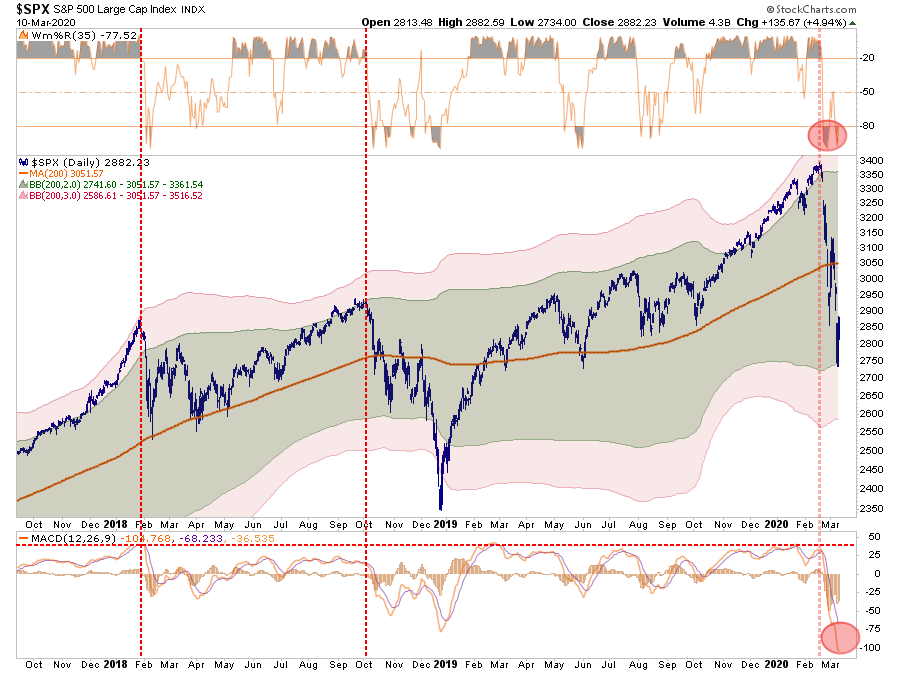
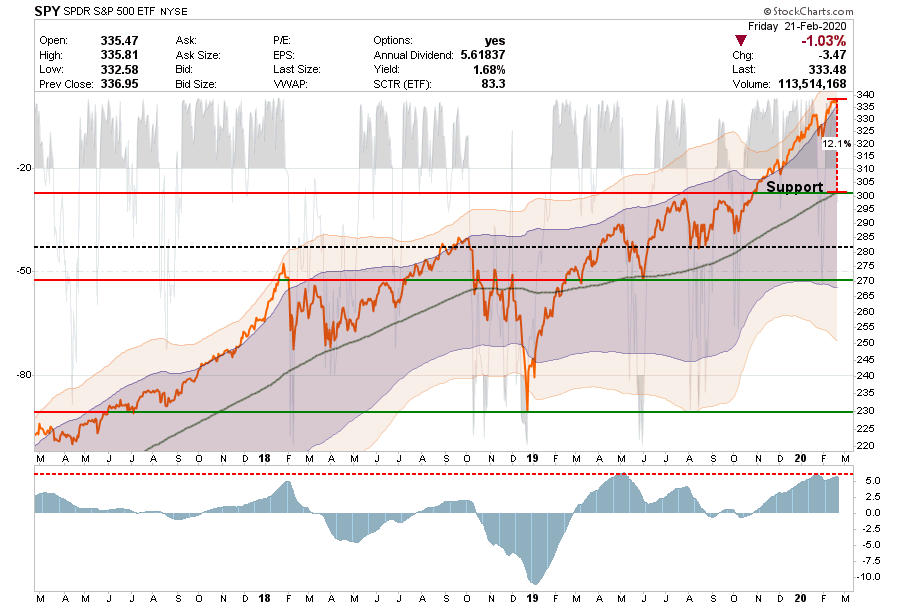
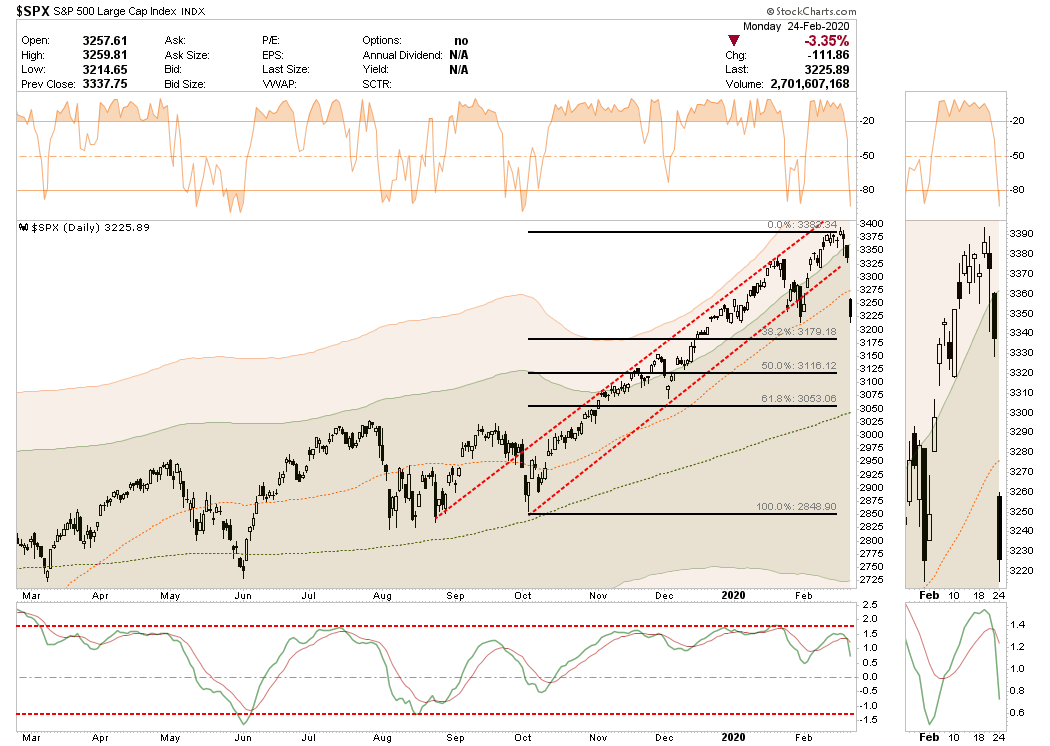
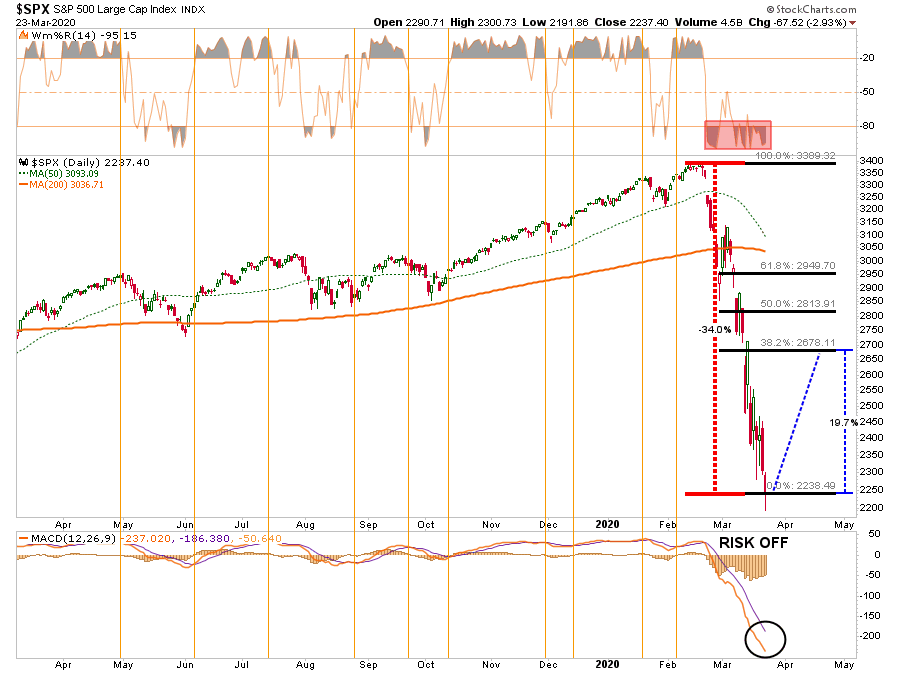
From a purely technical basis, the extreme downside extension, and potential selling exhaustion, has set the markets up for a fairly strong reflexive bounce. This is where fun with math comes in.

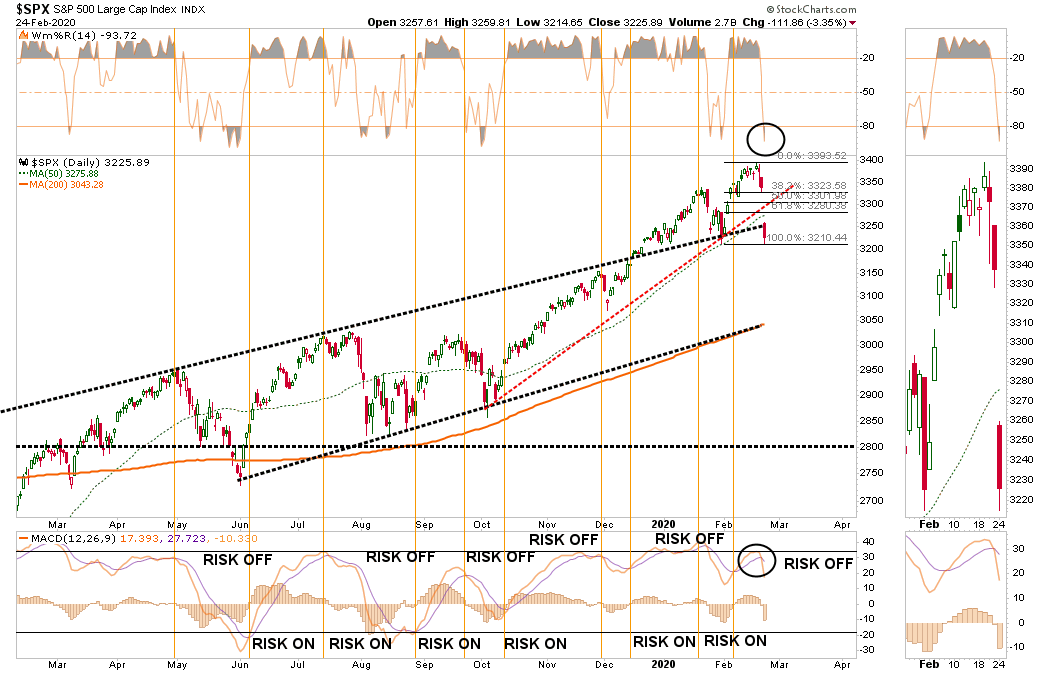
As shown in the chart below, after a 35% decline in the markets from the previous highs, a rally to the 38.2% Fibonacci retracement would encompass a 20% advance. Such an advance will “lure” investors back into the market, thinking the “bear market” is over.

This is what “bear market rallies” do, and generally inflict the most pain possible on unwitting investors. The reasons for this are many, but primarily investors who were trapped in the recent decline will use the rally to “flee” the markets permanently.

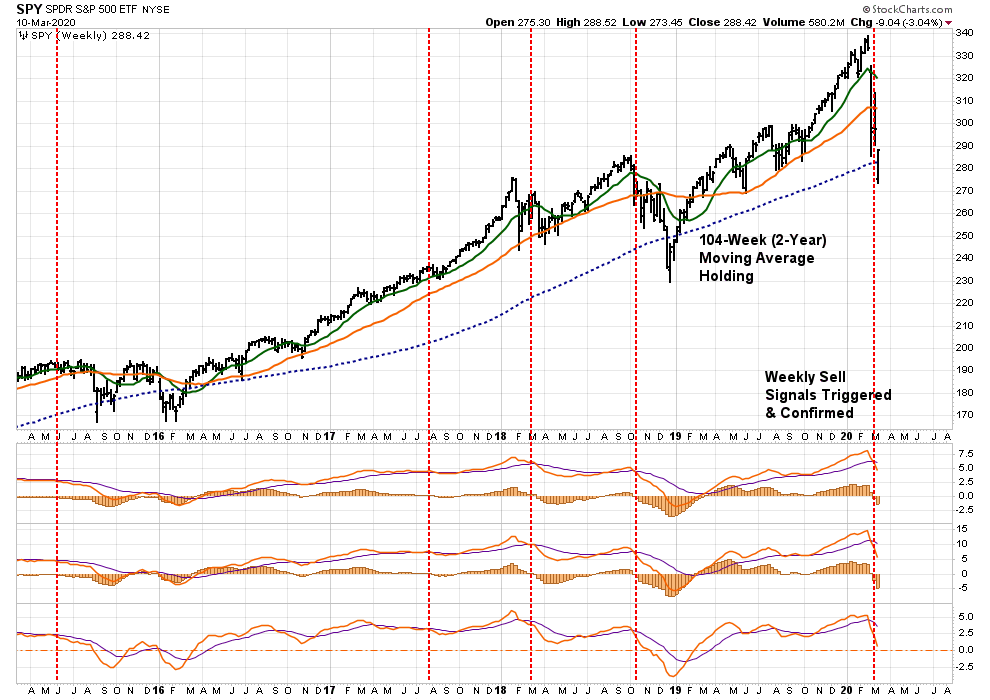
Chart Updated Through Monday

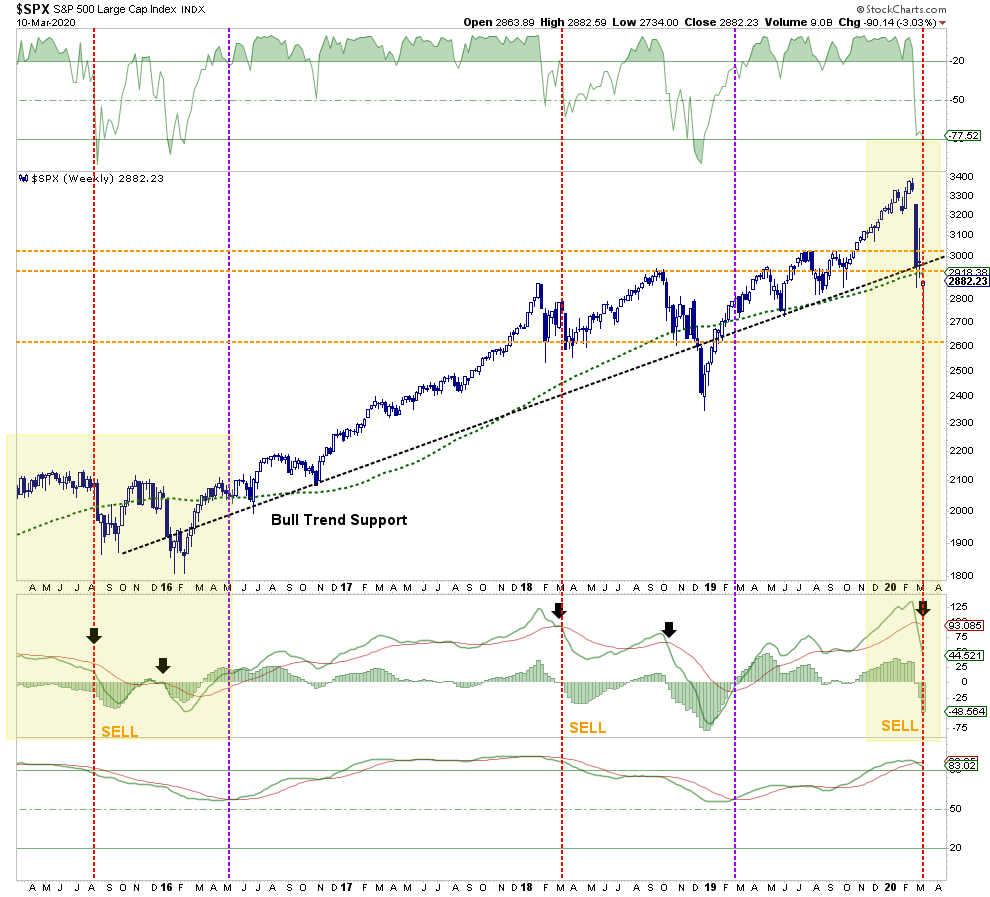
More importantly, as noted above, “bear markets” are not resolved in a single month. Currently, there are too many investors trying to figure out where “the bottom” is, so they can “buy” it.

Bear markets do not end in optimism; they end in despair. 

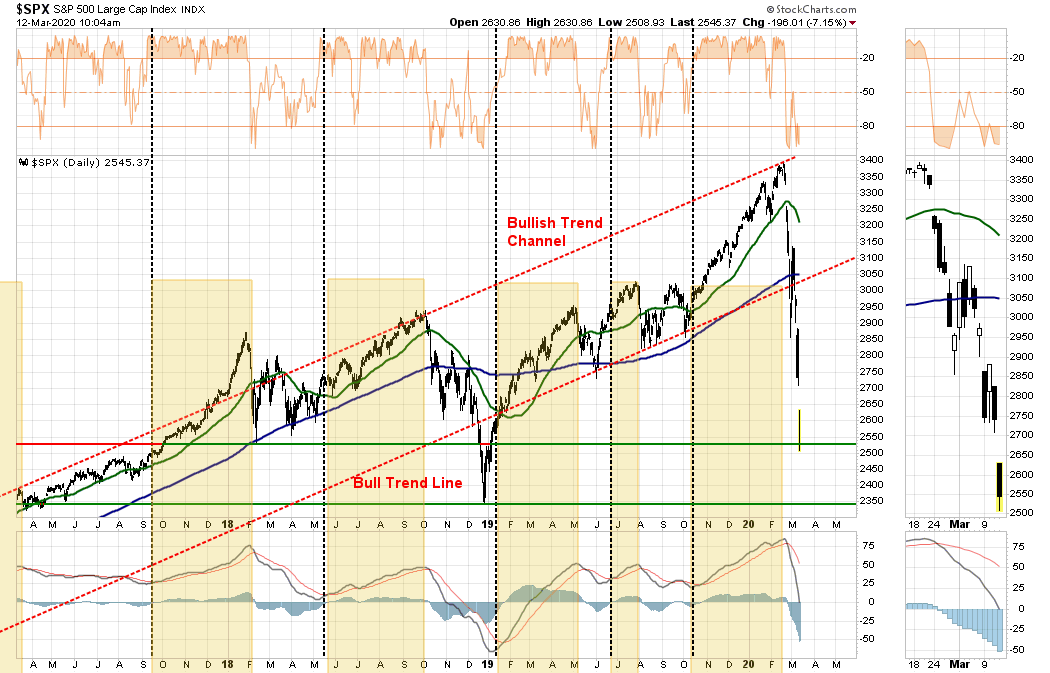
Looking back at 2008, numerous indicators suggest the “bear market” has only just begun. While this does NOT rule out a fairly strong reflexive rally, it suggests that any rally will ultimately fail as the bear market completes its cycle. 

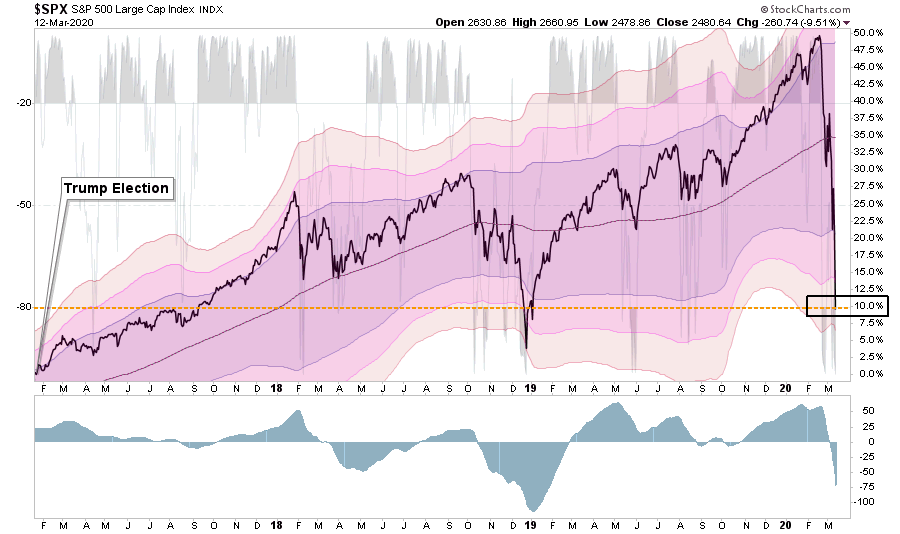
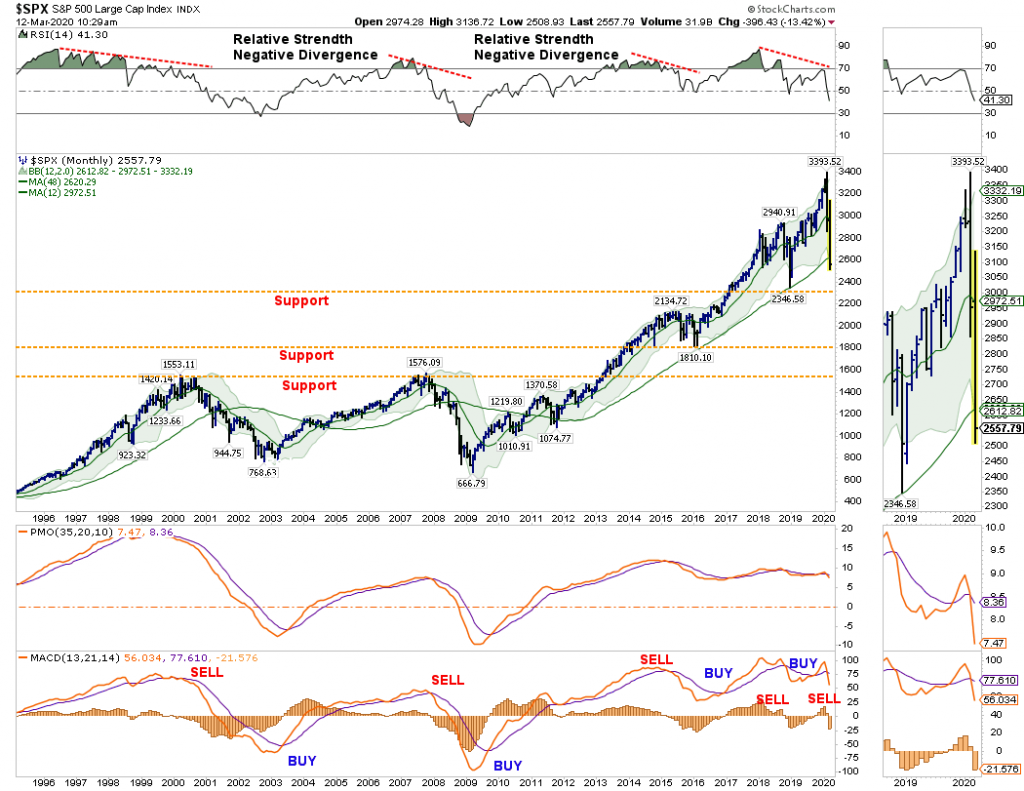
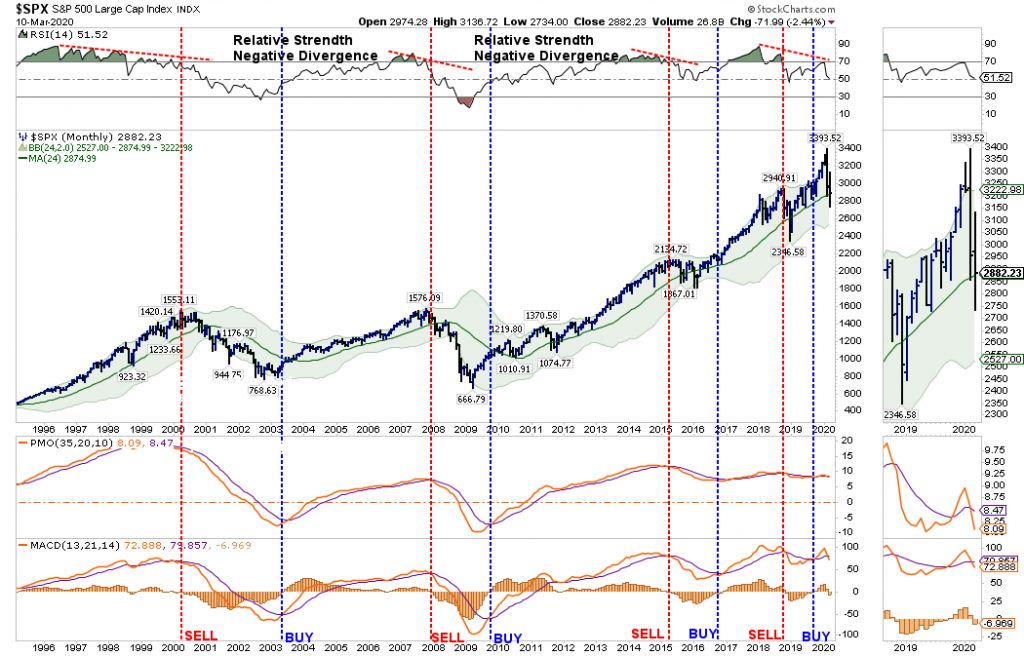
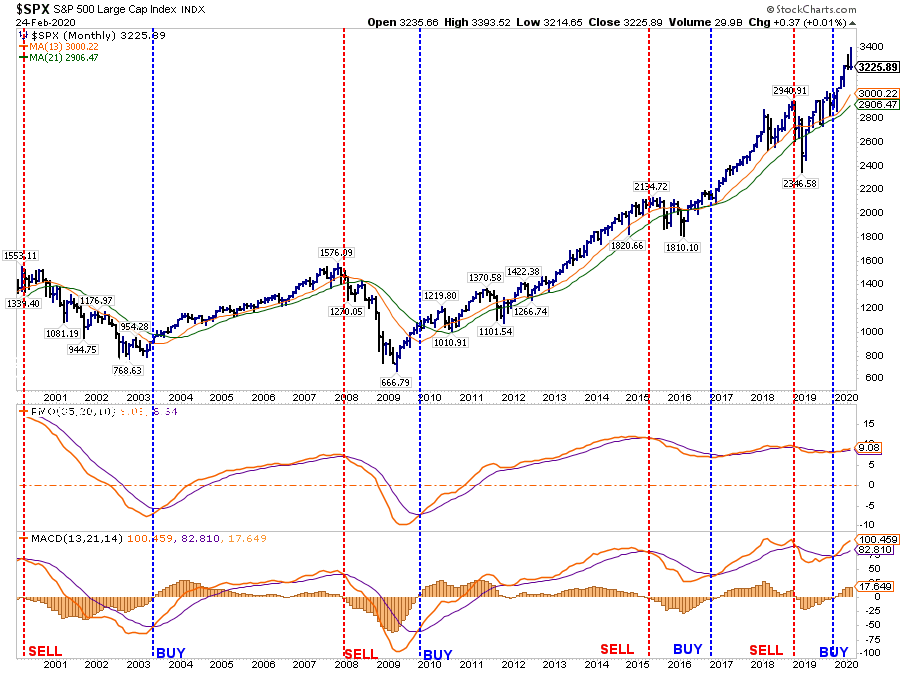
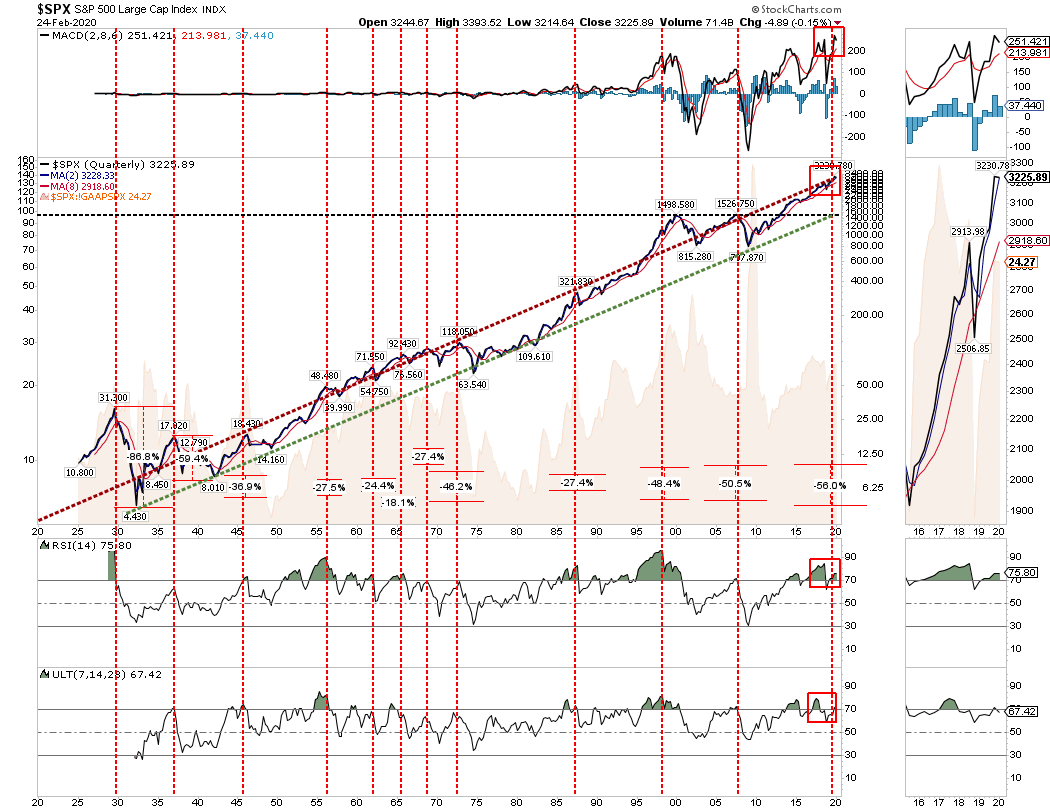
This can be seen more clearly in the monthly chart below, which looks at both previous bull and bear markets using a Fibonacci retracement. As shown, from the peak of both previous bull market “bubbles,” the market reversed 61.8% of the advance during the “Dot.com” crash, and more than 100% of the advance during the “Financial Crisis.”  

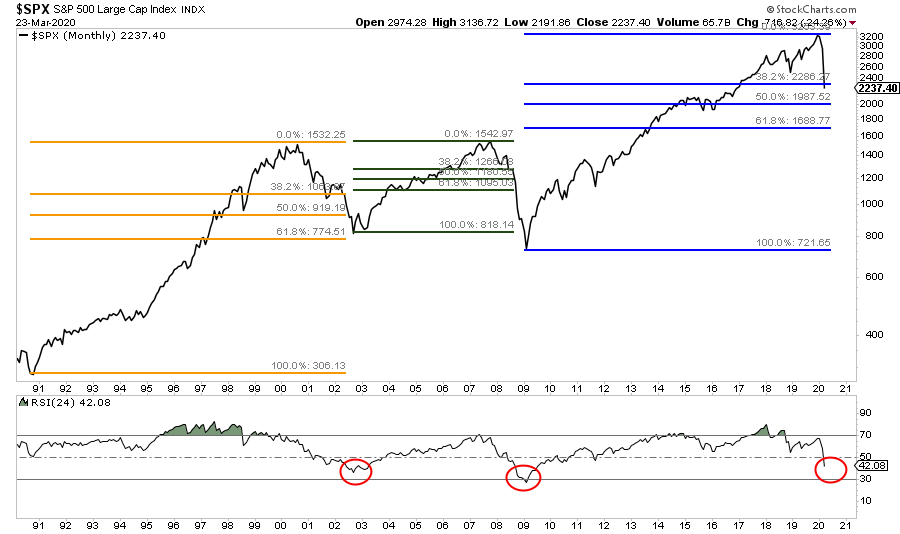
Given the current bull market cycle was longer, more levered, and more extended than both previous bull markets, a 38.2% decline is unlikely to fulfill the requirements of this reversion. Our ultimate target of 1600-1800 on the S&P 500 remains confirmed by the quarterly chart below.

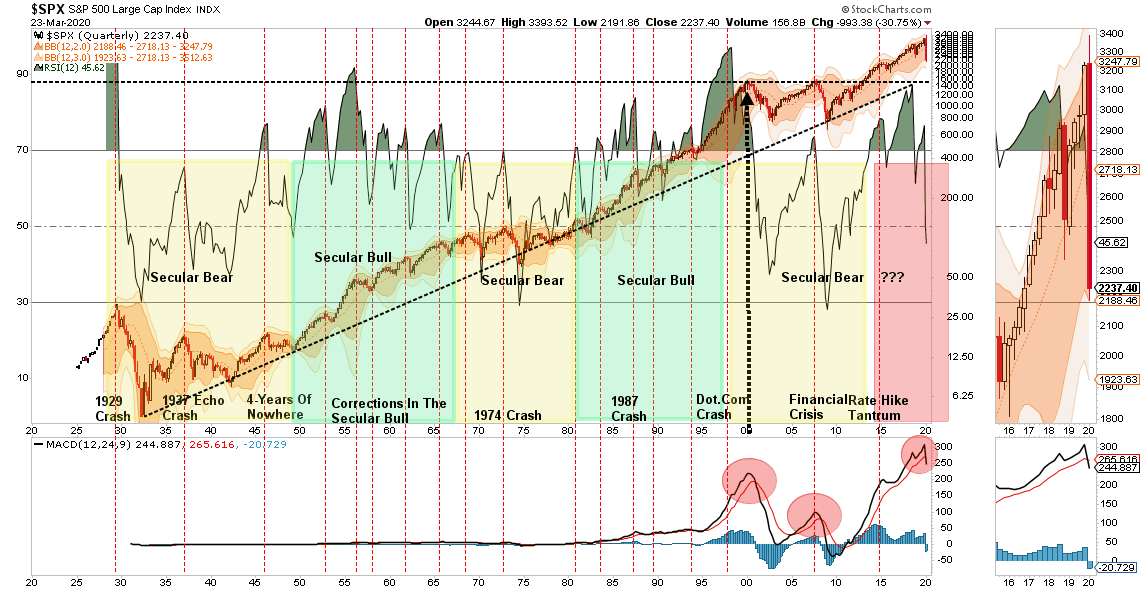
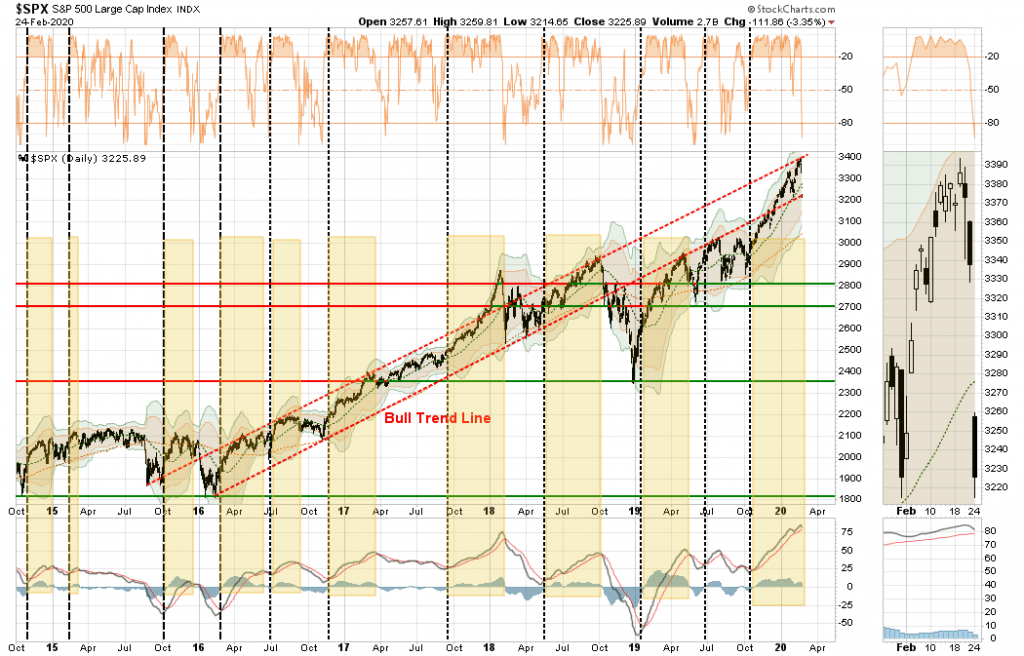
The current correction process has only just triggered a quarterly sell signal combined with a break from an extreme deviation of the long-term bull-trend back to the 1930’s. Both previous bull market peaks coincide with the long-term bull trend at about 1600 on the S&P currently. Given all the stimulus being infused into the markets currently, we broaden our bear market bottom target to 1600-1800, as noted.

The technical signals, which do indeed lag short-term turns in the market, all confirm the “bear market” is only just awakening. While bullish reflexive rallies are very likely, and should be used to your advantage, this is a “traders” market for the time being.

In other words, the new mantra for the market, for the time being, will be to “Sell Rallies” rather than “Buy The Dip.”

As I have noted many times previously:

“This ‘time is not different,’ and there will be few investors that truly have the fortitude to ‘ride out’ the next decline.

Everyone eventually sells. The only difference is ‘selling when you want to,’ versus ‘selling when you have to.’”

Yes, the market will rally, and likely substantially so. Just don’t forget to take action, make changes, and get on the right side of the trade, before the “bear returns.” 

Let me conclude by reminding you of Bob Farrell’s Rule #8 from our recent newsletter:

Bear markets have three stages – sharp down, reflexive rebound and a drawn-out fundamental downtrend

  1. Bear markets often START with a sharp and swift decline.
  2. After this decline, there is an oversold bounce that retraces a portion of that decline.
  3. The longer-term decline then continues, at a slower and more grinding pace, as the fundamentals deteriorate.

Dow Theory also suggests that bear markets consist of three down legs with reflexive rebounds in between.

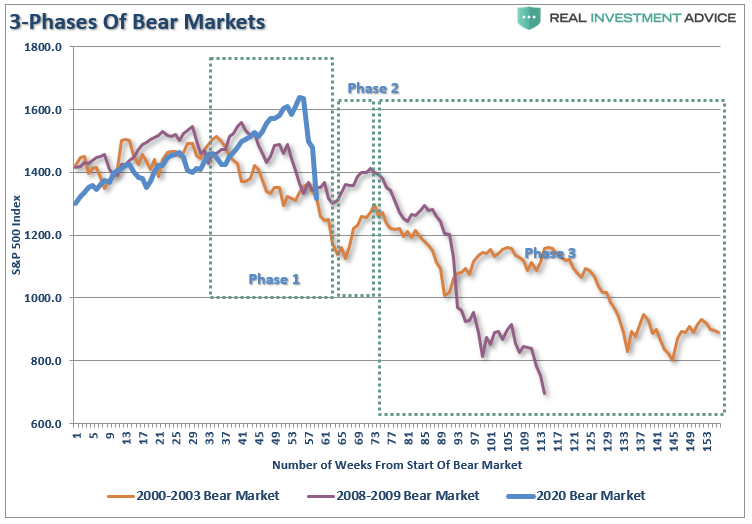
The chart above shows the stages of the last two primary cyclical bear markets versus today (the 2020 scale has been adjusted to match.)

As would be expected, the “Phase 1” selloff has been brutal.

That selloff sets up a “reflexive bounce.”  For many individuals, they will feel like” they are “safe.” This is how “bear market rallies” lure investors back in just before they are mauled again in “Phase 3.”

Just like in 2000, and 2008, the media/Wall Street will be telling you to just “hold on.” Unfortunately, by the time “Phase 3” was finished, there was no one wanting to “buy” anything.

Special Report: Fed Launches A Bazooka As Markets Hit Our Line In The Sand

The severity of the recent market rout has been quite astonishing. As shown below, in just three very short weeks, the market has reversed almost the entirety of the “Trump Stock Market” gains.

The decline has been unrelenting, and despite the Fed cutting rates last week, and President Trump discussing fiscal stimulus, the markets haven’t responded. In mid-February we were discussing the markets being 3-standard deviations above their 200-dma which is a rarity. Three short weeks later, the markets are now 4-standard deviations below which is even a rarer event. 

On Wednesday, the Federal Reserve increased “Repo operations” to $175 Billion.

Still no response from the market

Then on Thursday, the Fed brought out their “big gun.”

The Fed Bazooka

Yesterday, the Federal Reserve stepped into financial markets for the second day in a row, this time dramatically ramping up asset purchases amid the turmoil created by the combination of the spreading coronavirus and the collapse in oil prices. 

In a statement from the New York Fed:

The Federal Reserve said it would inject more than $1.5 trillion of temporary liquidity into Wall Street on Thursday and Friday to prevent ominous trading conditions from creating a sharper economic contraction.

‘These changes are being made to address highly unusual disruptions in Treasury financing markets associated with the coronavirus outbreak.’

The New York Fed said it would conduct three additional repo offerings worth an additional $1.5 trillion this week, with two separate $500 billion offerings that will last for three months and a third that will mature in one month.

If the transactions are fully subscribed, they would swell the central bank’s $4.2 trillion asset portfolio by more than 35%.” – WSJ

As Mish Shedlock noted,

“The Fed can label this however they want, but it’s another round of QE.”

As you can see in the chart below, this is a massive surge of liquidity hitting the market at a time the market is hitting important long-term trend support.

Of course, this is what the market has been hoping for:

  • Rate cuts? Check
  • Liquidity? Check

It is now, or never, for the markets.

With our portfolios already at very reduced equity levels, the break of this trendline will take our portfolios to our lowest levels of exposure. However, given the extreme oversold condition, noted above, it is likely we are going to see a bounce, which we will use to reduce risk into.

What happened today was an event we have been worried about, but didn’t expect to see until after a break of the trendline – “margin calls.”

This is why we saw outsized selling in “safe assets” such as REITs, utilities, bonds, and gold.

Cash was the only safe place to hide.

This also explains why the market “failed to rally” when the Fed announced $500 billion today. There is another $500 billion coming tomorrow. We will see what happens.

We aren’t anxious to “fight the Fed,” but the markets may have a different view this time.

Use rallies to raise cash, and rebalance portfolio risk accordingly.

We are looking to be heavy buyers of equities when the market forms a bottom, we just aren’t there as of yet.

Special Report: Panic Sets In As “Everything Must Go”

Note: All charts now updated for this mornings open.

The following is a report we generate regularly for our RIAPRO Subscribers. You can try our service RISK-FREE for 30-Days.

Headlines from the past four-days:

Dow sinks 2,000 points in worst day since 2008, S&P 500 drops more than 7%

Dow rallies more than 1,100 points in a wild session, halves losses from Monday’s sell-off

Dow drops 1,400 points and tumbles into a bear market, down 20% from last month’s record close

Stocks extend losses following 15-minute ‘circuit breaker’ halt, S&P 500 drops 8%

It has, been a heck of a couple of weeks for the market with daily point swings running 1000, or more, points in either direction.

However, given Tuesday’s huge rally, it seemed as if the market’s recent rout might be over with the bulls set to take charge? Unfortunately, as with the two-previous 1000+ point rallies, the bulls couldn’t maintain their stand.

But with the markets having now triggered a 20% decline, ending the “bull market,” according to the media, is all “hope” now lost? Is the market now like an “Oriental Rug Factory” where “Everything Must Go?”

It certainly feels that way at the moment.

“Virus fears” have run amok with major sporting events playing to empty crowds, the Houston Live Stock Show & Rodeo was canceled, along with Coachella, and numerous conferences and conventions from Las Vegas to New York. If that wasn’t bad enough, Saudi Arabia thought they would start an “oil price” war just to make things interesting.

What is happening now, and what we have warned about for some time, is that markets needed to reprice valuations for a reduction in economic growth and earnings.

It has just been a much quicker, and brutal, event than even we anticipated.

The questions to answer now are:

  1. Are we going to get a bounce to sell into?
  2. Is the bear market officially started – from a change in trend basis; and,
  3. Just how bad could this get?

A Bounce Is Likely

In January, when we discussed taking profits out of our portfolios, we noted the markets were trading at 3-standard deviations above their 200-dma, which suggested a pullback, or correction, was likely.

Now, it is the same comment in reverse. The correction over the last couple of weeks has completely reversed the previous bullish exuberance into extreme pessimism. On a daily basis, the market is back to oversold. Historically, this condition has been sufficient for a bounce. Given that the oversold condition (top panel) is combined with a very deep “sell signal” in the bottom panel, it suggests a fairly vicious reflexive rally is likely. The question, of course, is how far could this rally go.

Looking at the chart above, it is possible we could see a rally back to the 38.2%, or the 50% retracement level is the most probable. However, with the severity of the break below the 200-dma, that level will be very formidable resistance going forward. A rally to that level will likely reverse much of the current oversold condition, and set the market up for a retest of the lows.

The deep deviation from the 200-dma also supports this idea of a stronger reflexive rally. If we rework the analysis a bit, the 3-standard deviation discussed previously has now reverted to 4-standard deviation move below the 200-dma. The market may find support there, and with the deeply oversold condition, it again suggests a rally is likely.

Given that rally could be sharp, it will be a good opportunity to reduce risk as the impact from the collapse in oil prices, and the shutdown of the global supply chain, has not been fully factored in as of yet.

The following chart is a longer-term analysis of the market and is the format we use for “onboarding” our clients into their allocation models. (Vertical black lines are buy periods)

The triggering of the “sell signals” suggests we are likely in a larger correction process. With the “bull trend” line now broken, a rally toward the 200-dma, which is coincident with the bull trend line, will likely be an area to take additional profits, and reduce risk accordingly.

The analysis becomes more concerning as we view other time frames.

Has A Bear Market Started?

On a weekly basis, the rising trend from the 2016 lows is clear. The market has NOW VIOLATED that trend, which suggests a “bear market” has indeed started. This means investors should consider maintaining increased cash allocations in portfolios currently. With the two longer-term sell signals, bottom panels, now triggered, it suggests that whatever rally may ensue short-term will likely most likely fail. (Also a classic sign of a bear market.)

With the market oversold on a weekly basis, a counter-trend, or “bear market” rally is likely. However, as stated, short-term rallies should be sold into, and portfolios hedged, until the correction process is complete.

With all of our longer-term weekly “sell signals” now triggered from fairly high levels, it suggests the current selloff is much like what we saw in 2015-2016. (Noted in the chart above as well.) In other words, we will see a rally, followed by a secondary failure to lower lows, before the ultimate bottom is put in. If the market fails to hold current levels, the 2018 lows are the next most likely target.

Just How Bad Can It Get?

The idea of a lower bottom is also supported by the monthly data.

NOTE: Monthly Signals Are ONLY Valid At The End Of The Month.

On a monthly basis, sell signals have also been triggered, but we will have to wait until the end of the month for confirmation. However, given the depth of the decline, it would likely take a rally back to all-time highs to reverse those signals. This is a very high improbability.

Assuming the signals remain, there is an important message being sent, as noted in the top panel. The “negative divergence” of relative strength has only been seen prior to the start of the previous two bear markets, and the 2015-2016 slog. While the current sell-off resembles what we saw in late 2015, there is a risk of this developing into a recessionary bear market later this summer. The market is very close to violating the 4-year moving average, which is a “make or break” for the bull market trend from the 2009 lows.

How bad can the “bear market” get? If the 4-year moving average is violated, the 2018 lows become an initial target, which is roughly a 30% decline from the peak. However, the 2016 lows also become a reasonable probability if a “credit event” develops in the energy market which spreads across the financial complex. Such a decline would push markets down by almost 50% from the recent peak, and not unlike what we saw during the previous two recessions.

Caution is advised.

What We Are Thinking

Since January, we have been regularly discussing taking profits in positions, rebalancing portfolio risks, and, most recently, moving out of areas subject to slower economic growth, supply-chain shutdowns, and the collapse in energy prices. This led us to eliminate all holdings in international, emerging markets, small-cap, mid-cap, financials, transportation, industrials, materials, and energy markets. (RIAPRO Subscribers were notified real-time of changes to our portfolios.)

While there is “some truth” to the statement “that no one” could have seen the fallout of the “coronavirus” being escalated by an “oil price” war, there has been mounting risks for quite some time from valuations, to price deviations, and a complete disregard of risk by investors. While we have been discussing these issues with you, and making you aware of the risks, it was often deemed as “just being bearish” in the midst of a “bullish rally.” However, it is managing these types of risks, which is ultimately what clients pay advisors for.

It isn’t a perfect science. In times like these, it gets downright messy. But this is where working to preserve capital and limit drawdowns becomes most important. Not just from reducing the recovery time back to breakeven, but in also reducing the “psychological stress” which leads individuals to make poor investment decisions over time.

Given the extreme oversold and deviated measures of current market prices, we are looking for a reflexive rally that we can further reduce risk into, add hedges, and stabilize portfolios for the duration of the correction. When it is clear, the correction, or worse a bear market, is complete, we will reallocate capital back to equities at better risk/reward measures.

We highly suspect that we have seen the highs for the year. Most likely,,we are moving into an environment where portfolio management will be more tactical in nature, versus buying and holding. In other words, it is quite probable that “passive investing” will give way to “active management.”

Given we are longer-term investors, we like the companies we own from a fundamental perspective and will continue to take profits and resize positions as we adjust market exposure accordingly. The biggest challenge coming is what to do with our bond exposures now that rates have gotten so low OUTSIDE of a recession.

But that is an article for another day.

As we have often stated, “risk happens fast.”

Special Report: S&P 500 – Bounce Or Bull Market

Headlines from the past two days:

Dow sinks 2,000 points in worst day since 2008, S&P 500 drops more than 7%

Dow rallies more than 1,100 points in a wild session, halves losses from Monday’s sell-off

Actually its been a heck of a couple of weeks for the market with daily point swings running 1000, or more, points in either direction.

However, given Tuesday’s huge rally, is the market’s recent rout over with the bulls set to take charge? Or is this just a reflexive rally, with a retest of lows set to come?

Let’s take a look at charts to see what we can determine.

Daily

On a daily basis, the market is back to oversold. Historically, this condition has been sufficient for a bounce. Given that the oversold condition (top panel) is combined with a very deep “sell signal” in the bottom panel, it suggested a fairly vicious reflexive rally was likely. The question, of course is how far could this rally go.

Looking at the chart above, it is quite possible we could well see a rally back to the 32.8%, or even the 50% retracement level which is where the 200-dma currently resides. A rally to that level will likely reverse much of the current oversold condition and set the market up for a retest of the lows.

This idea of a stronger reflexive rally is also supported by the deep deviation from the 200-dma. If we rework the analysis a bit, the 3-standard deviation discussed previously has now reverted to 2-standard deviations below the 200-dma. The market found support there, and with the deep oversold condition it again suggests a rally to the 200-dma is likely.

Given that rally could be sharp, it will likely be a good opportunity to reduce risk as the impact from the collapse in oil prices and the shutdown of the global supply chain has not been fully factored in as of yet.

The following chart is a longer-term analysis of the market and is the format we use for “onboarding” our clients into their allocation models. (Vertical black lines are buy periods)

The triggering of the “sell signals” suggests we are likely in a larger correction process. With the “bull trend” line now broken, a rally back to toward the 200-dma, which is coincident with the bull trend line, will likely be an area to take profits and reduce risk accordingly.

The analysis becomes more concerning as we view other time frames.

Weekly

On a weekly basis, the rising trend from the 2016 lows is clear. The market has NOW VIOLATED that trend, which suggests maintaining some allocation to cash in portfolios currently. With the two longer-term sell signals, bottom panels, now triggered, it suggests that whatever rally may ensue short-term will likely fail.

The market is getting oversold on a weekly basis which does suggest a counter-trend rally is likely. However, as stated, short-term rallies should likely be sold into, and portfolios hedged, until the correction process is complete.

With all of our longer-term weekly “sell signals” now triggered from fairly high levels, it suggests the current selloff is much like what we saw in 2015-2016. (Noted in chart above as well.) In other words, we will see a rally, a failure to lower lows, before the ultimate bottom is put in.

Monthly

The idea of a lower bottom is also supported by the monthly data.

On a monthly basis, sell signals have also been triggered. HOWEVER, these signals must remain through the end of the month to be valid. These monthly signals are “important,” and one of the biggest concerns, as noted in the top panel, is the “negative divergence” of relative strength which was only seen prior to the start of the previous two bear markets, and the 2015-2016 slog. Again, the current sell-off resembles what we saw in late 2015, but there is a risk of this developing into a recessionary bear market later this summer. Caution is advised.

What We Are Thinking

Since January we have been taking profits in positions, rebalancing portfolio risks, and recently moving out of areas subject to slower economic growth, a supply-chain shut down, and the collapse in energy prices. (We have no holdings in international, emerging markets, small-cap, mid-cap, financial or energy currently.)

We are looking for a rally that can hold for more than one day to add some trading exposure for a move back to initial resistance levels where we will once again remove those trades and add short-hedges to the portfolio.

We highly suspect that we have seen the highs for the year, so we will likely move more into a trading environment in portfolios to add some returns while we maintain our longer-term holdings and hedges.

Given we are longer-term investors, we like the companies we own from a fundamental perspective and will continue to take profits and resize positions as we adjust market exposure accordingly. The biggest challenge coming is what to do with our bond exposures now that rates have gotten so low OUTSIDE of a recession.

We will keep you updated accordingly.

Special Report: S&P 500 Plunges On Coronavirus Impact

Dow plunges 1,000 points on coronavirus fears, 3.5% drop is worst in two years

“Stocks fell sharply on Monday as the number of coronavirus cases outside China surged, stoking fears of a prolonged global economic slowdown from the virus spreading. – CNBC

According to CNBC’s logic, the economy was perfectly fine on Friday, even though the market sold off then as well. However, over the weekend, stocks are plunging because the virus is now important?

No, this has been a correction in the making for the past several weeks that we have been discussing in our weekly market updates. Here was what we posted yesterday morning:

  • As noted last week: “With the market now trading 12% above its 200-dma, and well into 3-standard deviations of the mean, a correction is coming.” That correction started last Friday.
  • Currently, there is a strong bias to “buy the dip” of every corrective action. We recognize this and given the S&P 500 hit initial support on Friday we did add 1/2 position of VOOG to the Dynamic Model. The model is underallocated to equities and has a short hedge so we are taking this opportunity to add slowly. However, we suspect there is more to this corrective action to come this week.
  • As noted previously, extensions to this degree rarely last long without a correction. There is more work to be done before the overbought and extended condition is corrected. We will look to add to our holdings during that process.

While the correction occurred all in one day, which wasn’t our preference, it nonetheless set the markets up for a short-term bounce. We highly suggest using that bounce to rebalance portfolio risks accordingly.

Daily

On a daily basis, the market is back to oversold. Historically, this condition has been sufficient for a bounce. The difference, however, is the current oversold condition (top panel) is combined with a “sell signal” in the bottom panel. This suggests that any rally in the markets over the next few days should be used to reduce equity risk, raise cash, and add hedges.

If we rework the analysis a bit, the 3-standard deviation discussed previously is in the correction process. However, with the break of the 50-dma, uptrend channel, and triggering a short-term sell signal, the 200-dma comes into focus as important support.

As with the chart above, the market is oversold on a short-term basis, and a rally from current support back to the 50-dma is quite likely.

Again, that rally should be used to reduce risk.

The following chart is a longer-term analysis of the market and is the format we use for “onboarding” our clients into their allocation models. (Vertical black lines are buy periods)

Notice that while the market has been rising since early 2016, the momentum indicators are extremely stretched. Historically, such divergences result in markedly lower asset prices. In the short-term, as noted above, the market remains confined to a rising trend which is denoted by the trend channel. At this juncture, the market has not violated any major support points and does not currently warrant a drastically lower exposure to risk. However, if the “sell signals” are triggered, it will suggest a larger “reduction” of risk.

The analysis becomes more concerning as view other time frames.

Weekly

On a weekly basis, the rising trend from the 2016 lows is clear. The market has not violated that trend currently, which suggests maintaining some allocation to equity risk in portfolios currently. However, the two longer-term sell signals, bottom panels, are closing. If they both confirm, it will suggest a more significant correction process is forming.

The market is still very overbought on a weekly basis which confirms the analysis above that short-term rallies should likely be sold into, and portfolios hedged, until the correction process is complete.

Monthly

On a monthly basis, the bulls remain in control currently, which keeps our portfolios primarily allocated to equity risk. As we have noted previously, the market had triggered a “buy” signal in October of last year as the Fed “repo” operations went into overdrive. These monthly signals are “important,” but it won’t take a tremendous decline to reverse those signals. It’s okay to remain optimistic short-term, just don’t be complacent.

Don’t Panic Sell

The purpose of the analysis above is to provide you with the information to make educated guesses about the “probabilities” versus the “possibilities” of what could occur in the markets over the months ahead.

It is absolutely “possible” the markets could find a reason to rally back to all-time highs and continue the bullish trend. (For us, such would be the easiest and best outcome.)

However, the analysis currently suggests the risks currently outweigh potential reward and a deeper correction is the most “probable” at this juncture.

Don’t take that statement lightly.

I am suggesting reducing risk opportunistically, and being pragmatic about your portfolio, and your money. Another 50% correction is absolutely possible, as shown in the chart below.

(The chart shows ever previous major correction from similar overbought conditions on a quarterly basis. A similar correction would currently entail a 58.2% decline.)

So, what should you be doing now. Here are our rules that we will be following on the next rally.

  1. Move slowly. There is no rush in adding equity exposure to your portfolio. Use pullbacks to previous support levels to make adjustments.
  2. If you are heavily UNDER-weight equities, DO NOT try and fully adjust your portfolio to your target allocation in one move. This could be disastrous if the market reverses sharply in the short term. Again, move slowly.
  3. Begin by selling laggards and losers. These positions are dragging on performance as the market rises and tends to lead when markets fall. Like “weeds choking a garden,” pull them.
  4. Add to sectors, or positions, that are performing with, or outperforming the broader market.
  5. Move “stop-loss” levels up to current breakout levels for each position. Managing a portfolio without “stop-loss” levels is like driving with your eyes closed.
  6. While the technical trends are intact, risk considerably outweighs the reward. If you are not comfortable with potentially having to sell at a LOSS what you just bought, then wait for a larger correction to add exposure more safely. There is no harm in waiting for the “fat pitch” as the current market setup is not one.
  7. If none of this makes any sense to you – please consider hiring someone to manage your portfolio for you. It will be worth the additional expense over the long term.

While we remain optimistic about the markets currently, we are also taking precautionary steps of tightening up stops, adding non-correlated assets, raising some cash, and looking to hedge risk opportunistically.

Everyone approaches money management differently. This is just our approach to the process of controlling risk.

We hope you find something useful in it.