Tag Archives: KO

McDonald’s, Not A Shelter In The Coming Storm

The amount of time and effort that investors spend assessing the risks versus the potential returns of their portfolio should shift as the economy and markets cycle over time. For example, when an economic recovery finally breaks the grip of a recession, and asset prices and valuations have fallen to average or below-average levels, price and economic risks are greatly diminished. That is not to say there is no risk, just less risk.  

Market and economic troughs are akin to the aftermath of a forest fire. After a fire has ravaged a forest, the risks for another fire are not zero, but they are below average. Counter-intuitively, it is at these points in time when people are most fearful of fire or, in the case of investing, most worried about losses. With reduced risks, investors during these times should be more focused on the better than average rewards offered by the markets and not as concerned with the risks entailed in reaping those rewards.

Conversely, in the ninth inning of a bull market when valuations are well above the norm, and the economy has expanded for a long period, investors need to shift focus heavily to the potential risks. That is not to say there are no more rewards to come, but the overwhelming risks are substantial, and they can result in a permanent loss of wealth. As human beings are prone to do, we often zig when we should zag.

In January, we wrote Gimme Shelter to highlight that risk can be hard to detect. Sure, high flying companies with massive price gains and repeated net losses like Tesla or Netflix are easy to spot. More difficult, though, are those tried and true value stocks of companies that have flourished for decades. Specifically, we provided readers with an in-depth analysis of Coca-Cola (KO). While KO is a name brand known around the world with a long record of dependable earnings growth, its stock price has greatly exceeded its fair value.

We did not say that KO is a sure-fire short sale or even a sell. Instead, we conveyed that when a significant market drawdown occurs, KO has a lot more risk than is likely perceived by most investors. Simply, it is not the place investors should seek shelter in a market storm as they may have in the past.

We now take the opportunity to discuss another “value” company that many investors may consider a stock market shelter or safe haven.

We follow in this series with a review of McDonald’s (MCD).

You Deserve a Break Today

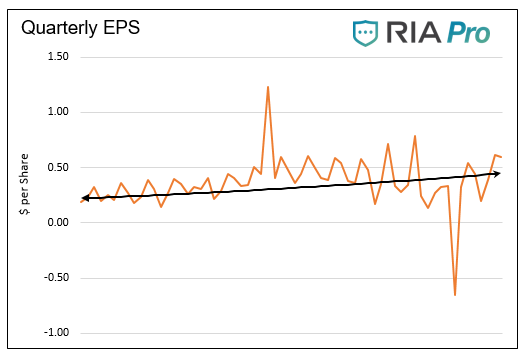
Please note the models and computations employed in this series use earnings per share and net income. Stock buybacks warp earnings per share (EPS), making earnings appear better than they would have without buybacks. The more positive result is simply due to a declining share count or denominator in the EPS equation. Net income and revenue data are unaffected by share buybacks and therefore deliver a more accurate appraisal of a company’s value.

Over the last ten years, the price of MCD has grown at a 13% annual rate, more than double its EPS, and over five times the rate of growth of its net income. The pace at which the growth of its stock price has surpassed its fundamentals has increased sharply over the last three years. During this period, the stock price has increased 46% annually, which is almost four times its EPS growth and more than six times the growth of its net income. 

Of further concern, revenues have declined 5% annually over the last three years, and the most recently reported annual revenues are now less than they were ten years ago when the U.S. and global GDP were only about 60% the size they are today. To pile on, the amount of debt MCD has incurred over the last ten years has increased by 355%.

MCD is a good company and, like KO, is one of the most well-known brands on the globe. Rated at BBB+, default or bankruptcy risk for MCD is remote, and because of its product line, it will probably see earnings hold up well during the next recession. For many, it is cheaper to eat at a McDonald’s restaurant than to cook at home. Although their operating business is valuable and dependable, those are not reasons to acquire or hold the stock. The issue is what price I am willing to pay in order to try to avoid a loss and secure a reasonable return.

Valuations

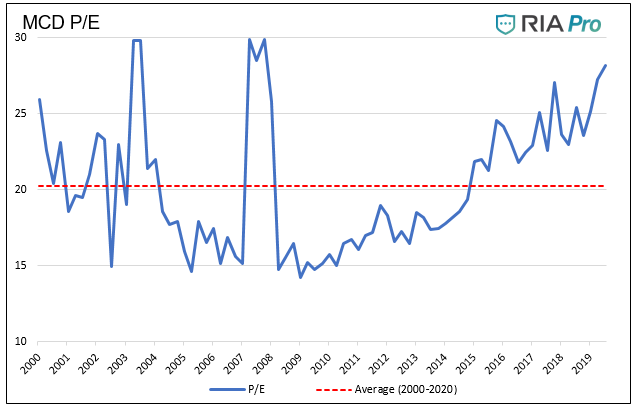
Using a simple price to earnings (P/E) valuation, as shown below, MCD’s current P/E for the trailing twelve months is 28, which is about 40% greater than its average over the last two decades.

The following graphs, tables, and data use the same models and methods we used to evaluate KO. For a further description, please read Gimme Shelter.    

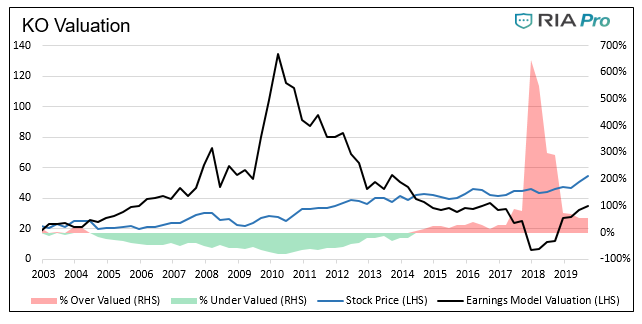
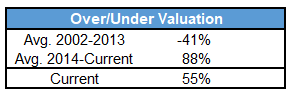
Currently, as shown below, MCD is trading 85% above its fair value using our earnings growth model. It is worth noting that MCD, as shown with green shading, was typically valued as cheap using this model. The table below the graph shows that, on average, from 2002-2013, the stock traded 13% below fair value.

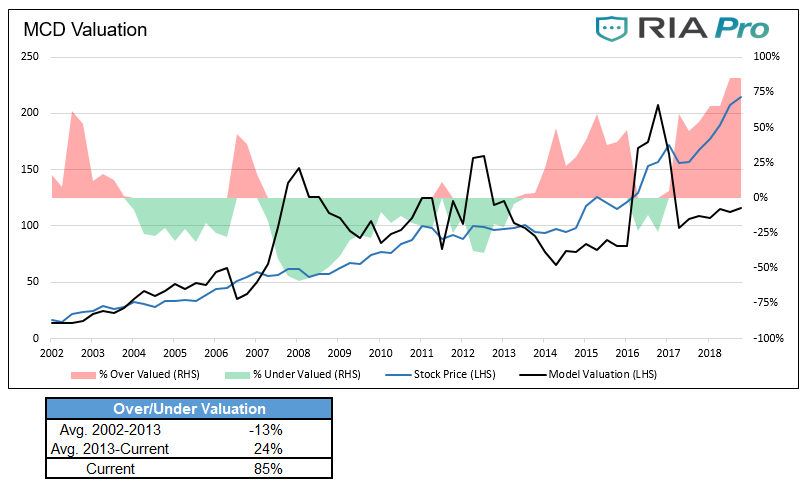
We support the graph and table above with a cash flow analysis. We assumed McDonald’s 5.6% long-run income growth rate to forecast earnings for the next 30 years. When these forecasted earnings are then discounted at the appropriate discounting rate of 7%, representing longer-term equity returns, MCD is currently overvalued by 72%.

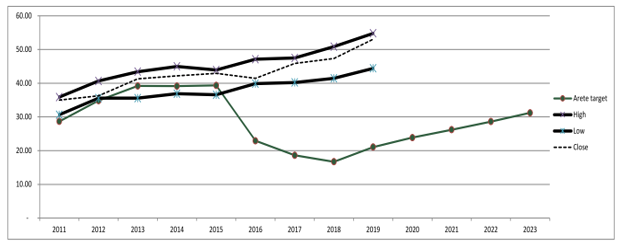
Lastly, as we did in Gimme Shelter, we asked our friend David Robertson from Arete Asset Management to evaluate MCD’s intrinsic value. His cash flow-based model assigns an intrinsic share price value of 97.27. Based on his work, MCD is currently overvalued by 124%.

Summary

Like KO, we are not making a recommendation on MCD as a short or a sell candidate, but by our analysis, MCD stock appears to be trading at a very high valuation. Much of what we see in large-cap stocks today, MCD included, is being driven by indiscriminate buying by passive investment funds. Such buying can certainly continue, but at some point, the gross overvaluations will correct as all extremes do.

Even if MCD were to “only” decline back to a normal valuation, the losses could be significant and might even exceed those of the benchmark index, the S&P 500. Now consider that MCD may correct beyond the average and could once again trade below fair value.  Even assuming MCD earnings are not hurt during a recession, the correction in its stock price to more reasonable levels could be painful for shareholders.

Gimme Shelter – Unlocked RIA Pro

Oh, a storm is threat’ning my very life today
If I don’t get some shelter oh yeah I’m gonna fade away
” – Rolling Stones

The graph below plots 15 years’ worth of quarterly earnings per share for a large, well known publicly traded company. Within the graph’s time horizon is the 2008 financial crisis and recession. Can you spot where it occurred? Hint- it is not the big dip on the right side of the graph or the outsized increase in the middle.

The purpose of asking the question is to point out that this company has very steady earnings growth with few instances of marked variation. The recession of 2008 had no discernable effect on their earnings. It is not a stretch to say the company’s earnings are recession-proof.

The company was formed in 1886 and is the parent of an iconic name brand known around the world. The company has matured into a very predictable company, as defined by steady earnings growth.

Fundamentally, this company has all the trappings of a safe and conservative investment the likes of which are frequently classified as defensive value stocks. These kinds of companies traditionally provide a degree of safety to investors during market drawdowns. Today, however, this company and many other “shelter stocks” are trading at valuations that suggest otherwise.

The following article was posted for RIA Pro subscribers last week.

For more research like this as well as daily commentary, investment ideas, portfolios, scanning and analysis tools, and our new 401K manager sign up today at RIA Pro and test drive our site for 30 days before being charged.

What is Value?

Determining the intrinsic value for an investment is a crucial baseline metric that investors must calculate if they want to properly determine whether the share price of a company is rich, cheap, or fair.

Investors use a myriad of computations, forecasts, and assumptions to calculate intrinsic value. As such, the intrinsic value for a company can vary widely based on numerous factors. 

We broadly define intrinsic value as the price that a rational investor would pay for the discounted cash flows, after expenses, of a company. More simply, what is the future stream of net income worth to you? As value investors, we prefer to invest in companies where the market value is below the intrinsic value. Doing so provides a margin of safety.

Jim Rogers, the former partner of George Soros, put it this way: “If you buy value, you won’t lose much even if you’re wrong.”

Calculating the intrinsic value with a high level of confidence is difficult, if not impossible, for some companies. For instance, many smaller biotech companies are formed to find a cure or treatment for one or two medical ailments. These firms typically lose money and burn through funding during the research and development (R&D) stage. If they successfully find a treatment or cure and financially survive the long FDA approval process, the shareholders are likely to receive hefty returns. The outcome may also be positive if they have a promising medication and a suitor with deep pockets buys the company. Because the outcome is uncertain, many biotech companies fail to maintain enough funding through the R&D stage.

Calculating an intrinsic value for a small biotech company can be like trying to estimate what you may win or lose at a roulette table. The number of potential outcomes is immense and highly dependent on your assumptions. 

Coca-Cola

At the other end of the spectrum, there are mature companies with very predictable cash flows, making intrinsic value calculations somewhat simple, as we will show.

Coca Cola (KO) is the company we referenced in the opening section. KO is one of the most well-known companies in the world, with an array of products sold in almost every country. KO is mature in its lifecycle with very dependable sales and earnings growth. The question we raise in this analysis is not whether or not KO is a good company, but whether or not its stock is worth buying.  To answer this question, we will determine its intrinsic value and compare it to the current value of the company.

The textbook way to calculate intrinsic value is to discount the future cash flows of the company. The calculation entails projecting net income for the next 30 years, discounting those annual income figures at an appropriate rate, and summing up the discounted cash flows. The answer is the present value of the total earnings stream based on an assumed earnings growth rate.

In our intrinsic value model for KO, we assumed an earnings growth rate of 4.5%, derived from its 20 year annualized earnings growth rate of 5.4% and it’s more recent ten year annualized growth rate of 2.9%. Recent trends argue that using 5.4% is aggressive. We used a discounting factor of 7% representing the historical return on equities. The model discounted 30 years of estimated future earnings.

The model, with the assumptions above, yields an intrinsic value of $157 billion. The current market cap, or value, of KO is $235 billion, meaning the stock is about 51% overvalued. Even if we assume the longer-term 20-year growth rate (5.4%), the stock is still 35% overvalued.

To confirm the analysis and illustrate it in a different format, we calculated what the stock price would be on a rolling basis had it grown in line with the prior rate of ten years of earnings growth. As shown in the graph and table below, the market value is currently 55% above the model’s valuation for KO.  The green and red areas highlight how much the stock was overvalued and undervalued.

To check our analysis, we enlisted our friend David Robertson from Arete Asset Management and asked him what intrinsic value his cash flow based model assigned to KO. The following is from David:

In looking at the valuation of KO, I see a couple of familiar patterns. The most obvious one is that the warranted value, based on a long-term model that discounts expected cash flows, is substantially below the current market value. Specifically, the warranted value per share is about $21, and nowhere near the mid-50s current market price. The biggest reason for this is that the discounted value of future investments has declined the last few years substantially due to lower economic returns and lower sustainable growth rates. In other words, as the company’s ability to generate future returns has diminished, its stock price has completely failed to capture the change.

The chart below from David compares his model’s current and future intrinsic value (Arete target) with the annual high, low, and closing price for KO.  David’s graph is very similar to what we highlighted above; KO has been trading at a steep premium to its intrinsic value for the last few years.

Lastly, we share a few more facts about KO’s valuations.

  • Revenues (sales) have been in decline since 2012
  • Price to Sales (6.99) is at a 20 year high and three times greater than the faster growing S&P 500
  • Price to Earnings (25.83 –trailing 12 mos.) is at a 17 year high
  • Price to Book (11.24) is at an 18 year high
  • Enterprise Value to EBITDA is at an eight-year high
  • Capital Expenditures are at a 15 year low and have declined rapidly over the last eight years
  • Book Value is at a ten year low
  • Debt has tripled over the last ten years while revenues and earnings have grown at about 15-20% over the same period

When Value Becomes Growth

In 2018 we wrote a six-part RIA Pro series called Value Your Wealth. Part of the series was devoted to the current divergence between value and growth stocks and the potential for outsized returns for value investors when the market reverts to the mean. In the article, we explored mutual funds and S&P sectors to show how value can be defined, but also how the title “value” is being mischaracterized.

One of the key takeaway from the series is that finding value is not always as easy as buying an ETF or fund with the word “value” in it. Nor, as we show with KO, can you rely on traditional individual stock mainstays to provide true value. Today’s value hunters must work harder than in years past.

Based on our model, KO traded below the model’s intrinsic value from 2003 through 2013 and likely in the years prior. As noted, its average discount to intrinsic value during this period was 41%. Since 2014 KO has traded well above its intrinsic value.

In 2014 passive investing strategies started to gain popularity. As this occurred, many companies’ share prices rose faster than their earnings growth. These stocks became connected to popular indexes and disconnected from their fundamentals. The larger the company and the more indexes they are in, the more that the wave of passive investing helped the share price. KO meets all of those qualifications. As the old saying goes, if you buy enough of them, the price will go up.

Summary

Buying “Value” is not as easy as buying shares in well-known companies with great brand names, proven track records, and relative earnings stability. As we exemplified with KO, great companies do not necessarily make great investments.

The bull market starting in 2009 is unique in many aspects. One facet that we have written extensively on is how so many companies have become overpriced due to indiscriminate buying from passive investment strategies. This has big implications for the next equity market drawdown as companies like KO may go down every bit as much or even more than the broader market.

Be careful where you seek shelter in managing your portfolio of stocks; it may not be the safe bunker that you think it is.  

In a follow-up article for RIA Pro, we will present similar analysis and expose more “value” companies.

Gimme Shelter

Oh, a storm is threat’ning my very life today
If I don’t get some shelter oh yeah I’m gonna fade away
” – Rolling Stones

The graph below plots 15 years’ worth of quarterly earnings per share for a large, well known publicly traded company. Within the graph’s time horizon is the 2008 financial crisis and recession. Can you spot where it occurred? Hint- it is not the big dip on the right side of the graph or the outsized increase in the middle.

The purpose of asking the question is to point out that this company has very steady earnings growth with few instances of marked variation. The recession of 2008 had no discernable effect on their earnings. It is not a stretch to say the company’s earnings are recession-proof.

The company was formed in 1886 and is the parent of an iconic name brand known around the world. The company has matured into a very predictable company, as defined by steady earnings growth.

Fundamentally, this company has all the trappings of a safe and conservative investment the likes of which are frequently classified as defensive value stocks. These kinds of companies traditionally provide a degree of safety to investors during market drawdowns. Today, however, this company and many other “shelter stocks” are trading at valuations that suggest otherwise.

What is Value?

Determining the intrinsic value for an investment is a crucial baseline metric that investors must calculate if they want to properly determine whether the share price of a company is rich, cheap, or fair.

Investors use a myriad of computations, forecasts, and assumptions to calculate intrinsic value. As such, the intrinsic value for a company can vary widely based on numerous factors. 

We broadly define intrinsic value as the price that a rational investor would pay for the discounted cash flows, after expenses, of a company. More simply, what is the future stream of net income worth to you? As value investors, we prefer to invest in companies where the market value is below the intrinsic value. Doing so provides a margin of safety.

Jim Rogers, the former partner of George Soros, put it this way: “If you buy value, you won’t lose much even if you’re wrong.”

Calculating the intrinsic value with a high level of confidence is difficult, if not impossible, for some companies. For instance, many smaller biotech companies are formed to find a cure or treatment for one or two medical ailments. These firms typically lose money and burn through funding during the research and development (R&D) stage. If they successfully find a treatment or cure and financially survive the long FDA approval process, the shareholders are likely to receive hefty returns. The outcome may also be positive if they have a promising medication and a suitor with deep pockets buys the company. Because the outcome is uncertain, many biotech companies fail to maintain enough funding through the R&D stage.

Calculating an intrinsic value for a small biotech company can be like trying to estimate what you may win or lose at a roulette table. The number of potential outcomes is immense and highly dependent on your assumptions. 

At the other end of the spectrum, there are mature companies with very predictable cash flows, making intrinsic value calculations somewhat simple, as we will show.

Coca-Cola

Coca Cola (KO) is the company we referenced in the opening section. KO is one of the most well-known companies in the world, with an array of products sold in almost every country. KO is mature in its lifecycle with very dependable sales and earnings growth. The question we raise in this analysis is not whether or not KO is a good company, but whether or not its stock is worth buying.  To answer this question, we will determine its intrinsic value and compare it to the current value of the company.

The textbook way to calculate intrinsic value is to discount the future cash flows of the company. The calculation entails projecting net income for the next 30 years, discounting those annual income figures at an appropriate rate, and summing up the discounted cash flows. The answer is the present value of the total earnings stream based on an assumed earnings growth rate.

In our intrinsic value model for KO, we assumed an earnings growth rate of 4.5%, derived from its 20 year annualized earnings growth rate of 5.4% and it’s more recent ten year annualized growth rate of 2.9%. Recent trends argue that using 5.4% is aggressive. We used a discounting factor of 7% representing the historical return on equities. The model discounted 30 years of estimated future earnings.

The model, with the assumptions above, yields an intrinsic value of $157 billion. The current market cap, or value, of KO is $235 billion, meaning the stock is about 51% overvalued. Even if we assume the longer-term 20-year growth rate (5.4%), the stock is still 35% overvalued.

To confirm the analysis and illustrate it in a different format, we calculated what the stock price would be on a rolling basis had it grown in line with the prior rate of ten years of earnings growth. As shown in the graph and table below, the market value is currently 55% above the model’s valuation for KO.  The green and red areas highlight how much the stock was overvalued and undervalued.

To check our analysis, we enlisted our friend David Robertson from Arete Asset Management and asked him what intrinsic value his cash flow based model assigned to KO. The following is from David:

In looking at the valuation of KO, I see a couple of familiar patterns. The most obvious one is that the warranted value, based on a long-term model that discounts expected cash flows, is substantially below the current market value. Specifically, the warranted value per share is about $21, and nowhere near the mid-50s current market price. The biggest reason for this is that the discounted value of future investments has declined the last few years substantially due to lower economic returns and lower sustainable growth rates. In other words, as the company’s ability to generate future returns has diminished, its stock price has completely failed to capture the change.

The chart below from David compares his model’s current and future intrinsic value (Arete target) with the annual high, low, and closing price for KO.  David’s graph is very similar to what we highlighted above; KO has been trading at a steep premium to its intrinsic value for the last few years.

Lastly, we share a few more facts about KO’s valuations.

  • Revenues (sales) have been in decline since 2012
  • Price to Sales (6.99) is at a 20 year high and three times greater than the faster growing S&P 500
  • Price to Earnings (25.83 –trailing 12 mos.) is at a 17 year high
  • Price to Book (11.24) is at an 18 year high
  • Enterprise Value to EBITDA is at an eight-year high
  • Capital Expenditures are at a 15 year low and have declined rapidly over the last eight years
  • Book Value is at a ten year low
  • Debt has tripled over the last ten years while revenues and earnings have grown at about 15-20% over the same period

When Value Becomes Growth

In 2018 we wrote a six-part RIA Pro series called Value Your Wealth. Part of the series was devoted to the current divergence between value and growth stocks and the potential for outsized returns for value investors when the market reverts to the mean. In the article, we explored mutual funds and S&P sectors to show how value can be defined, but also how the title “value” is being mischaracterized.

One of the key takeaway from the series is that finding value is not always as easy as buying an ETF or fund with the word “value” in it. Nor, as we show with KO, can you rely on traditional individual stock mainstays to provide true value. Today’s value hunters must work harder than in years past.

Based on our model, KO traded below the model’s intrinsic value from 2003 through 2013 and likely in the years prior. As noted, its average discount to intrinsic value during this period was 41%. Since 2014 KO has traded well above its intrinsic value.

In 2014 passive investing strategies started to gain popularity. As this occurred, many companies’ share prices rose faster than their earnings growth. These stocks became connected to popular indexes and disconnected from their fundamentals. The larger the company and the more indexes they are in, the more that the wave of passive investing helped the share price. KO meets all of those qualifications. As the old saying goes, if you buy enough of them, the price will go up.

Summary

Buying “Value” is not as easy as buying shares in well-known companies with great brand names, proven track records, and relative earnings stability. As we exemplified with KO, great companies do not necessarily make great investments.

The bull market starting in 2009 is unique in many aspects. One facet that we have written extensively on is how so many companies have become overpriced due to indiscriminate buying from passive investment strategies. This has big implications for the next equity market drawdown as companies like KO may go down every bit as much or even more than the broader market.

Be careful where you seek shelter in managing your portfolio of stocks; it may not be the safe bunker that you think it is.  

In a follow-up article for RIA Pro, we will present similar analysis and expose more “value” companies.