
On Wednesday, the Nasdaq fell by nearly 3%, the most significant decline in over two years. However, the Dow, representing more value stocks, was up over half a percent and set a record high. If the recent rotations out of technology, communications, and the largest market-cap stocks continue, the broad S&P 500 and the Nasdaq will likely decline. However, might the small cap, medium cap, and value stocks that have been lagging considerably do well? Conversely, might this stock rotation be a healthy pause in the uptrend, allowing the unsustainable breadth to normalize?
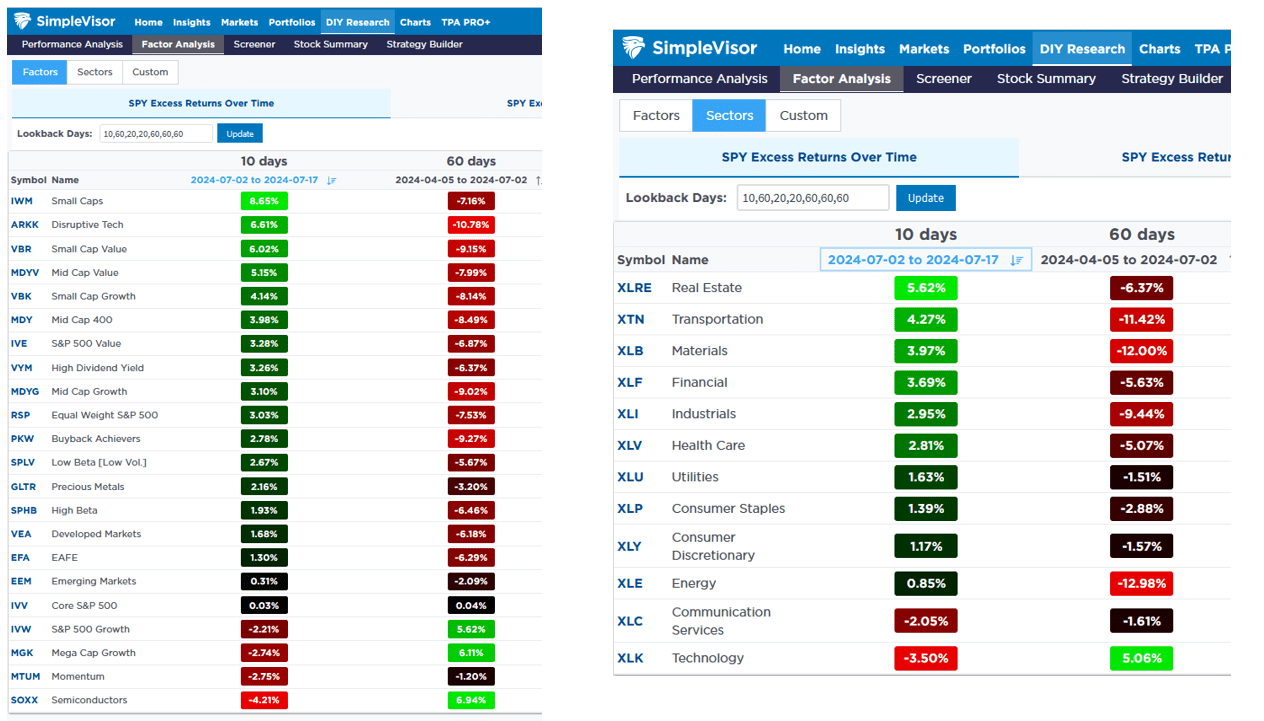
We use SimpleVisor to help us appreciate the performance of stock factors and sectors over the last ten trading days and the 60 days prior. The first graphics show stock factors and sectors’ excess returns versus the S&P 500. Simply, what underperformed in the prior 60 days (red) is outperforming in the last two weeks, and vice versa.
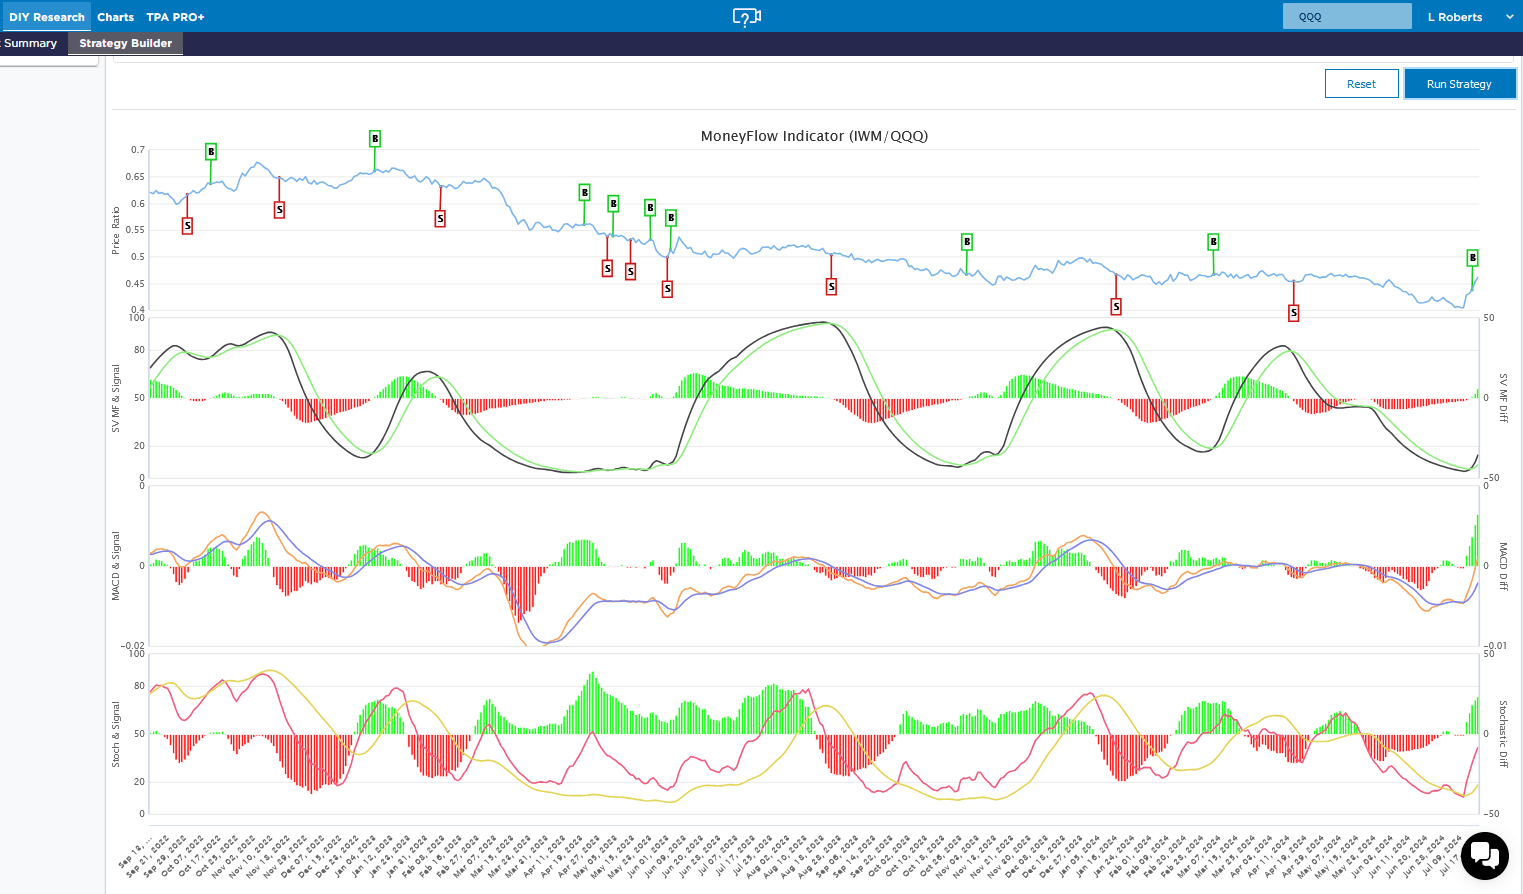
The lower graphic charts the price of the Russell small cap index (IWM) divided by the price of the Nasdaq (QQQ). Below the price ratio graph, SimpleVisor applies a few technical models. All three have recently flipped to a buy signal favoring IWM to QQQ. However, they have triggered similar buy signals in the past two years, which resolved themselves in consolidation, not meaningful IWM outperformance. Time will tell if this stock rotation is lasting.
What To Watch Today
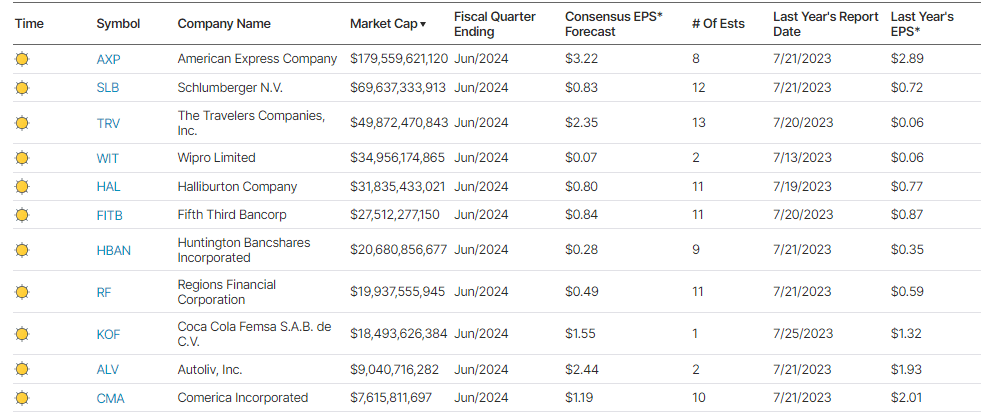
Earnings
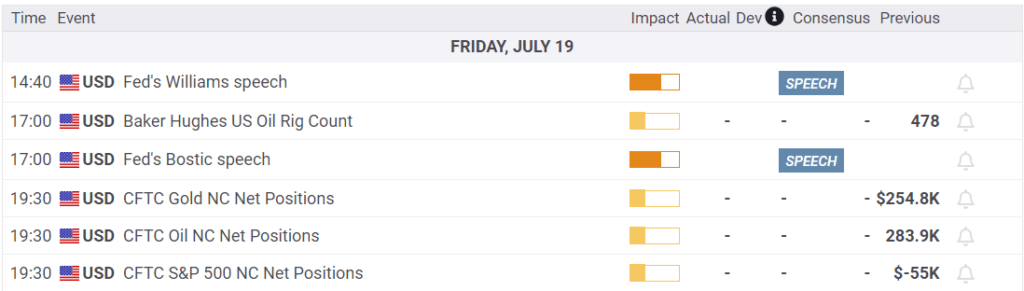
Economy
Market Trading Update
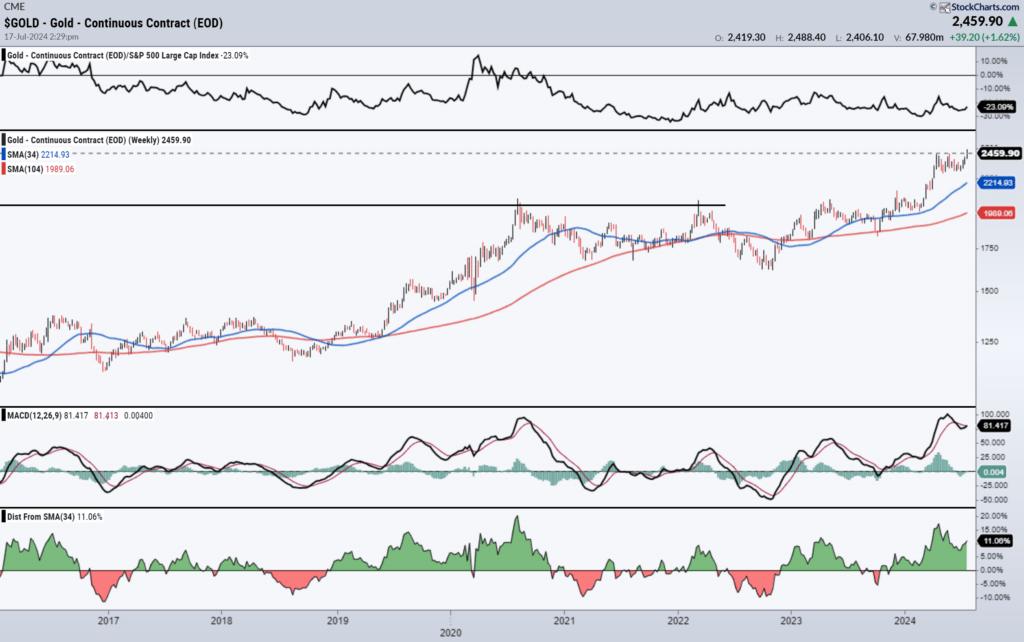
Yesterday’s update discussed the many sectors and markets trading well above their monthly risk/reward ranges. In particular, Gold and Gold Miners are trading at double-digit deviations from their long-term moving averages. Historically, when Gold, and by extension Gold Miners, are well deviated above their longer-term moving averages, as they are now, it has been a good opportunity to take profits and rebalance risk.
Gold has had an excellent move over the last few years, but with the MACD indicator very elevated, such suggests that performance may start to lag. Such does not mean that the price of gold will crash. However, as we saw in 2020, gold may go into a long period of consolidation where other assets perform better. As always, gold is a commodity with no fundamentals or dividend. The commodity traders on the exchanges solely determine its price. Therefore, from a risk management perspective, manage your position size accordingly and take profits as needed.

The Rising Unemployment Rate Is Signalling Trouble
The unemployment rate is a lagging economic indicator. Often, it doesn’t rise materially until a recession has started. This is important because one of the Fed’s mandated objectives is maximum employment. Per the Federal Reserve Act:
The Board of Governors of the Federal Reserve System and the Federal Open Market Committee shall maintain long run growth of the monetary and credit aggregates commensurate with the economy’s long run potential to increase production, so as to promote effectively the goals of maximum employment, stable prices, and moderate long-term interest rates.
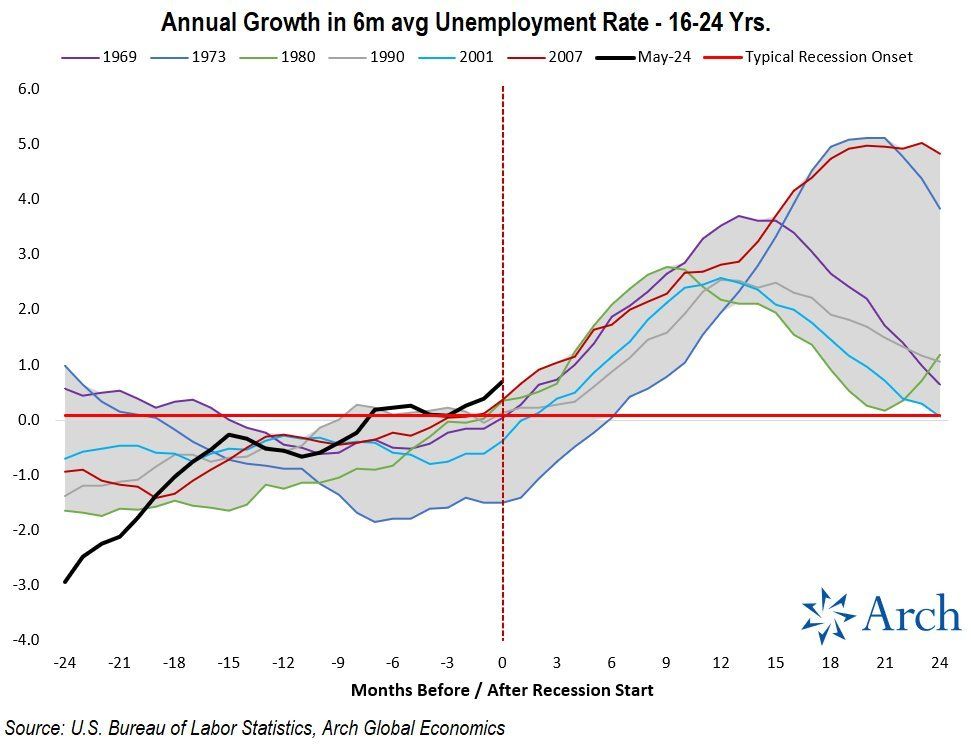
The graph below shows the six-month change in the unemployment rate of 16-24 year olds. Many of these job holders are in economically sensitive areas. As such, the employment trends in this age group tend to lead the broader employment data. The graph shows where the change in the unemployment rate for 16-24-year-olds was between two years before the last six recessions and two years after it started. The current rate is higher than the onset of the previous six recessions. The Fed may be worried that this graph and other labor indicators warn the Fed they have left Fed Funds too high for too long.
Update On Jobless Claims
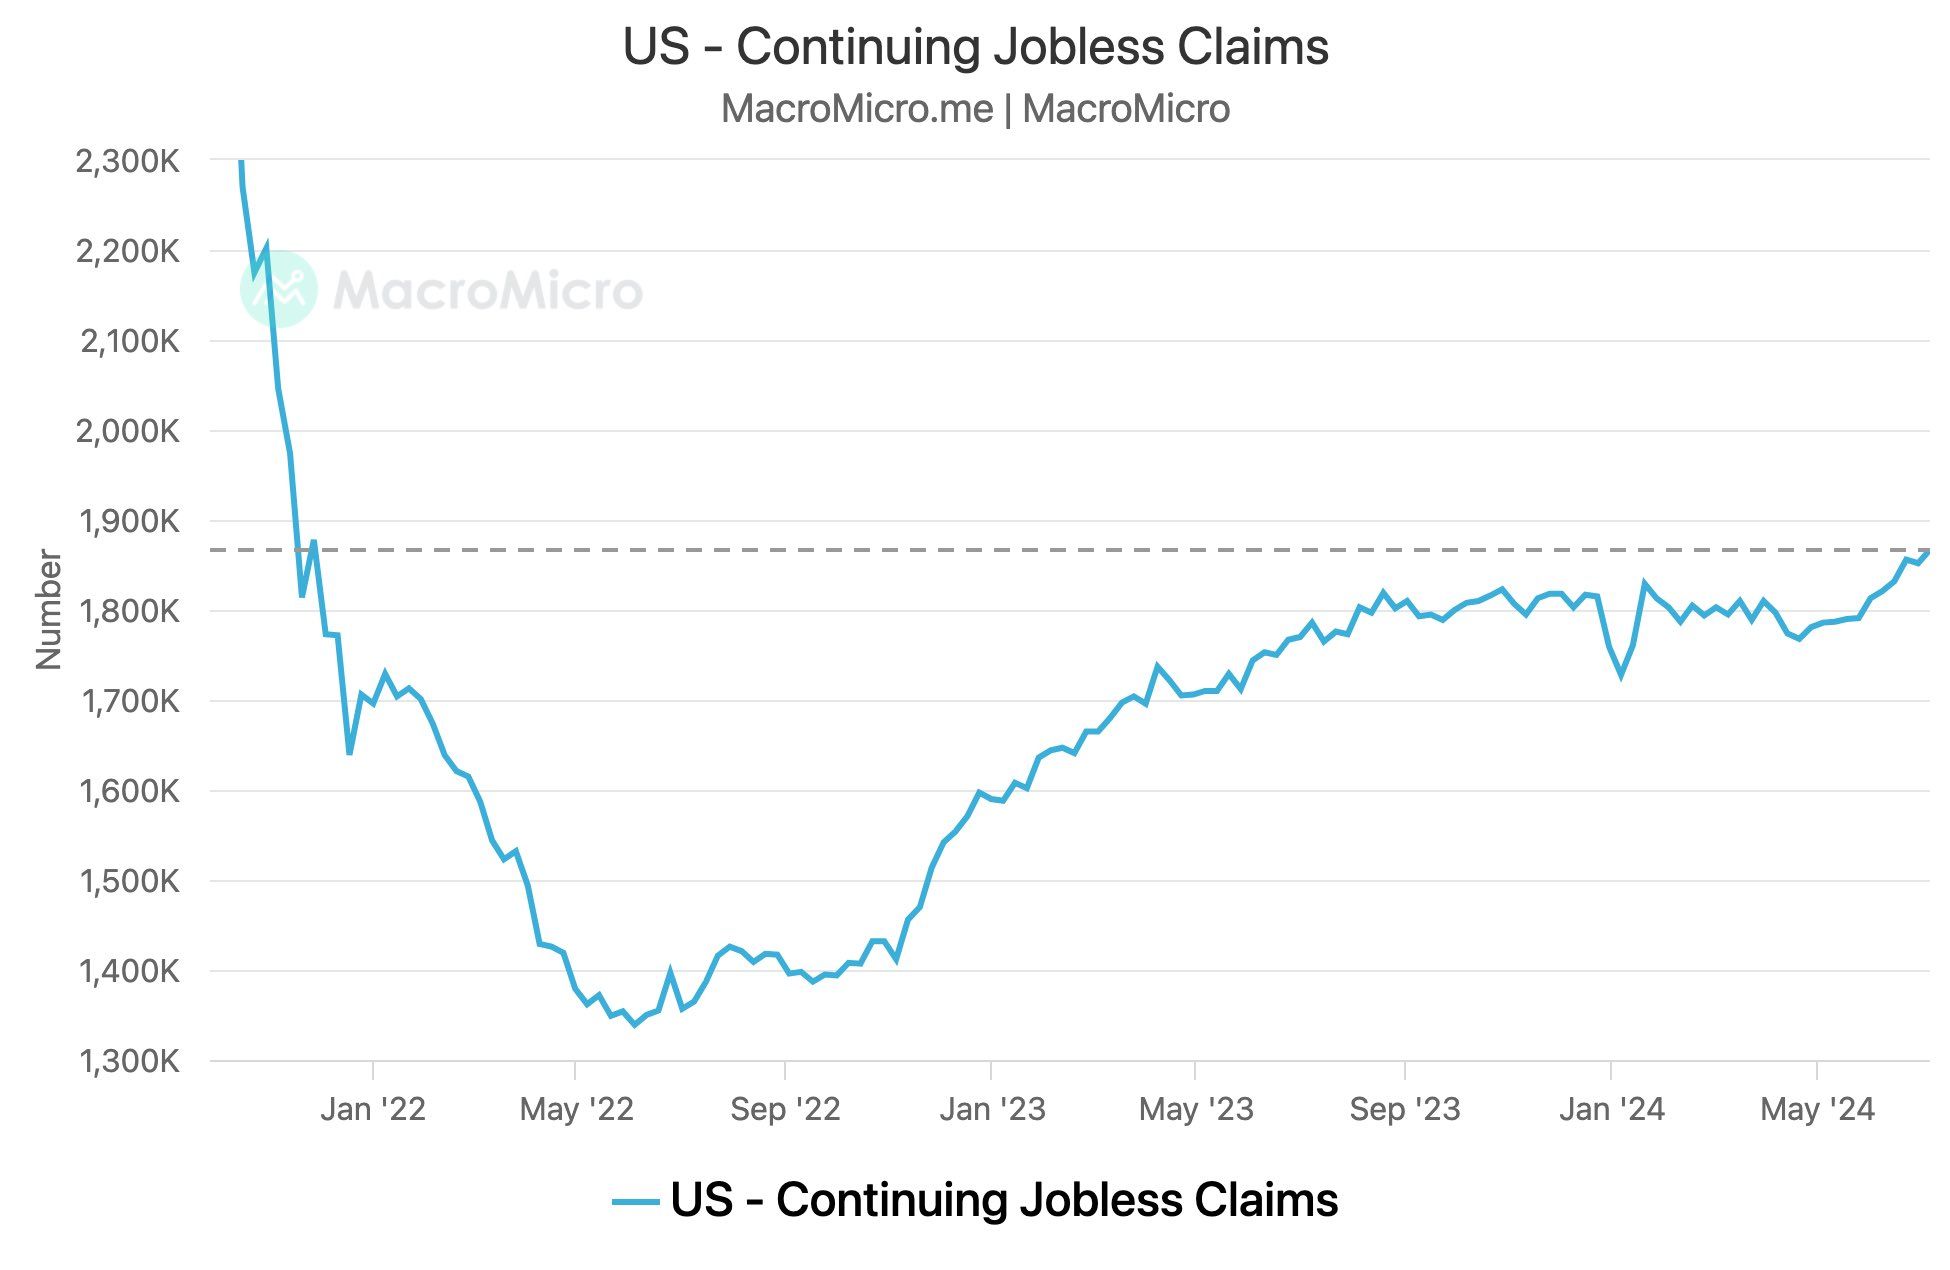
The importance of jobless claims is not what it used to be, as jobless claims benefits have not kept up with wages. Many recently fired employees can make much more money doing part-time or gig-economy jobs. While the absolute number of claims may not be comparable to the past, the trend is still noteworthy.
Jobless claims for the week were +243k, which is near a one-year high. A better measure of the health of the labor market is continuing or longer-term claims. This week’s 1.87 million longer-term jobless claims is the highest weekly figure since November 2021. This is a decent increase from the 1.847 million reported last week. However, while the trend is becoming concerning, anything less than 2 million longer-term jobless claims is consistent with a healthy labor market.
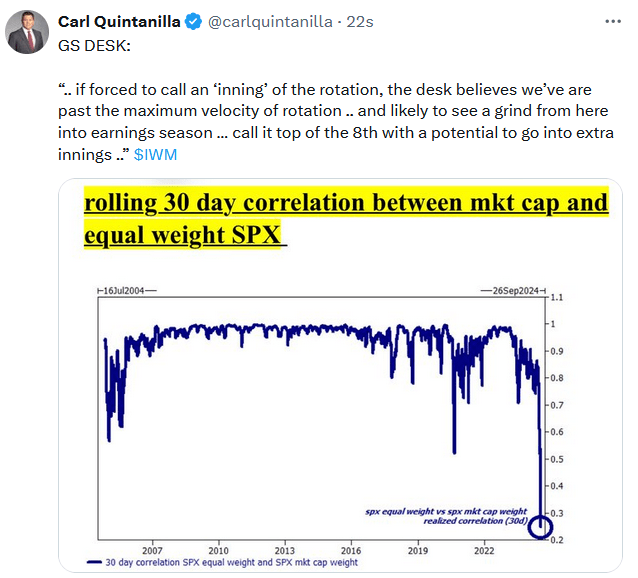
Tweet of the Day
“Want to achieve better long-term success in managing your portfolio? Here are our 15-trading rules for managing market risks.”
Please subscribe to the daily commentary to receive these updates every morning before the opening bell.
If you found this blog useful, please send it to someone else, share it on social media, or contact us to set up a meeting.

