
Part 1, Relative Rotation- Unlocking the Hidden Potential, reviews relative rotation strategies on pairs of securities and how understanding and assessing the relationship can help investors better manage their portfolios during bull and bear markets. Part 2 shares valuable tools that SimpleVisor subscribers can access to improve the odds of success using a relative rotation strategy.
SimpleVisor is an integrated investment management and research solution for seasoned and beginner “do-it-yourself” investors. For more information and a 30-day risk-free trial, click HERE.
In parenthesis throughout this article, we share the location of each tool within the SimpleVisor site.
Takeaways
- Finding stocks, sectors, or factors that are over or underperforming on a relative basis.
- When is the right time to rotate between sectors or factors?
- Using technical analysis to analyze pair trades.
- SimpleVisor can help you make the most of relative rotation.

Why Did We Choose MGK and VYM?
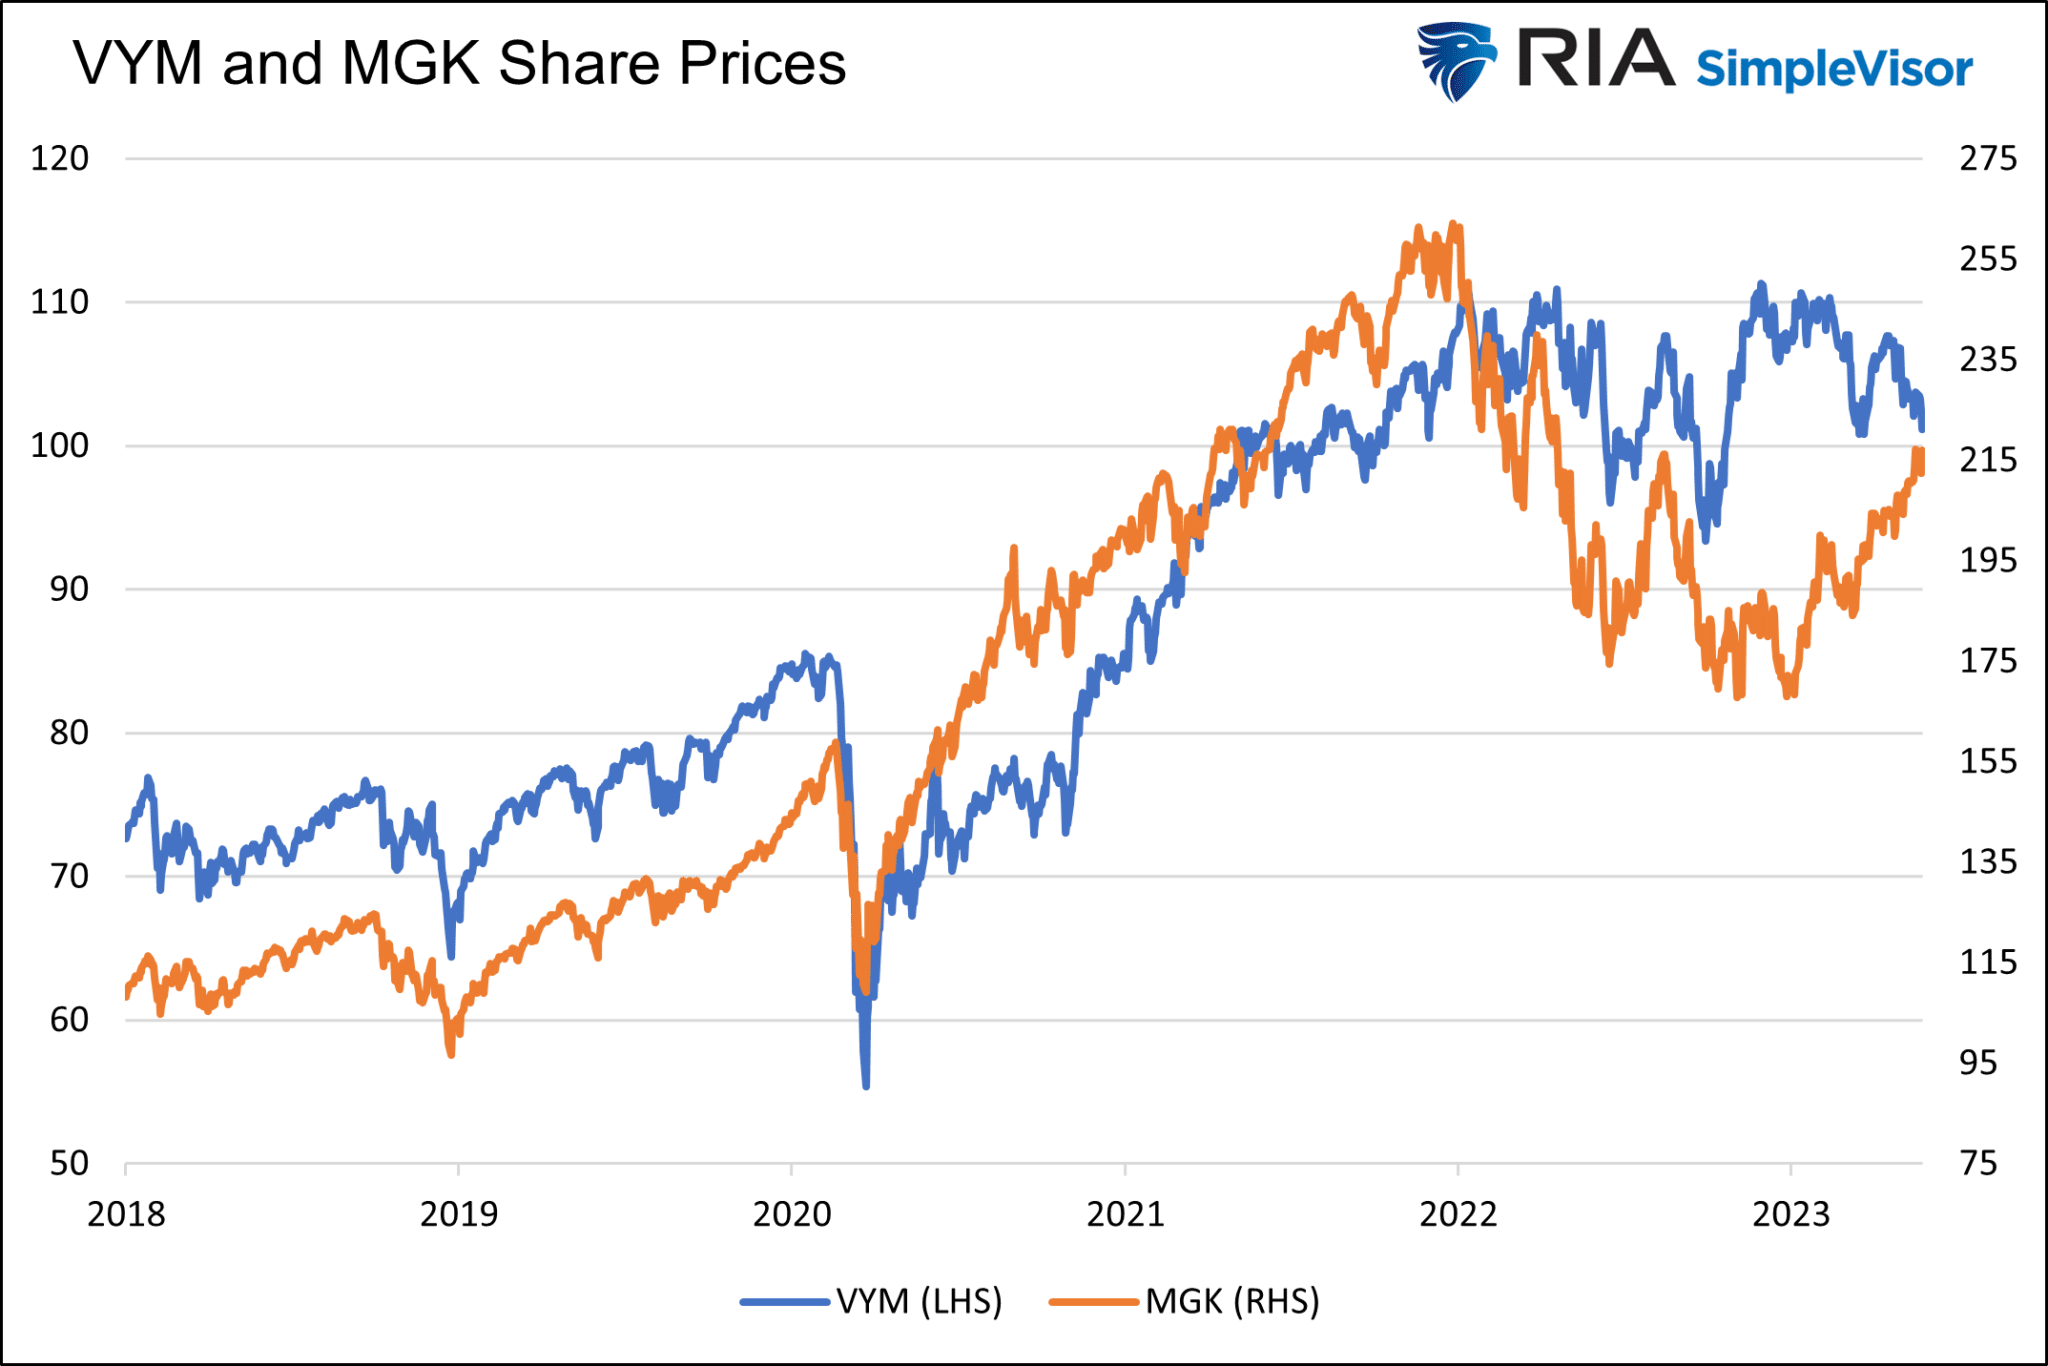
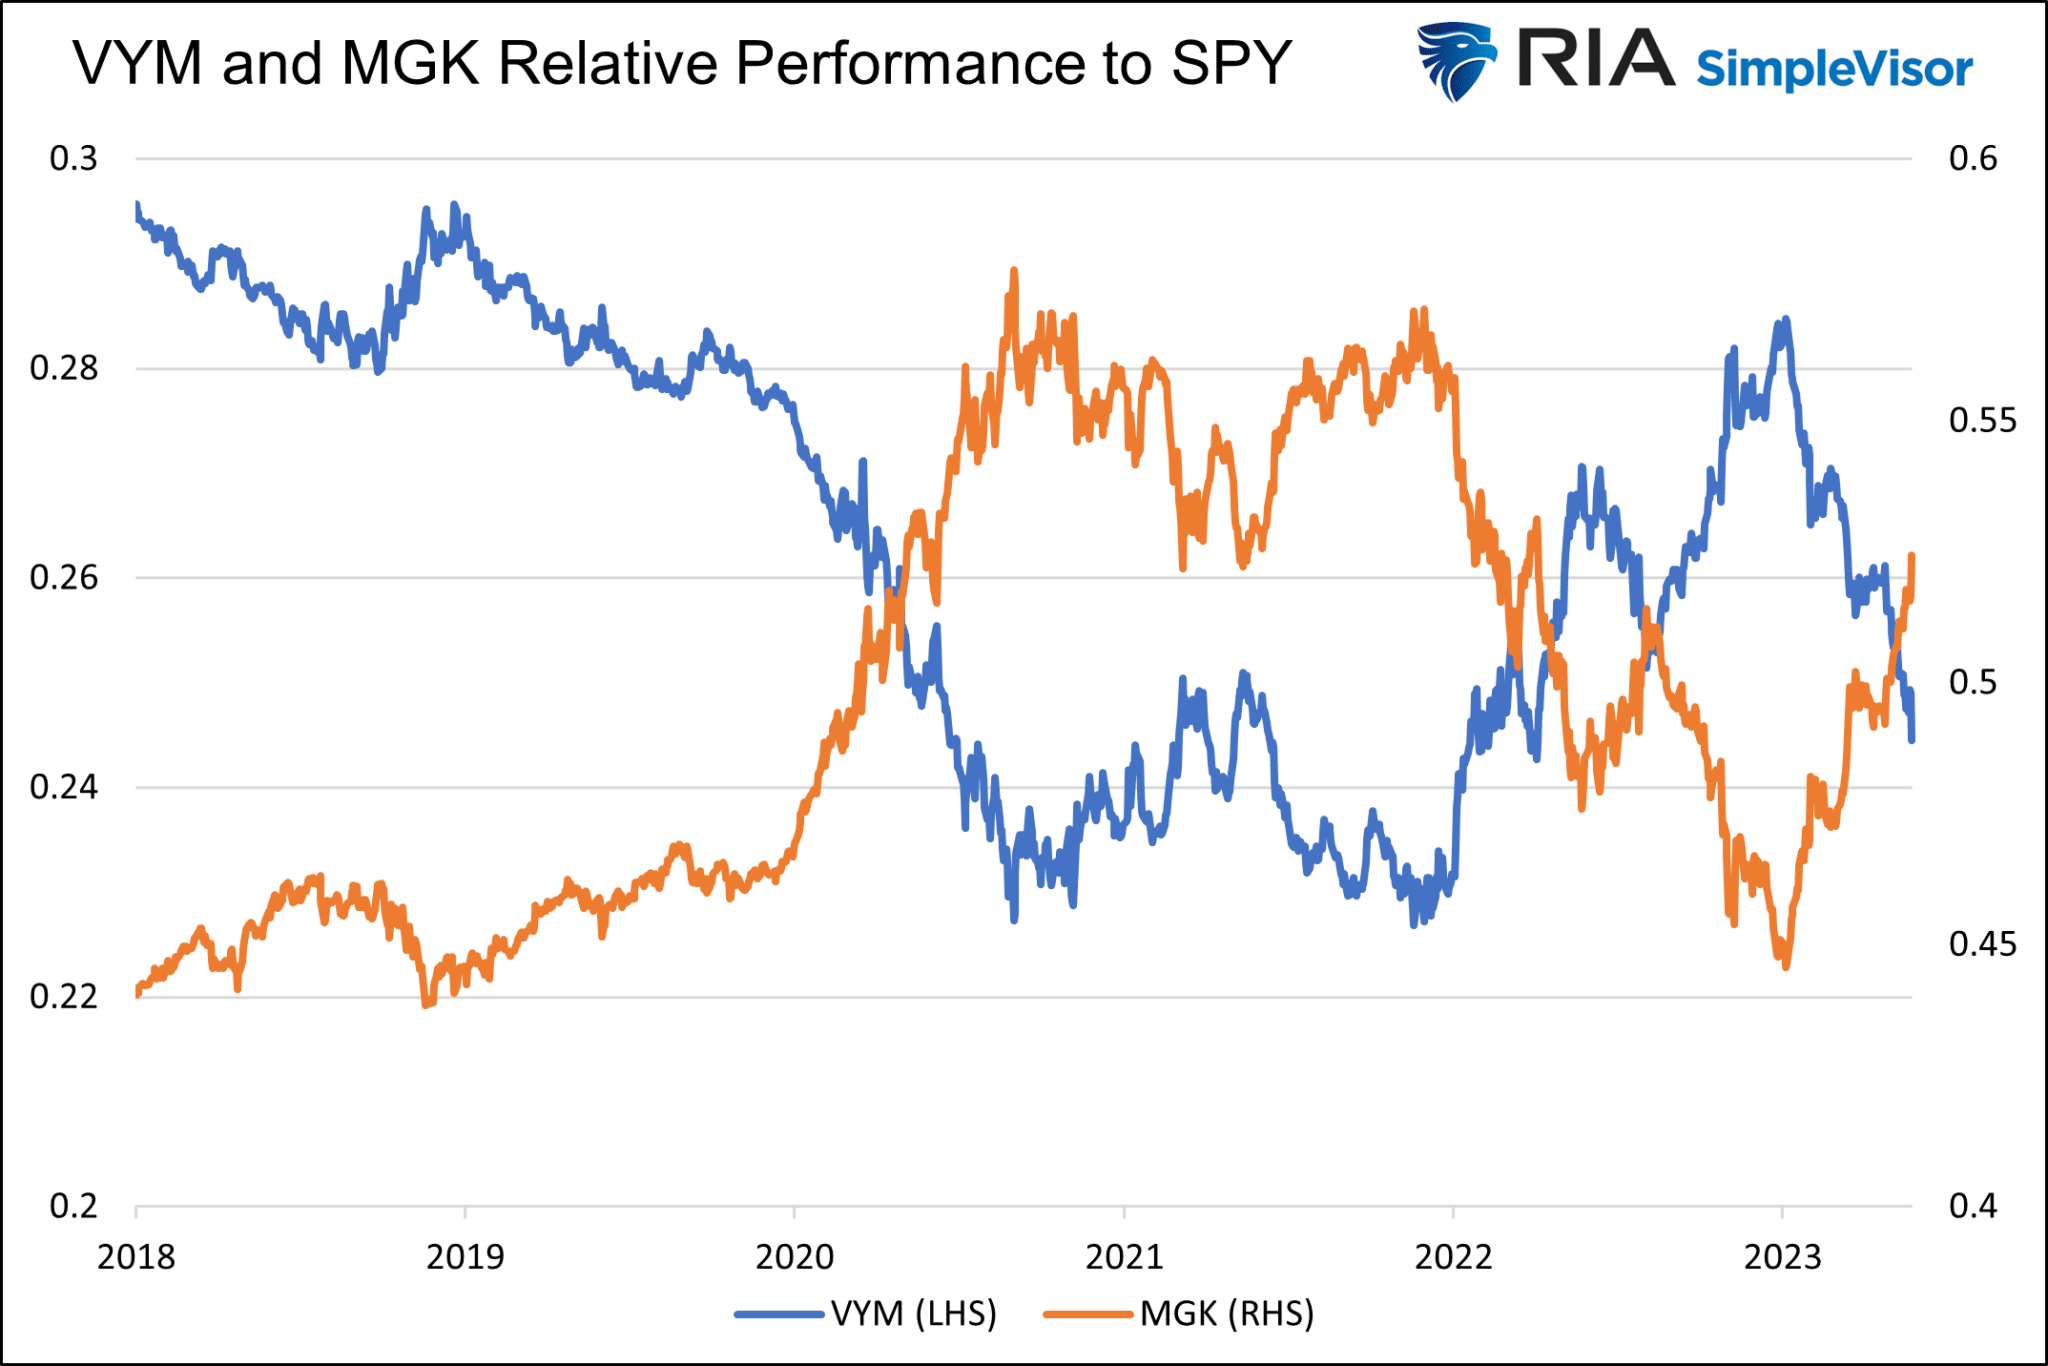
In part 1, we created a simple trading strategy that used two ETFs, the mega-cap growth ETF, MGK, and VYM, the high dividend yield ETF. We selected the pair because, at the time, their relative performance versus the S&P 500 had the most negative correlation across three different time frames. Let’s revisit the two graphs below.
The first graph, comparing the prices of the two ETFs, shows they tend to track each other well. The second shows their respective relative performance versus the S&P 500 are almost 100% opposite of each other.
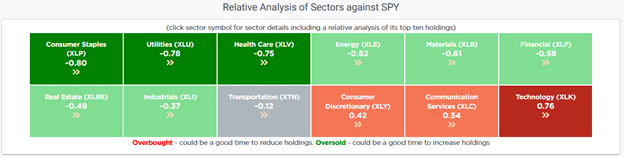
SimpleVisor has monitors to help appreciate how overbought or oversold sectors and factors are on a relative basis. For instance, the table below shows that the technology sector is very overbought on a relative basis, while staples, utilities, and healthcare are deeply oversold.
To determine the degree of relative overbought or oversold, we calculate the price ratio of said security to the S&P 500. We then compute a score using multiple technical studies. SimpleVisor also produces absolute scores which use the same technical analysis but solely on the price of one asset.
(Ideas – Relative Analysis- Sectors)
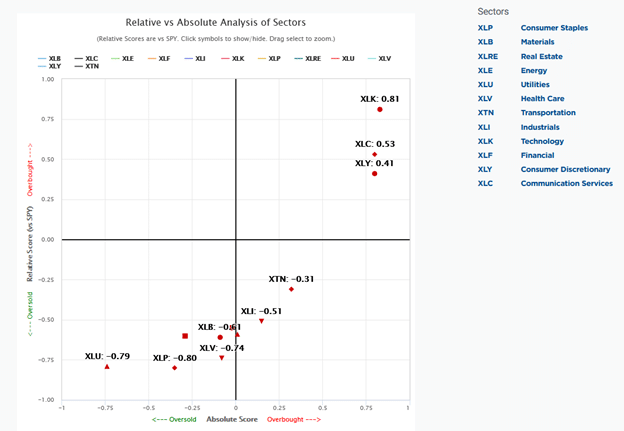
The scatter plot below highlights the combination of relative and absolute scores for each sector. The x-axis, denoting the relative scores, shows technology, communications, and consumer discretionary stocks are overperforming while most other sectors are underperforming on a relative basis.
(Ideas- Relative vs. Absolute)
SimpleVisor also presents the same chart using stock factors instead of sectors. As you might suspect, MGK is in the upper right corner, and VYM toward the lower left corner.
Finding Other ETF Pairs with SimpleVisor
We can use the screen illustrations above to help guide us in our relative rotation decisions. But to further quantify strongly inverse relationships, SimpleVisor has another tool.
The following table shows the correlation between 22 stock factors over the last 252 trading days. We highlight that MGK and VYM have the most robust negative correlation of -0.93. The correlations are equally impressive at -.89 and -.96, respectively, using shorter 126 and 21-day periods.
(Research – Factor Analysis)
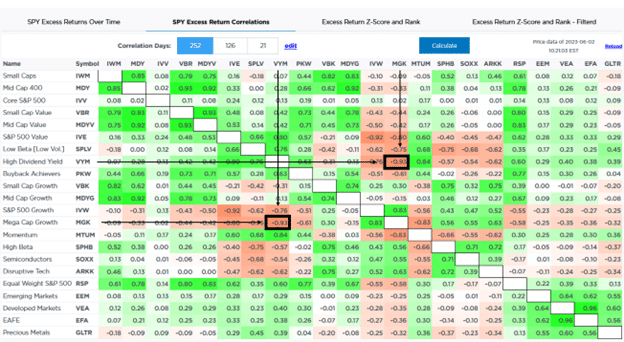
Given that MGK is exceptionally overbought and VYM extremely oversold, and they have a powerful negative correlation, we have a high degree of confidence that if VYM comes back into favor versus the market, MGK will likely underperform the market.

When Should We Rotate?
With strong candidates for a relative rotation trade, we need to figure out when a rotation may occur.
The following graph charts the price ratio of MGK versus VYM and includes three technical studies.
(Research – Money Flow – SV Money Flow Two Symbol Analysis)
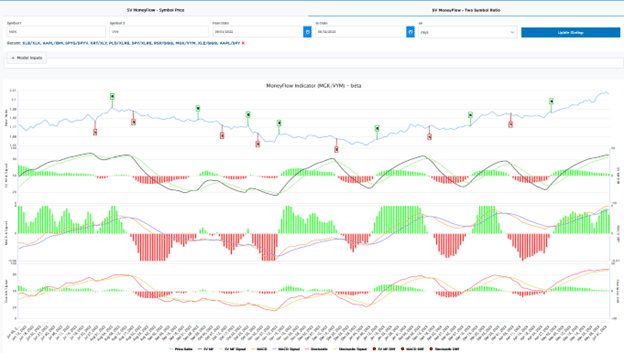
The top graph shows that the price ratio of MGK versus VYM has increased from 1.55 to 2.10 since January.
The first chart below the ratio graph is our proprietary stochastic study. Like the other two stochastic studies below it, a buy signal (buy MGK/sell VYM) triggers when both lines are low, crossing, and turning upward. The red and green bars within the three graphs emphasize the buy/sell indications. Green signals a buy signal, and red a sell signal.
The most reliable signals tend to occur when the three indicators confirm each other, and the lines in all three graphs cross at very high or low levels.
In this case, they are at high levels and ready to cross. While a cross and the sell signal is inevitable, it doesn’t mean a profitable rotation is at hand. The prior two sell signals resulted in a consolidation of the ratio. If the price trend of the relationship continues, the next sell signal may also result in consolidation, leaving little benefit to rotating positions.
As we discussed above, long-term trends can persist despite extreme relative performance differences.
Pick Your Rotation Pairs
Thus far, we have only shown analysis for sectors and factors. SimpleVisor also allows users to select any two stocks or ETFs and see how they perform relative to each other.
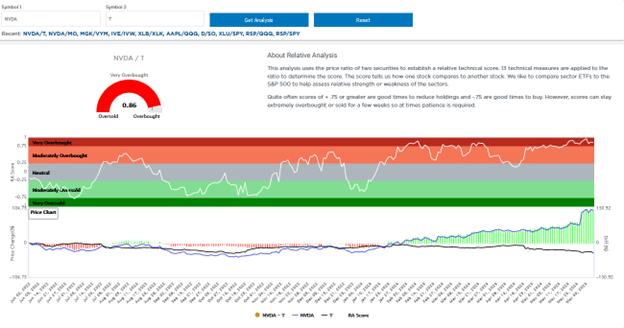
The screenshot below shows that the NVDA is very overbought versus T, and the outperformance has been extreme all year.
(Ideas – Relative Analysis – Pair)
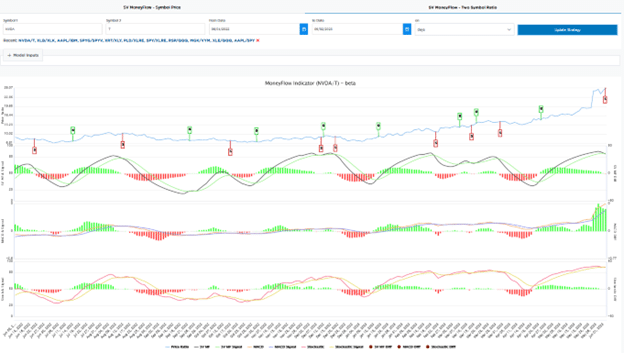
The following graph charts the price ratio of NVDA to T. NVDA’s relative outperformance is indeed long in the tooth, and its signals have turned bearish or will likely soon. While hard to recommend given recent price action, the analysis favors selling NVDA and buying T.
(Research – Money Flow)

Summary- SimpleVisor
This article highlights a few SimpleVisor tools to help us spot potential relative rotation trades.
The analysis may seem complicated, but that’s because it is. However, spending time following these tools and their signals can provide more comfort in picking sectors, factors, and stocks likely to rotate in and out of favor.
If you do not subscribe to SimpleVisor, give it a try. All subscriptions come with a 30-day free trial. If you are unhappy with our product, cancel before the 30 days ends, and you will not be charged.
We will be adding more proprietary tools and an AI portfolio model engine to SimpleVisor in the coming months. We are also redesigning the site to make the user experience easier and more satisfying.

