Bull Bear Report Stock-Bond Correlation: Oil Broke The Hedge. Oil Will Fix It. Daily Market Commentary Meta Splits: The Buyback Machine Shifts To Reverse Blog Fed Over-Tightening: How Much Runway Is Left Before It Bites? Daily Market Commentary Why Small Caps Have Recently Traded Like A Bond Proxy Blog Are Bonds Pricing In A Fed Policy Mistake? Daily Market Commentary Neoclouds And Hyperscalers: Same Concept, Different Risks Daily Market Commentary The Misleading Tech Sell-Off Daily Market Commentary Warsh Says Little: Market Hears Hold Blog AI Capex And Earnings: What Happens When Growth Slows Bull Bear Report Pimco Sees A 6% 10-Year. Here’s Why “Bad Inflation” Caps Yields
Vol. XXVII · No. 134
Saturday — October 24, 2026
Houston, Texas
Search Results

lance roberts

1,313 results found

Major Market Buy/Sell Review: 06-22-20 PRO BLOG
— PRO BLOG · 6 years ago

Major Market Buy/Sell Review: 06-22-20

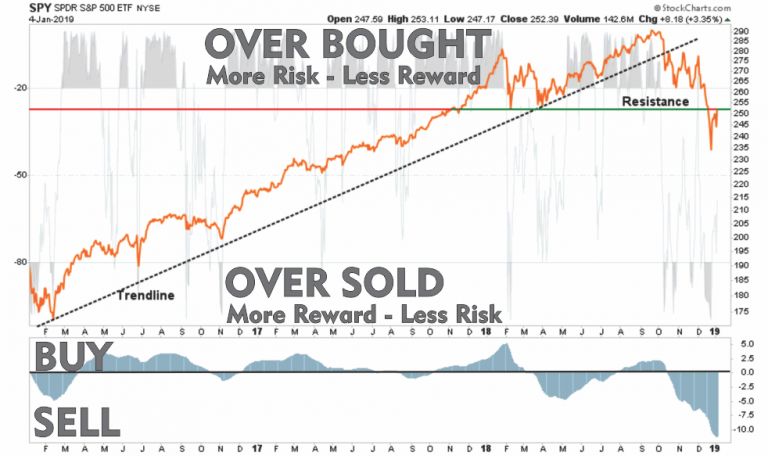
HOW TO READ THE MAJOR MARKET BUY/SELL CHARTS FOR THE WEEK OF 06-22-20. There are three primary components to each Major Market Buy/Sell chart in this RIAPro review: The price chart is in orange The Over Bought/Over Sold indicator is in gray The Buy / Sell indicator is in blue. When the gray indicator is […]
Lance Roberts 7 min read
Sector Buy/Sell Review: 06-16-20 PRO BLOG
— PRO BLOG · 6 years ago

Sector Buy/Sell Review: 06-16-20

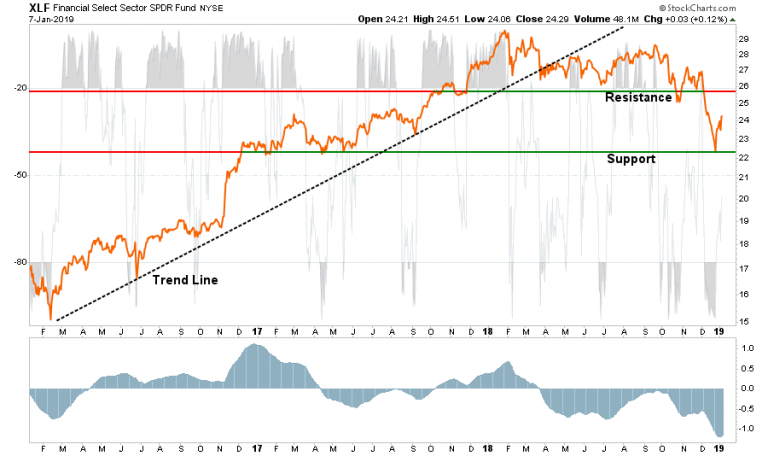
Each week we produce a “Sector Buy/Sell Review” chart book of the S&P 500 sectors to review where money is flowing within the market as whole. This helps refine not only decision making about what to own and when, but what sectors to overweight or underweight to achieve better performance. HOW TO READ THE SECTOR […]

Lance Roberts 7 min read
Technically Speaking: Bulls & Bears Square Off At The Line Invest
— Invest · 6 years ago

Technically Speaking: Bulls & Bears Square Off At The Line

Last week, we discussed investors throwing caution to the wind, and the need take on defensive positioning. One week later, the bulls and bears are squaring off at the 200-dma line to see who will gain control. 

Lance Roberts 8 min read
Major Market Buy/Sell Review: 06-15-20 PRO BLOG
— PRO BLOG · 6 years ago

Major Market Buy/Sell Review: 06-15-20

HOW TO READ THE MAJOR MARKET BUY/SELL CHARTS FOR THE WEEK OF 06-15-20. There are three primary components to each Major Market Buy/Sell chart in this RIAPro review: The price chart is in orange The Over Bought/Over Sold indicator is in gray The Buy / Sell indicator is in blue. When the gray indicator is […]

Lance Roberts 7 min read
The Fed’s Monetary “Animal House” Invest
— Invest · 6 years ago

The Fed’s Monetary “Animal House”

Market pundits seem to have strong opinions about how fast or slow the economic recovery will be once it starts. Such clairvoyance is stunning given the uncertainty of the current GDP forecast, which is already two-thirds in the books.

Michael Lebowitz 9 min read
Sector Buy/Sell Review: 06-09-20 PRO BLOG
— PRO BLOG · 6 years ago

Sector Buy/Sell Review: 06-09-20

Each week we produce a “Sector Buy/Sell Review” chart book of the S&P 500 sectors to review where money is flowing within the market as whole. This helps refine not only decision making about what to own and when, but what sectors to overweight or underweight to achieve better performance. HOW TO READ THE SECTOR […]

Lance Roberts 6 min read
Major Market Buy/Sell Review: 06-08-20 PRO BLOG
— PRO BLOG · 6 years ago

Major Market Buy/Sell Review: 06-08-20

HOW TO READ THE MAJOR MARKET BUY/SELL CHARTS FOR THE WEEK OF 06-08-20. There are three primary components to each Major Market Buy/Sell chart in this RIAPro review: The price chart is in orange The Over Bought/Over Sold indicator is in gray The Buy / Sell indicator is in blue. When the gray indicator is […]

Lance Roberts 7 min read
#MacroView: Rationalizing High Valuations Won’t Improve Outcomes Invest
— Invest · 6 years ago

#MacroView: Rationalizing High Valuations Won’t Improve Outcomes

The two previous 20-year secular bull markets begin with valuations in single digits. At the end of the first decade of those secular advances, valuations were still trading below 20x.The 1920-1929 secular advance most closely mimics the current 2010 cycle. While valuations started below 5x earnings in 1919, they eclipsed 30x earnings ten-years later in 1929. The rest, as they say, is history. Or rather, maybe "past is prologue" is more fitting.

Lance Roberts 9 min read
Major Market Buy/Sell Review: 06-01-20 PRO BLOG
— PRO BLOG · 6 years ago

Major Market Buy/Sell Review: 06-01-20

HOW TO READ THE MAJOR MARKET BUY/SELL CHARTS FOR THE WEEK OF 05-25-20. There are three primary components to each Major Market Buy/Sell chart in this RIAPro review: The price chart is in orange The Over Bought/Over Sold indicator is in gray The Buy / Sell indicator is in blue. When the gray indicator is […]

Lance Roberts 6 min read