
We led a recent article about de-dollarization with the following quote: “For those losing sleep that the Chinese yuan, bitcoin, or some other currency will commandeer the dollar’s throne as the world’s reserve currency, sleep tight. That day is not coming anytime soon.” Saudi Arabia reminds us why we believe that the much-heralded death of the dollar is not coming soon. Saudi Arabia just issued $6 billion of U.S. dollar-denominated bonds. That follows approximately $10 billion of dollar issuance earlier this year.
Saudi Arabia has been vocal about replacing the dollar as the world’s reserve currency. Yet their demand and use of dollars, as witnessed by the recent dollar debt issuance, say they want or need dollars. Further enlightening, Saudi Arabia pegs their currency to the dollar and has for over 70 years. The graph below shows the flat exchange rate between the Saudi Riyal and the U.S. dollar over the last 20 years. For a country that seems intent on getting rid of dollars, they are as attached to dollars as any country. Even more interesting, Saudi Arabia has the one export almost every country needs, oil. Of all countries, Saudi Arabia has the most leverage in dictating trade terms away from the dollar. Why are they talking loudly about de-dollarization but further tieing themselves to the dollar’s value? Simply, there is no viable large-scale alternative.
Actions speak louder than words!

What To Watch Today
Earnings

Economy

Breakout!
Yesterday, following more good news from retailers, which further confirmed no imminent recession, stocks broke above the trading range that has contained markets since February. That breakout sparked massive short covering and a rush to buy into the technology sector index, with the mega-caps again leading the way, as we discussed in yesterday’s morning note.
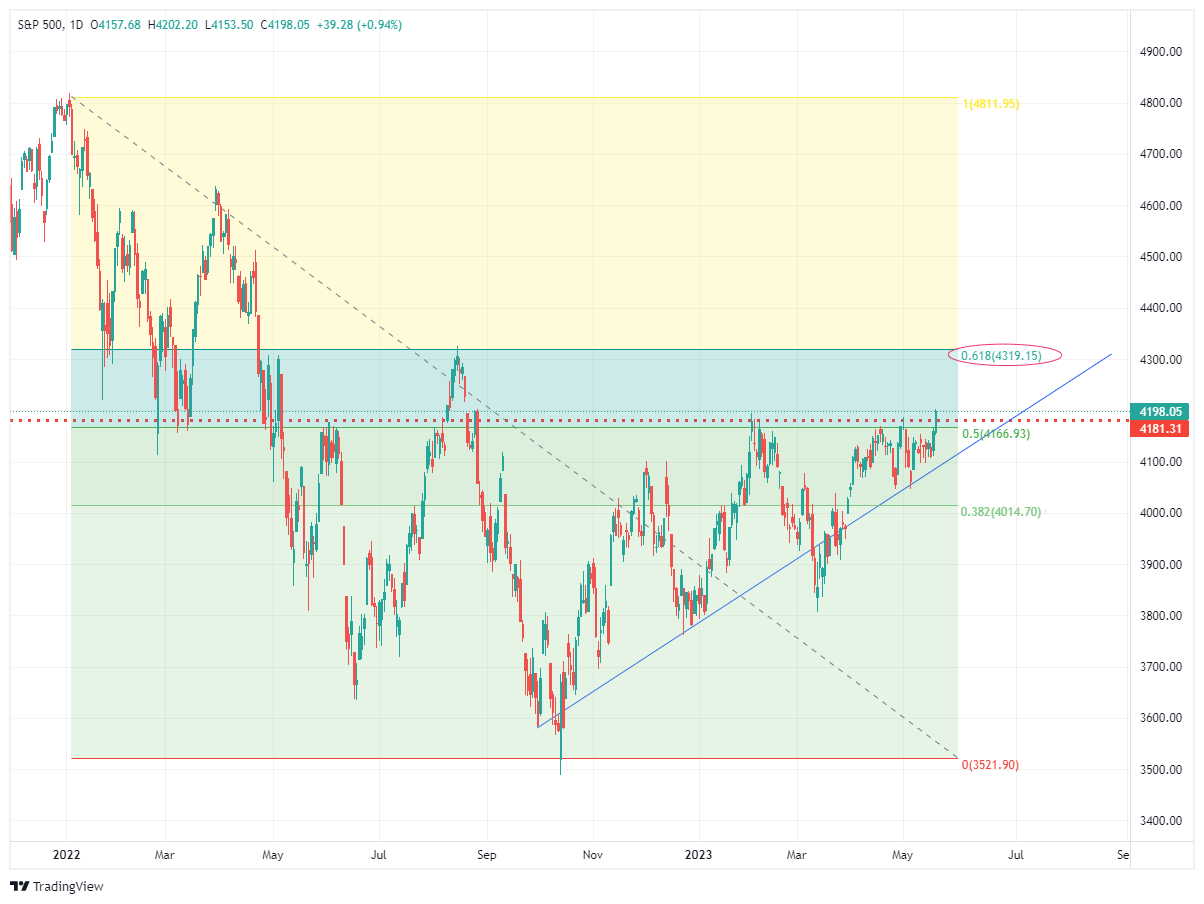
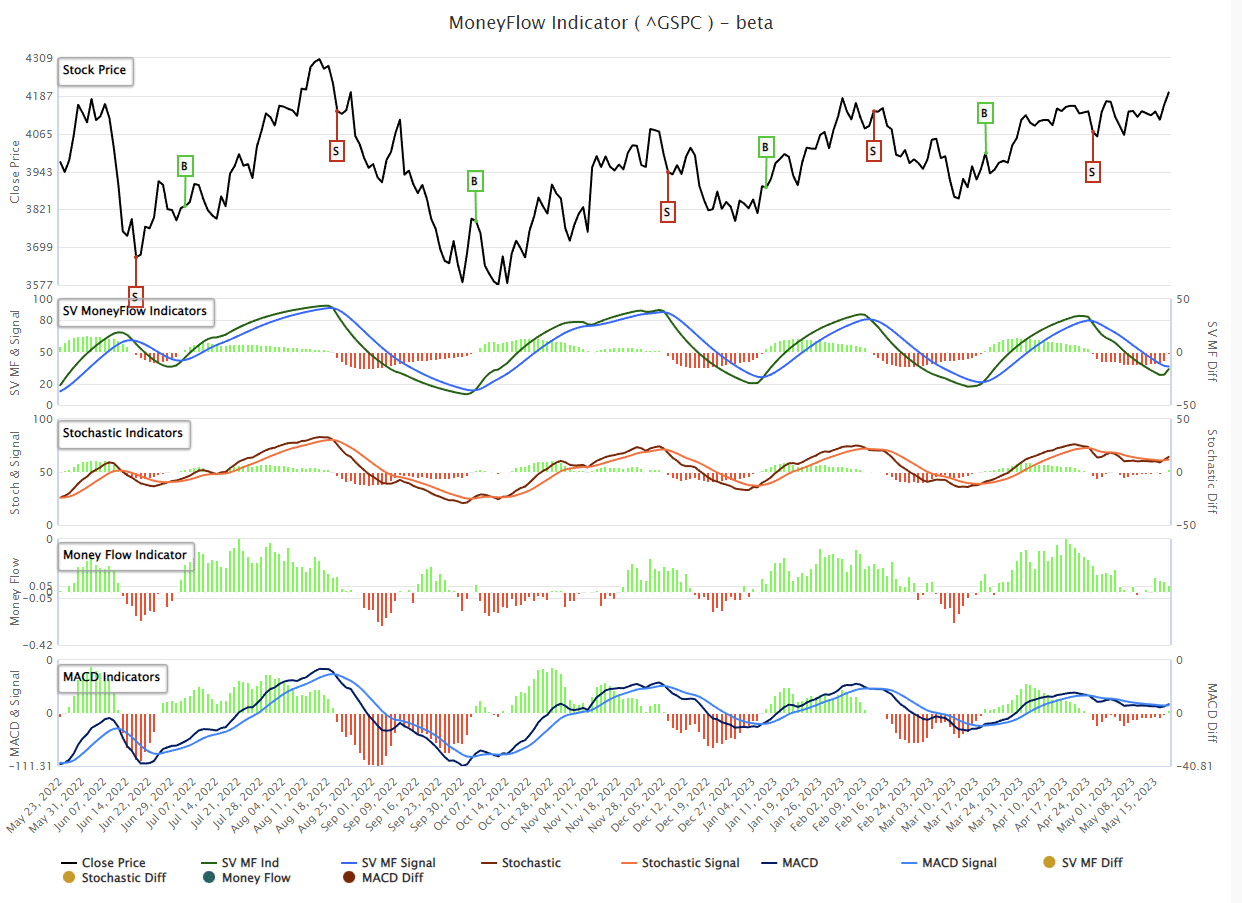
More importantly, that breakout was confirmed by a MACD “buy signal.” We will most likely get a confirming “money flow buy signal” by the end of today if the market trades higher.
The only “negative” to the market action is that the buy signals are triggering at fairly high levels from a historical basis, which will likely contain the upside of whatever rally the market provides. For now, there is absolutely no reason to be negative on the market as the bulls are clearly in control.

Tech Versus the Rest
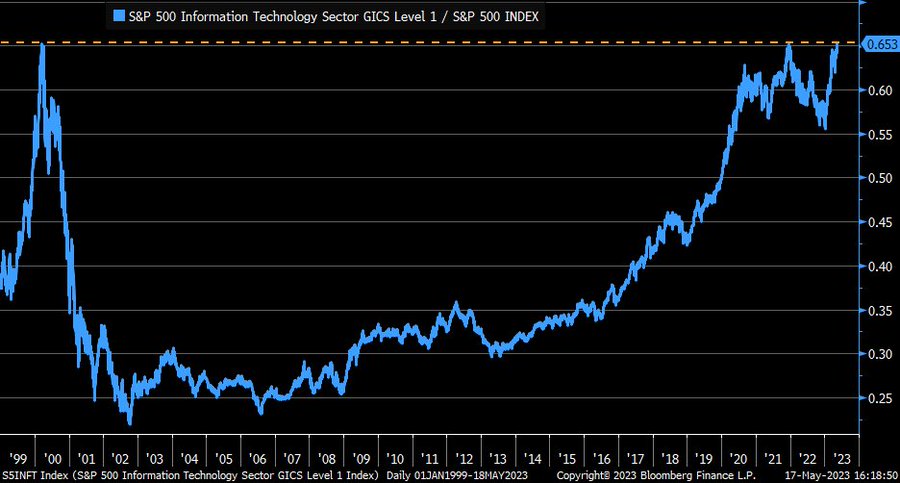
The graph below charts the price ratio of the tech sector versus the S&P 500. The strong tech outperformance of the last few months has put the ratio back to its 2021 and 2000 peaks. Tech, especially the largest stocks within the tech indexes, are significantly overbought and may pull back versus the broader markets in the short run. Longer term, though, it has been bumping up against resistance and may be poised for a breakthrough.
Regional Fed Surveys Provide HOPE
We often talk about individual regional Fed manufacturing surveys, which tend to be good leading economic indicators. The graph below takes the individual survey analysis to a broader level. The three charts below show how the five most followed regional indexes tend to track each other well. The business conditions index, a culmination of the sub-indexes, is solidly negative and at levels associated with recessions. New orders, an excellent leading indicator, are also at recessionary levels. Employment, on the other hand, is still expanding, albeit slowly. The significance of new orders versus employment can be found in our article Janet Yellen Should Focus on HOPE. To wit:
Michael’s HOPE model consists of Housing, New Orders (ISM), Corporate Profits, and Employment.
His framework acknowledges that the most interest rate-sensitive sectors are first to feel the brunt of tightening monetary policy. These sectors often serve as leading economic indicators. As interest rates dampen economic activity in interest rate-sensitive sectors, other sectors and facets of the economy begin to feel the impact of higher rates. HOPE illustrates the various lags or the time it takes for rate hikes to affect economic activity fully.

Walmart
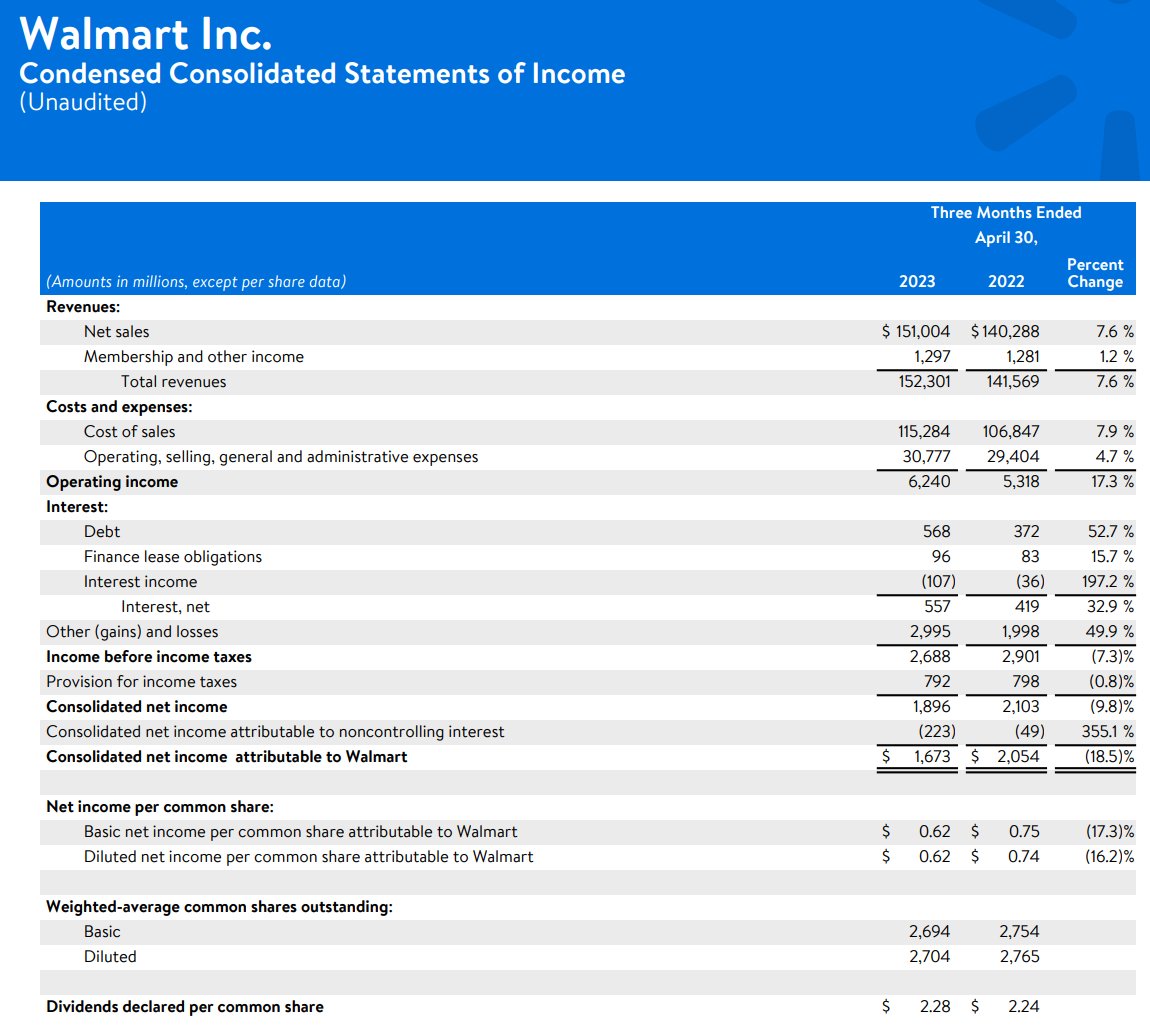
Walmart bucked the trend among retailers this week, boosting its profit guidance for the year and posting solid sales growth. As you recall, over the last two days, Target and Home Depot reported flat to slightly declining sales growth and reduced their forward earnings guidance based on weakening consumption trends. Walmart is a little different than Target and Home Depot, as food/groceries account for nearly 60% of their sales. Food inflation has been running hot, and passing on the higher costs to consumers has been relatively easy. It’s quite possible consumers are spending more on food, ergo have less to spend on other items, like those sold at Target and Home Depot.
Walmart’s same-store sales, not including new stores, rose 7.4%, and E-commerce sales surged by 27% for the year. While annual earnings beat expectations nicely ($1.47 vs. $1.32), they were lower than last year. The income statement below shows that interest expense rose by almost $200 million for the quarter but was partially offset by an increase in interest income. Companies with higher debt loads will see interest expenses grow in the coming quarters as their debt matures and must be reissued at higher interest rates. Conversely, companies with a lot of cash and low debt benefit from the current interest rate regime.
Tweet of the Day

Please subscribe to the daily commentary to receive these updates every morning before the opening bell.
If you found this blog useful, please send it to someone else, share it on social media, or contact us to set up a meeting.

