
Wages and rents were two of the most impactful factors driving higher inflation and, of recent importance, keeping it stubbornly above the Fed’s 2% target. As we will share, the good news is that wage growth and rents should be easing.
The graph on the right shows that the Atlanta Fed wage growth tracker is still declining rapidly and nearing pre-pandemic levels. One of the Fed’s primary concerns has been a price-wage spiral. This occurs when higher wages force higher prices, pushing workers to demand higher wages. Consequently, such a spiral can lead to lasting inflation. Not only is wage inflation normalizing, as we show, but the aggregate number of hours worked is below pre-pandemic levels. Moreover, excluding a few months in early 2020, it’s back to levels last seen in 2010. Other employment data also point to pre-pandemic wage trends.
We have discussed how shelter prices, driven by rents and imputed rents, account for 44% of CPI. Furthermore, it has been widely noted that CPI shelter prices significantly lag real-time rent prices. The graph on the left provides further comfort that rent prices are not likely to accelerate. As the graph shows, apartment vacancy rates are now above pre-pandemic levels. Further, an above-average number of multifamily properties nearing completion will be coming on the market shortly. Consequently, we expect market rental prices to grow negligibly and, in time, CPI shelter will mirror reality.

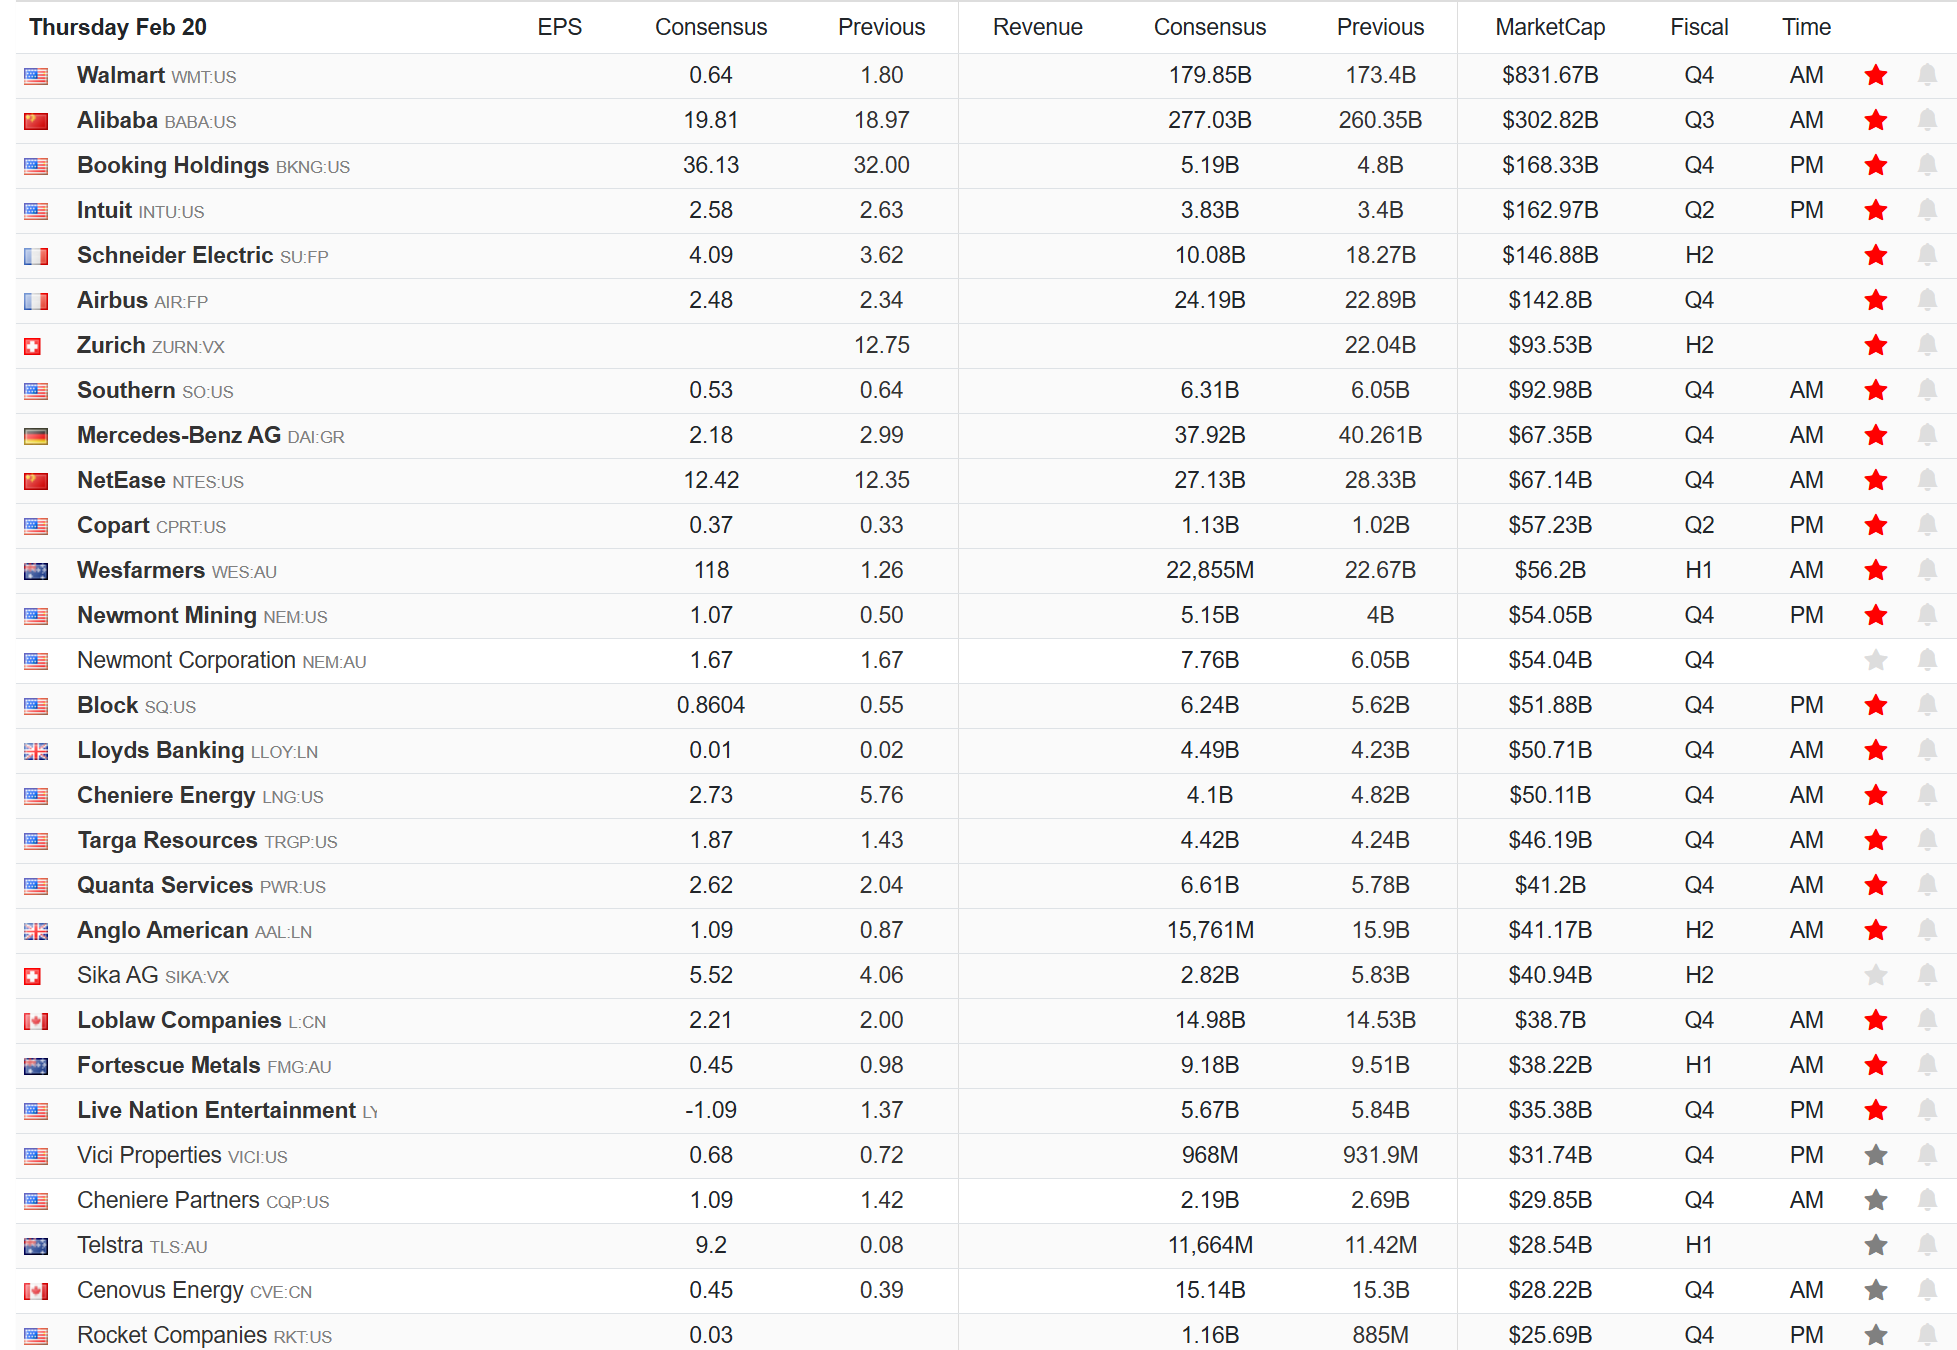
What To Watch Today
Earnings
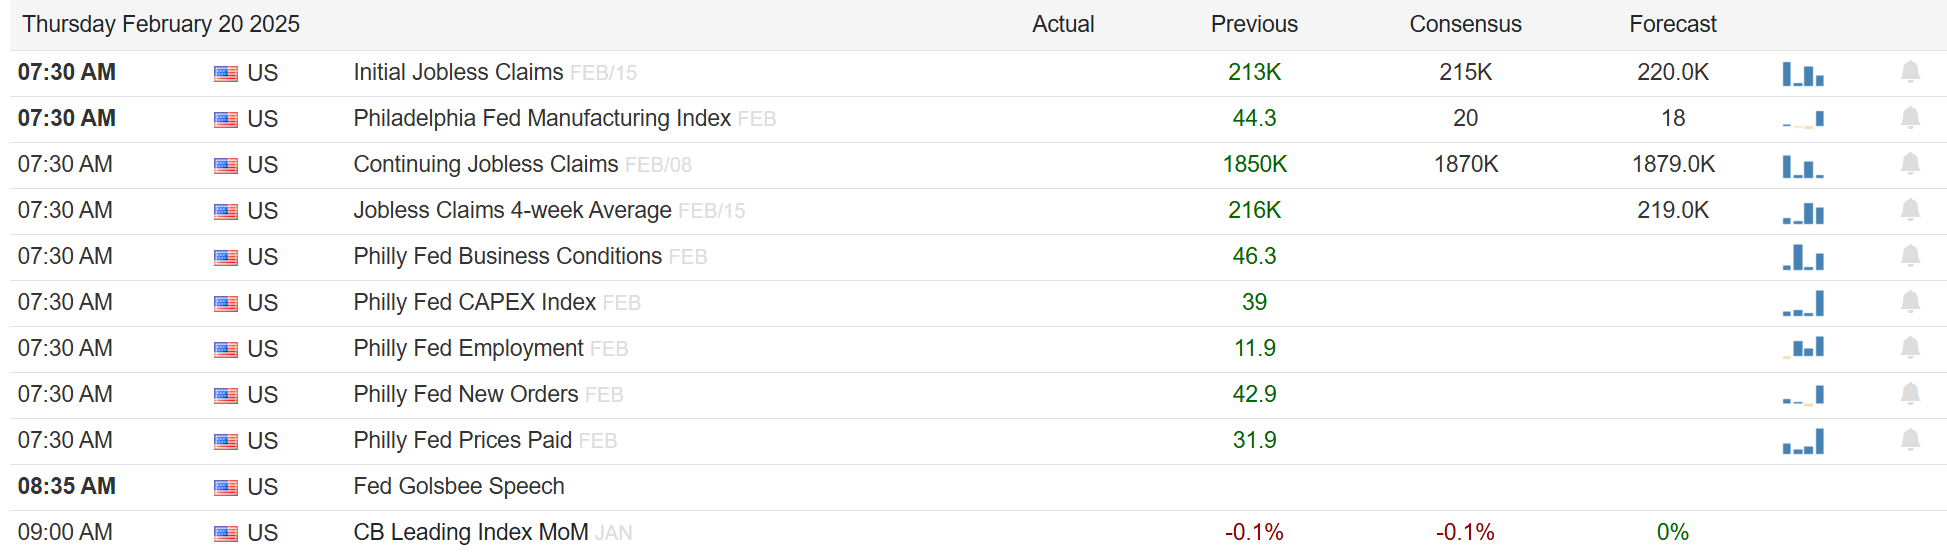
Economy
Market Trading Update
Yesterday, we noted that the market broke out to a new all-time high just as the market closed. The good news is that new highs tend to beget new highs as momentum drives prices higher. Historically, such has remained the case for quite some time when stocks have been in uptrends and making new highs. That is, until some exogenous, unexpected event comes along that causes a rapid shift in market sentiment and a rapid repricing of expectations.

As I will discuss in this upcoming weekend’s #BullBearReport, another measure of that market exuberance is the increase in margin debt balances, which are also at new records; in the article, we explain that it isn’t just the increase in margin debt that is notable, but the speed of the rise. Here is an excerpt:
“Margin data goes back to 1959, giving us much history to study its relationship to the market. The chart below is a “stochastic indicator” of margin debt overlaid against the S&P 500. (The stochastic indicator is a momentum indicator developed by George C. Lane in the 1950s. The analysis examines the most recent margin debt level relative to its previous high-low range. In other words, the indicator measures the momentum of margin debt by comparing the closing level with the range over the past 21 months.)
The stochastic indicator represents the speed and momentum of margin debt level changes. This means the stochastic indicator changes direction before the market, making it a leading indicator. With the stochastic indicator at 100 (its maximum level), this has typically preceded a market reversal and represents the sharp increase in investor risk-taking“.
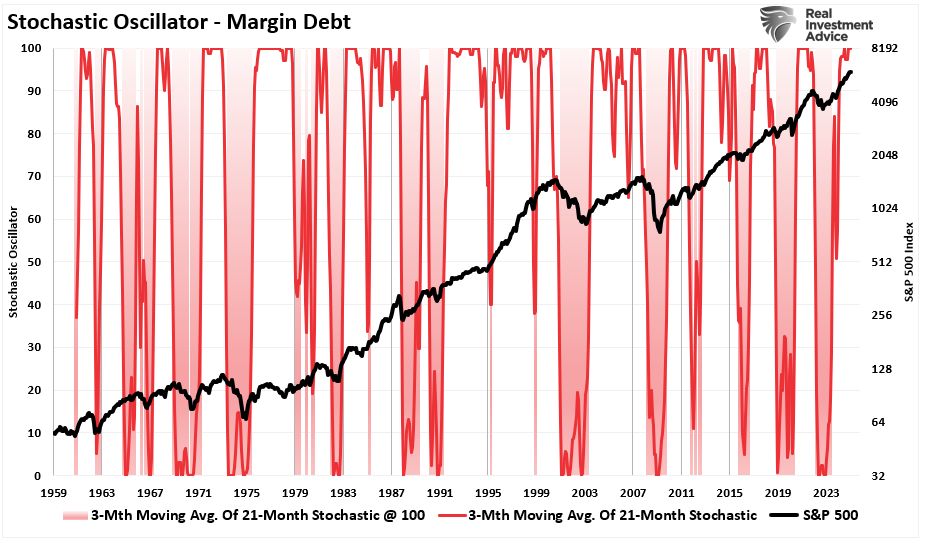
As we note in that discussion, the current levels of margin debt are very supportive of higher prices as leverage increases buying power. However, given the current levels of margin debt and the fact that investors are adding leverage on top of leverage through options and ETFs, the “fuel” for a rapid reversal is present. All that is needed is the right catalyst.
The market remains very bullish, and the most likely path for equity prices remains higher. However, given various market risks, exuberant investment sentiment, and increased speculation, maintaining risk controls remains prudent. This is why we continue to hold slightly higher cash levels and focus on portfolio rebalancing.

Are Consumers Retrenching?
Last week’s poor retail sales data caught many off guard. However, had analysts looked at recent household debt trends, they would have been more suspecting of weakness. The graph below shows that the total consumer debt balance per capita fell by over 1% in the fourth quarter. That is the second-largest quarterly decline in over 20 years. Are households starting to follow the DOGE lead and reduce their debt loads? Since personal consumption accounts for two-thirds of economic growth, further consumer retrenching could spell trouble for the economy.

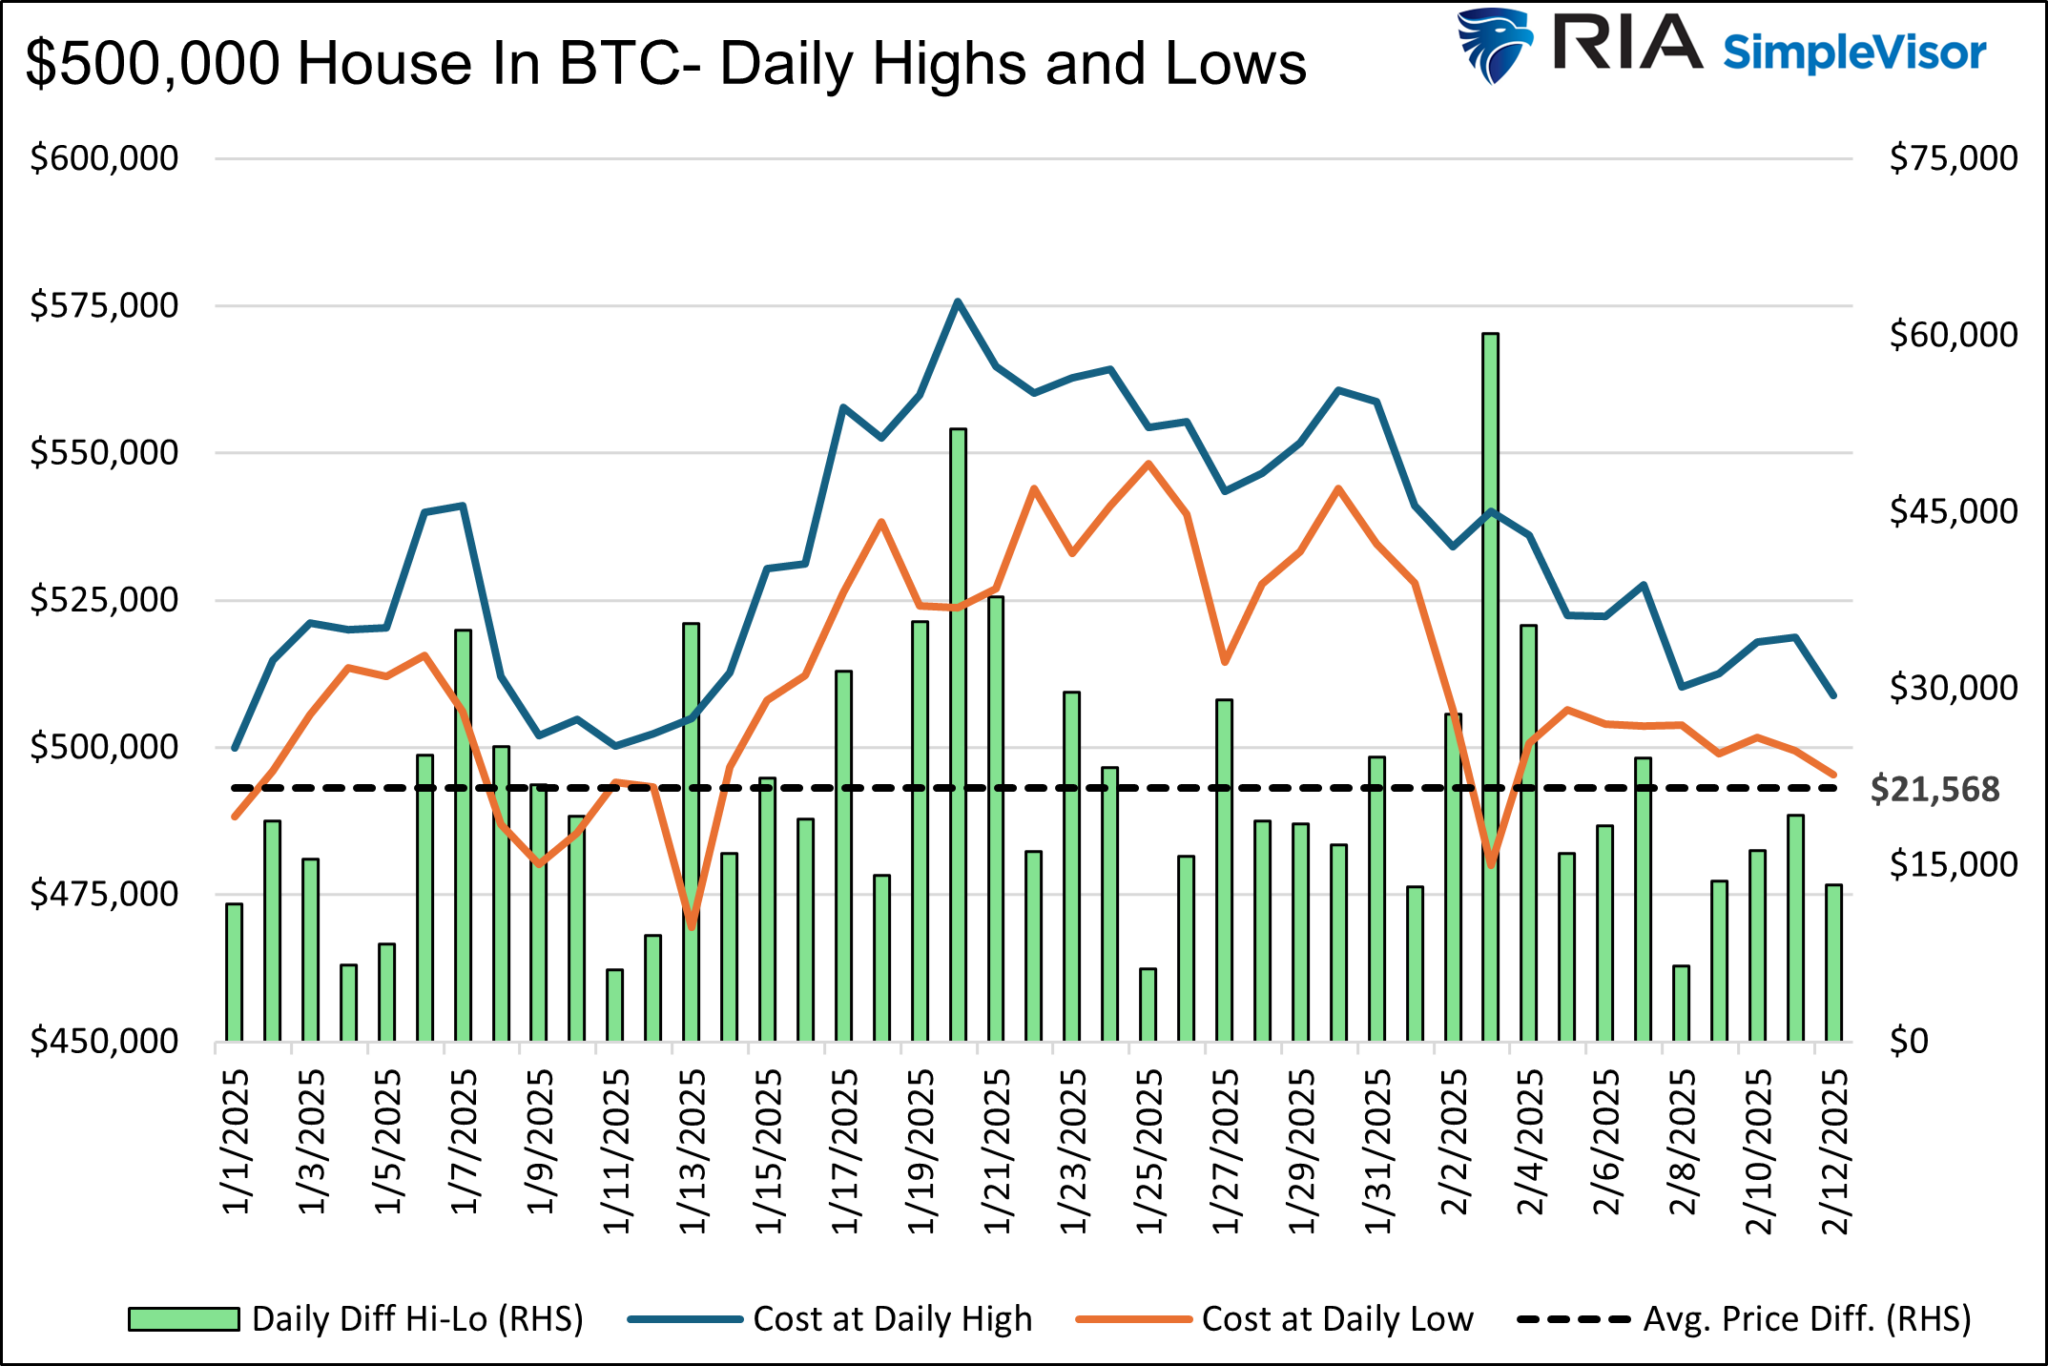
Why Bitcoin Will Not Replace The Dollar
Per the Bitcoin construct, there will only be 21 million coins. The halving process ensures that creating new Bitcoin is increasingly more complex, time-consuming, and expensive. Due to exponentially decreasing rewards for mining Bitcoin, we doubt anyone will mine the 21 millionth coin.
As new Bitcoin production inevitably slows and some coins are lost, its value should increase. That assumes enough people are still willing and able to hold and trade Bitcoin.
Hypothetically, if Bitcoin were lawful money, its limited supply would not be sufficient for a growing economy. Thus, the value of Bitcoin would rise, and by default, the prices of goods and services in the aggregate would decline. Some may argue that deflation is a good thing. And yes, while we like cheaper things, ask yourself who would buy them.
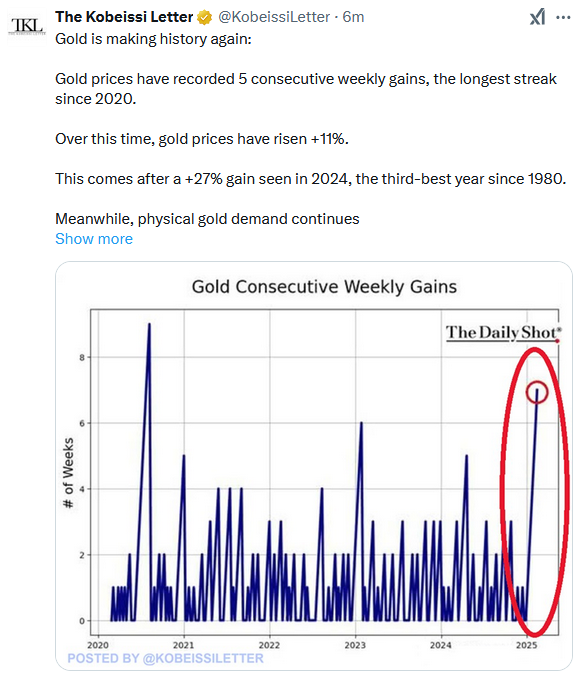
Tweet of the Day
“Want to achieve better long-term success in managing your portfolio? Here are our 15-trading rules for managing market risks.”
Please subscribe to the daily commentary to receive these updates every morning before the opening bell.
If you found this blog useful, please send it to someone else, share it on social media, or contact us to set up a meeting.

