
At the start of 2026, we introduced our Factor Rotation Model. The model summary below was posted in SimpleVisor:
We launched a new model on January 2nd called the Factor Rotation Model. Historically, the performance of value and growth factors relative to the S&P 500 exhibits a strong negative correlation. Michael Lebowitz provided an overview of this concept in his piece: Relative Rotation – Unlocking the Hidden Potential Part 1. While the article uses a simplified example, it highlights the philosophy behind our new Factor Rotation Model.
The model is fully allocated to equities, aiming to outperform the S&P 500 over the long term by strategically rotating between value and growth exposures. Trading signals are generated by our proprietary, rules-based quantitative model.
The model has two primary allocation states: overweight value/underweight growth or overweight growth/underweight value. The model targets an 80/20 allocation split between the two factors. Trading signals may persist for as little as one month or longer than one year.
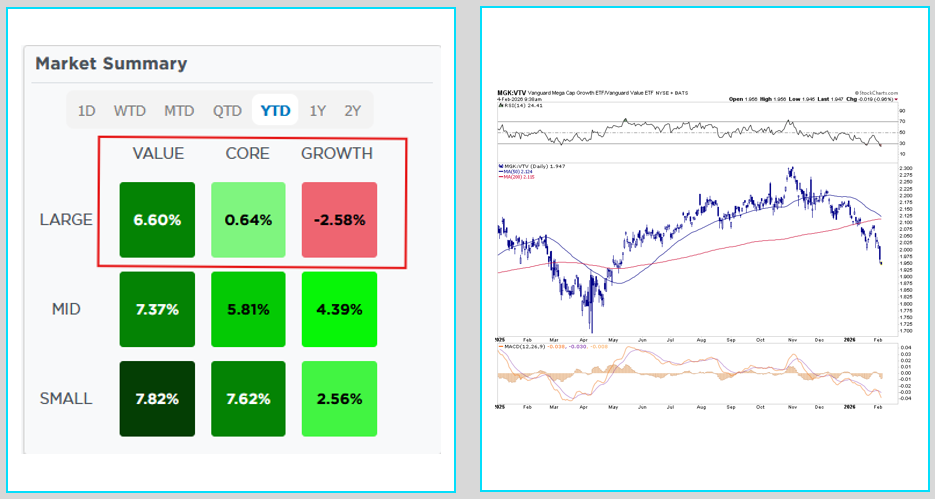
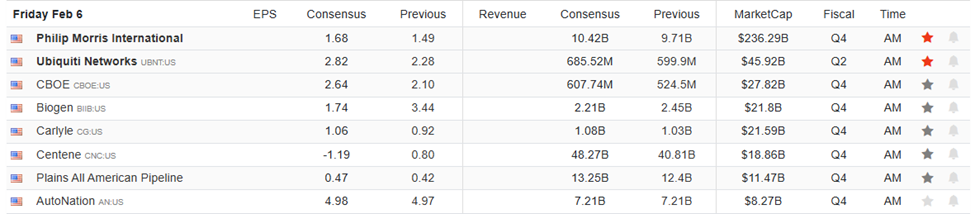
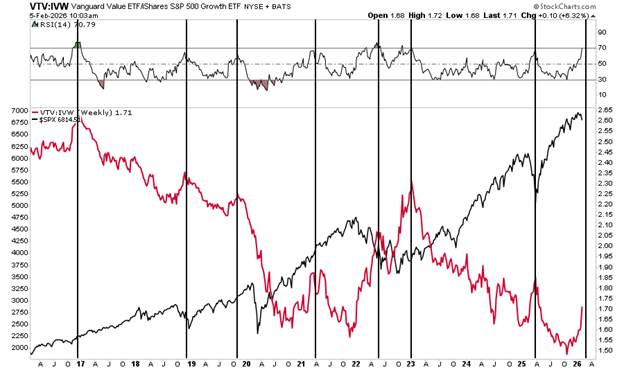
The graph on the left below shows that large-cap growth stocks are down 2.58% year to date, while large-cap value stocks are up 6.60%. The second graph, comparing the price ratio of large-cap growth stocks (MGK) to large-cap value stocks (VTV), shows the relationship is now fairly oversold. Thus, the proprietary calculations within our factor rotation model triggered trade signals on Wednesday, adding to growth stocks and reducing value stocks.
As we noted on Wednesday in the SimpleVisor transaction summary, we used 15 years of market activity to back-test the model. In this time span, there were 43 rotation trade signals, of which the shortest was 16 days, and the longest was 453 days. Importantly, the most recent signal is not telling us growth stocks will outperform for a long stretch as they did for much of last year, or if value will be the better-performing factor this year. What we do know, however, is that investors who can rotate between value and growth at the right times are much better off than those who invest in the S&P 500. Prior to Wednesday, the model was positioned toward value, resulting in 3% outperformance versus the S&P 500.
What To Watch Today
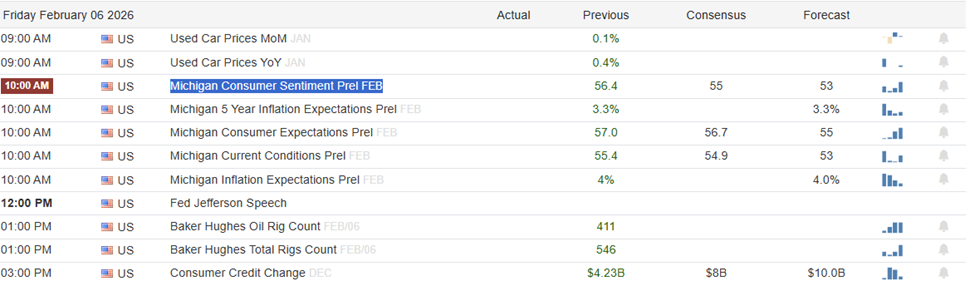
Earnings
Economy
Market Trading Update
Yesterday, we discussed the market’s very oversold condition in the SaaS sector. Looking at the broader market, mega-cap stocks have been under considerable pressure lately as market narratives gravitate toward concerns about the future ROI of investments these companies are making.
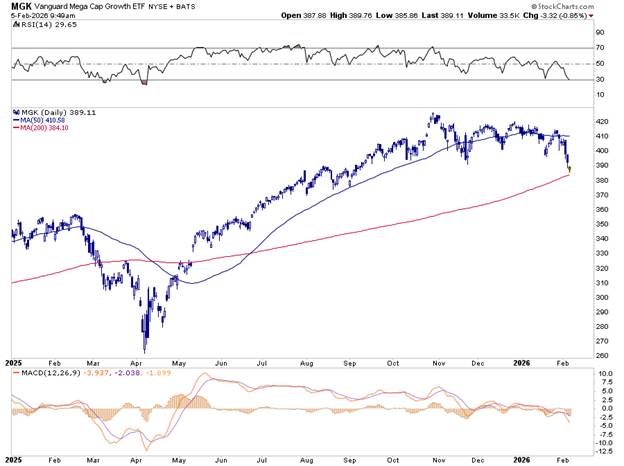
As we have noted previously, valuations were always an issue going into this year, and we noted several times that if forward earnings expectations are revised lower, the market would have to reprice stocks lower to align with lower future valuation assumptions. That is what has been happening over the last month. As shown, the mega-cap growth stocks, as represented by MGK, have declined rather sharply.
From a technical basis, MGK is challenging its 200-Day Moving Average for the first time since last March. From a contextual standpoint, the previous selloff was driven by concerns about tariffs and their impact on revenues. Furthermore, relative strength is approaching very oversold levels that have typically coincided with price reversals.
Furthermore, when looking at the risk-off rotation from mega-cap growth stocks to value stocks, that rotation has been quite rapid. With that ratio now approaching more oversold levels, a rotation from value back to mega-cap stocks is becoming more likely.
While it is too soon to aggressively buy these companies, the point of this exercise over the last two days is to recognize that the rotation to value we discussed extensively late last year has now occurred. That trade is being extended, particularly now that retail investors are piling into it. As shown, previous overbought conditions in the Value-to-Growth ratio have typically led to reversals.
Could the current value rotation continue longer? Absolutely. Such is why we want to continue to have exposure on the value side of our portfolio. However, growth stocks have become significantly cheaper since the beginning of the year, and at some point will provide a compelling entry point to add to holdings.
For now, patience will win the game. The most important part is not to panic and begin chasing a rotation trade that is very extended, overbought, and has become a retail “meme.”
Trade accordingly.

The Holy Grail Of Factor Rotation
In 2023, we introduced the concept of relative rotation to our readers. The article, Relative Rotation, Unlocking The Hidden Potential, shared a few graphs that really get to the heart of why rotating between sectors, factors, or even stocks makes a lot of sense. Let’s review them to better understand our new Factor Rotation Model.
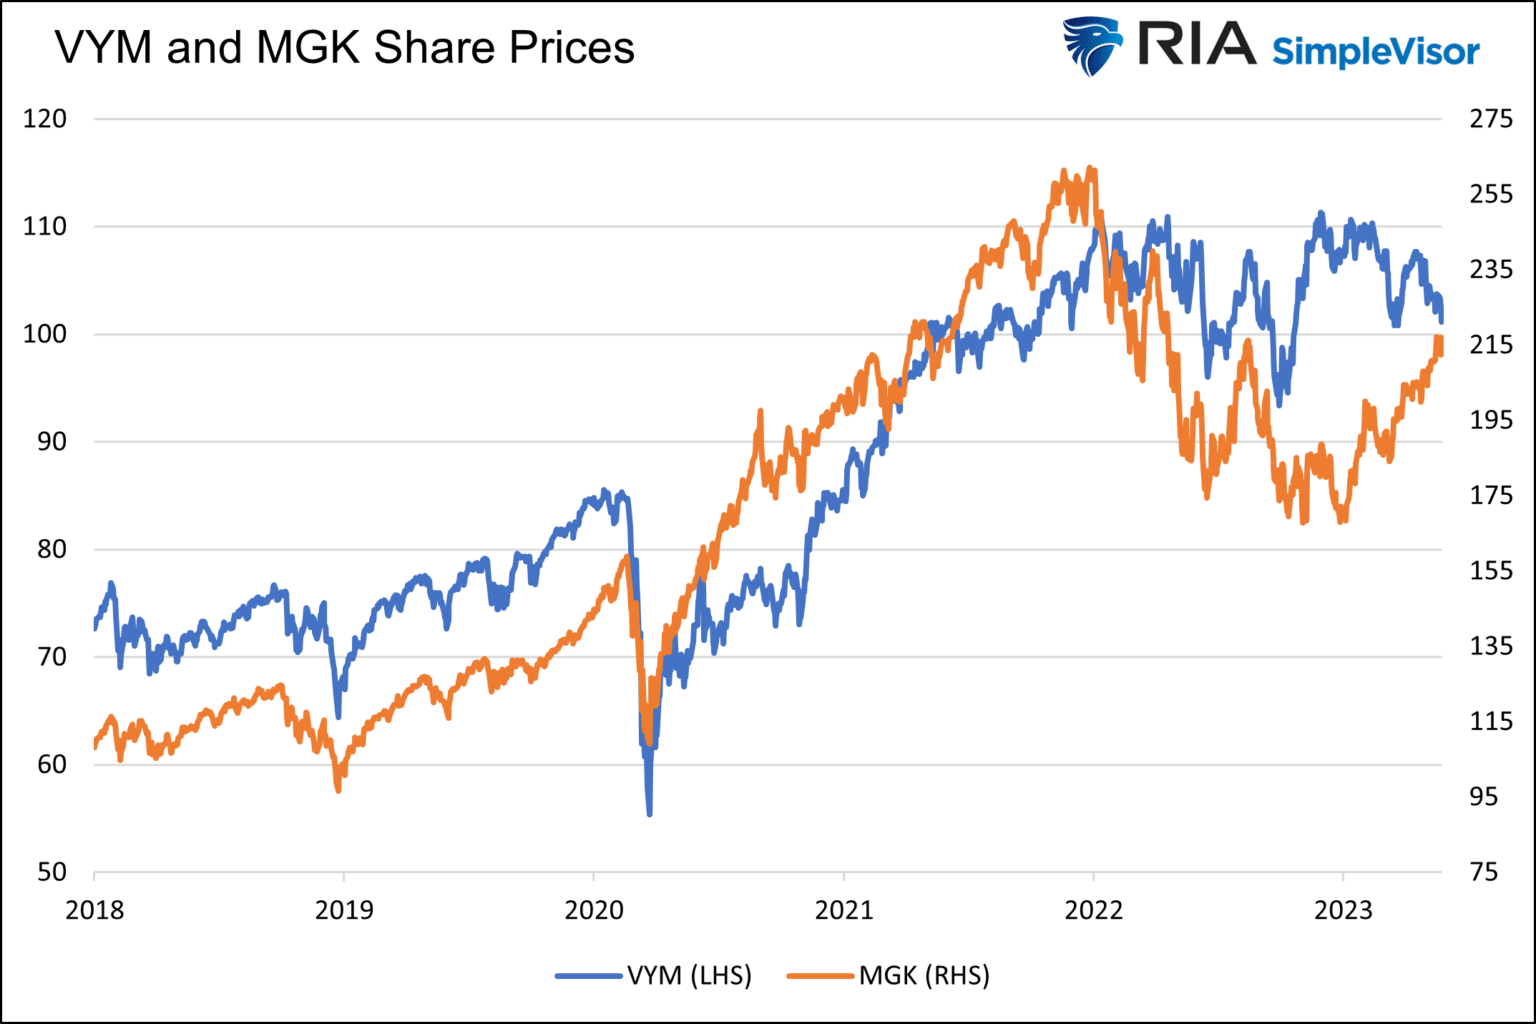
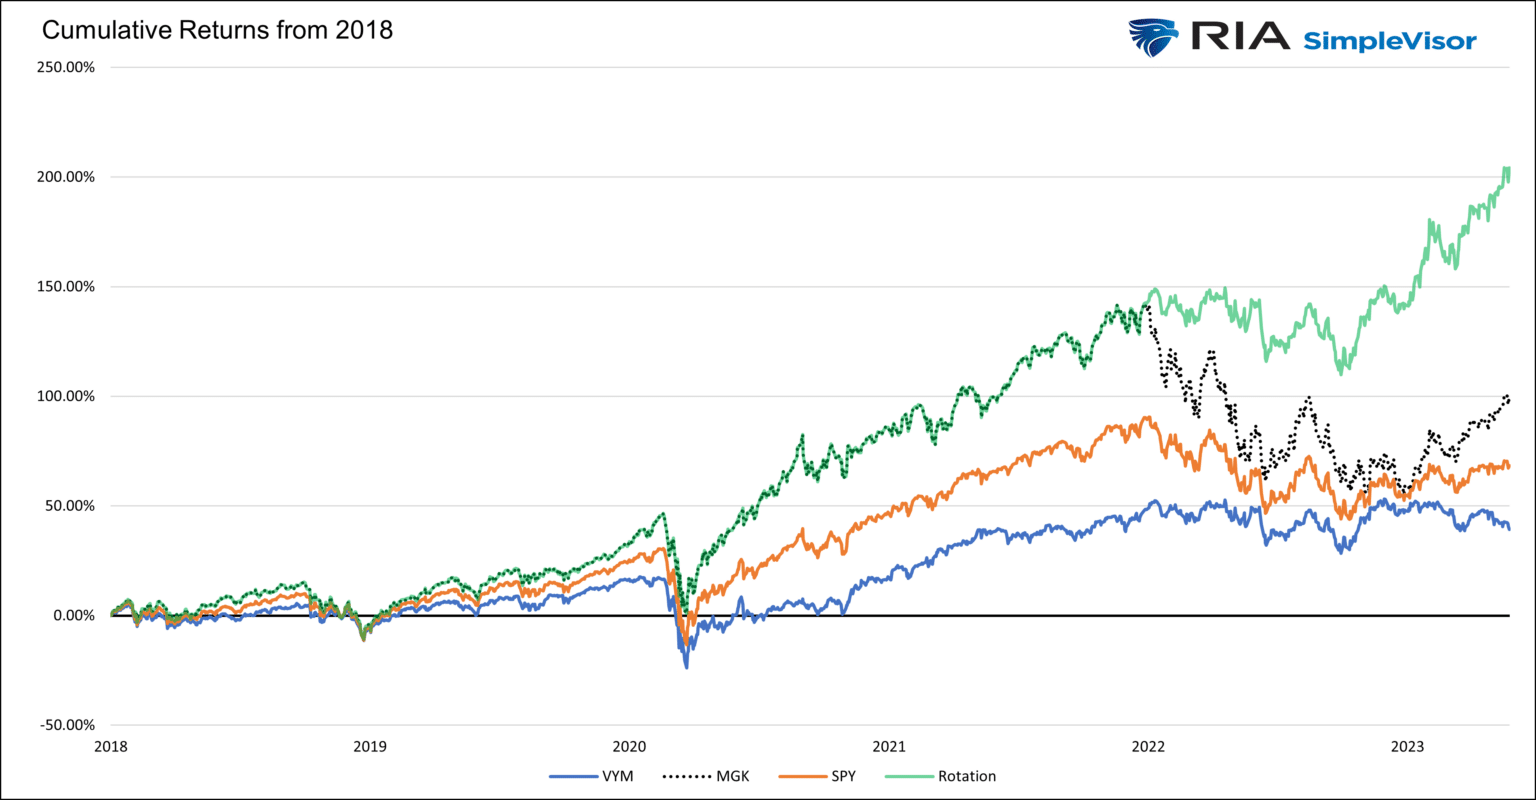
The first graph below charts the prices of the high-dividend ETF (VYM) and the large-cap stock ETF (MGK). At first blush, they tend to be decently correlated, rising and falling at similar times, albeit at different rates. However, if we chart the relative performance of each ETF versus the S&P 500 instead of price, we get a completely different graph. As the second graph shows, the excess returns relative to the S&P 500 are nearly mirror images of each other. Thus, if you can rotate between the two ETFs at the turning points, your portfolio will do significantly better than the market, as we show in the third graph.
We caution that the strategy is challenging. Correctly, timing the rotations is incredibly difficult, and, furthermore, it is of utmost importance to continually assess whether the strong negative correlation between the excess returns remains robust.

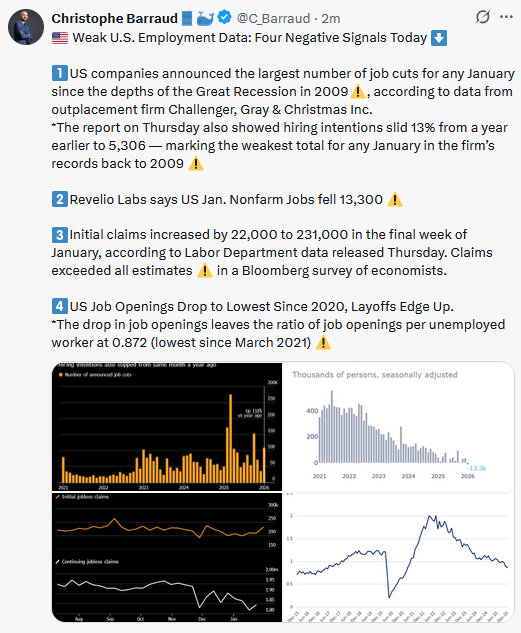
Challenger Job Cuts And JOLTS Point To Labor Market Weakness
According to the Challenger Job Cuts report, employers announced 108,435 layoffs in January. That is up over 2x from December and is the highest January total since 2009. Moreover, hiring plans were weak, with just 5,306 announced — the lowest January level on record.
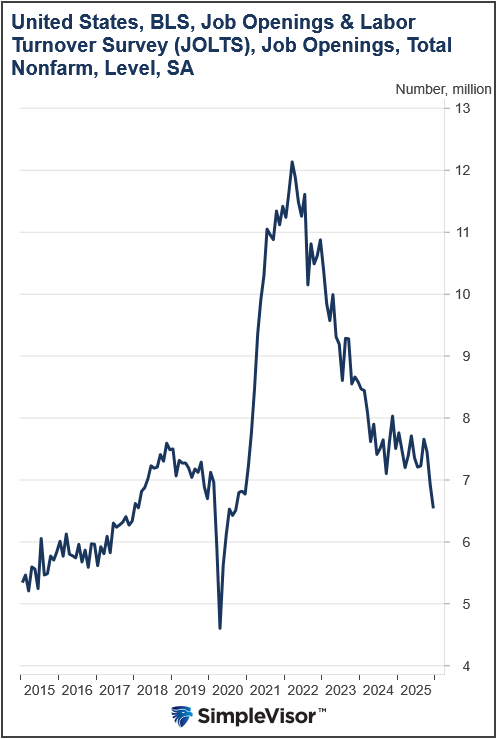
Supporting the hiring plans assessment was the JOLTs report. As shown below, the BLS JOLTS job openings number fell to 6.5 million, over half a million below expectations. Further, the number of openings is below that of the few years leading up to the pandemic.
Tweet of the Day
“Want to achieve better long-term success in managing your portfolio? Here are our 15-trading rules for managing market risks.”
Please subscribe to the daily commentary to receive these updates every morning before the opening bell.
If you found this blog useful, please send it to someone else, share it on social media, or contact us to set up a meeting.

