
Recently, the media have highlighted anomalies in the University of Michigan (UM) consumer sentiment survey compared to other financial/economic sentiment surveys. It turns out UM changed their data gathering methods between April and July 2024. While it’s challenging to determine the impact of these changes and whether they are responsible for the recent divergences from other indicators, it’s worthwhile to understand them.
The following is a summary of two significant changes in the UM survey:
- Web-based– UM converted to web-based interviews versus more personal telephone interviews. This can skew results in two ways. First, without having to talk to someone, respondents are not as likely to give answers they think the surveyor expects to hear. Simply, interviewees may speak more freely. Secondly, they may interpret questions differently without verbal clarification, which can also lead to different answers.
- Increased Sample Size – A benefit of using a web-based survey is that it allows for a larger sample size. According to the UM, they now inquire with nearly 1,000 people, almost double those contacted through phone interviews. While a larger sample size is beneficial, it can also attract a different demographic. For instance, younger, more tech-savvy respondents are more likely to participate than older, less digitally inclined people.
Per the UM, the results before and after the changes are very similar and should produce no discernible differences. To wit, they contend there is a 0.97 correlation between the web and phone results. As we highlight below, the three main components of the UM survey fell after the adjustments in 2024. However, it’s impossible to know how much of the decline was due to economic conditions and sentiment at the time. For what it’s worth, the Conference Board’s sentiment indicator increased slightly during that same period.

What To Watch Today
Earnings

Economy

Market Trading Update
As noted yesterday, equity strength continued into the end of the month and quarter with the S&P 500 and Nasdaq registering new all-time highs. Broader sectors, especially Consumer Discretionary, Communication Services, and Industrials led the move, while Energy lagged. Notably, while technology did make gains, it was the defensive, value dividend stocks that led the charge with companies like V, VZ, T and ABBV finding buyers.

Macro tailwinds currently support higher stock prices, particularly with the Q2 earnings season about to start. Cooling inflation data like PCE (2.3% YoY, slight uptick in core) and progress in geopolitical fronts, including a potential truce in the Israel–Iran conflict, is also boosting sentiment. Meanwhile, caution flags are raised by CFO surveys, even though 78% of investors are optimistic, only 43% of CFOs share that enthusiasm.
RSI & Momentum
- The S&P 500’s 14‑day RSI has climbed to around 70, now entering overbought territory—emblematic of strong buying pressure but hinting at short-term exhaustion.
- Long-term momentum remains robust: both 50‑ and 200‑day moving averages show sustained upward slopes, aligning with signs of a “golden cross” setup.
- Price action has cleared key VWAP thresholds (approx. 6,214 on S&P), reinforcing bullish technical structure. Price needs to hold above this VWAP to maintain near-term momentum.
Market Breadth
- Short‑term breadth is healthy: ~70% of S&P members trade above their 50‑day MA, with ~55% above 200‑day MA, showing solid participation yet leaving room for broader catch‑up.
- Advance‑decline metrics reveal ~52% of stocks up: modest daily gains, but with a positive trend in new highs (~7%) versus low occurrences (~1%).
- Broader market participation beyond mega‑cap tech is increasing; financials, industrials, and utilities are contributing to the rally—a constructive backdrop according to Wall Street breadth studies.
Sentiment Measures
- Macro tailwinds: dovish Fed expectations, easing trade tensions, and AI optimism are reinforcing bullish sentiment.
- Earnings revisions breadth (net analyst upgrades vs. downgrades) has improved dramatically—to roughly –5% from –25% in April—signaling positive forward earnings skew.
- Volatility index (VIX) remains low (~17), reflecting complacency and an appetite for risk heading into summer.


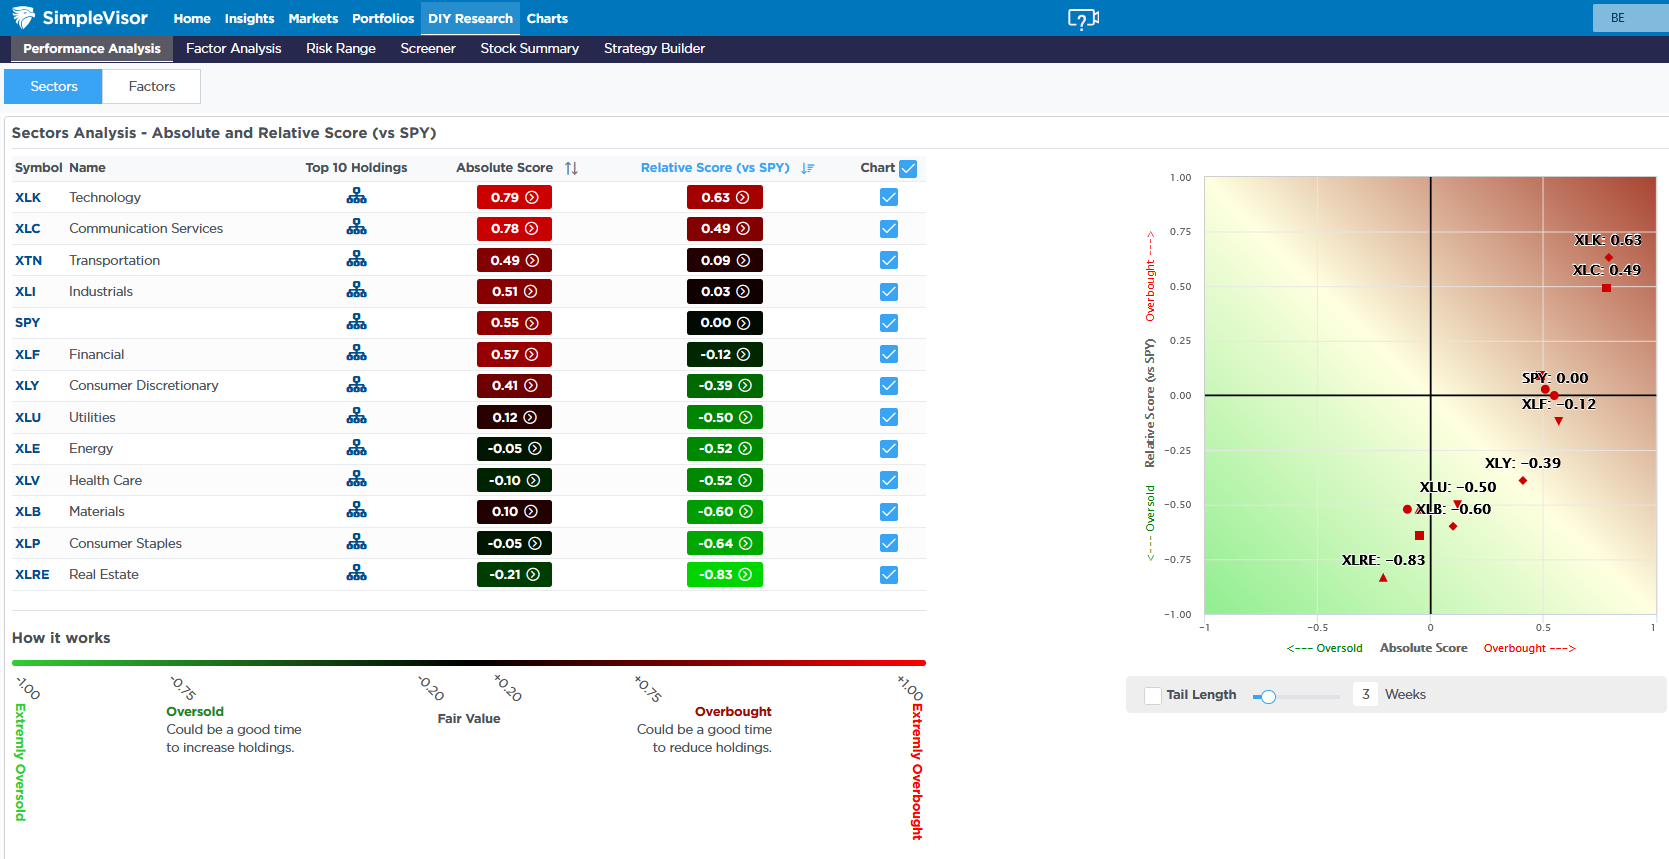
Overbought Or Oversold: Very Little Middleground Between Sectors
The rally to new highs, like we saw in 2024, is a story of the haves and have-nots. As we share below, Technology and Communications are moderately overbought. At the same time, a few sectors are at fair value (transportation, industrials, and financials). Furthermore, many sectors are decently oversold compared to the market. Similarly, despite new highs and a steady rally over the last two months, almost half the sectors are oversold on an absolute basis.
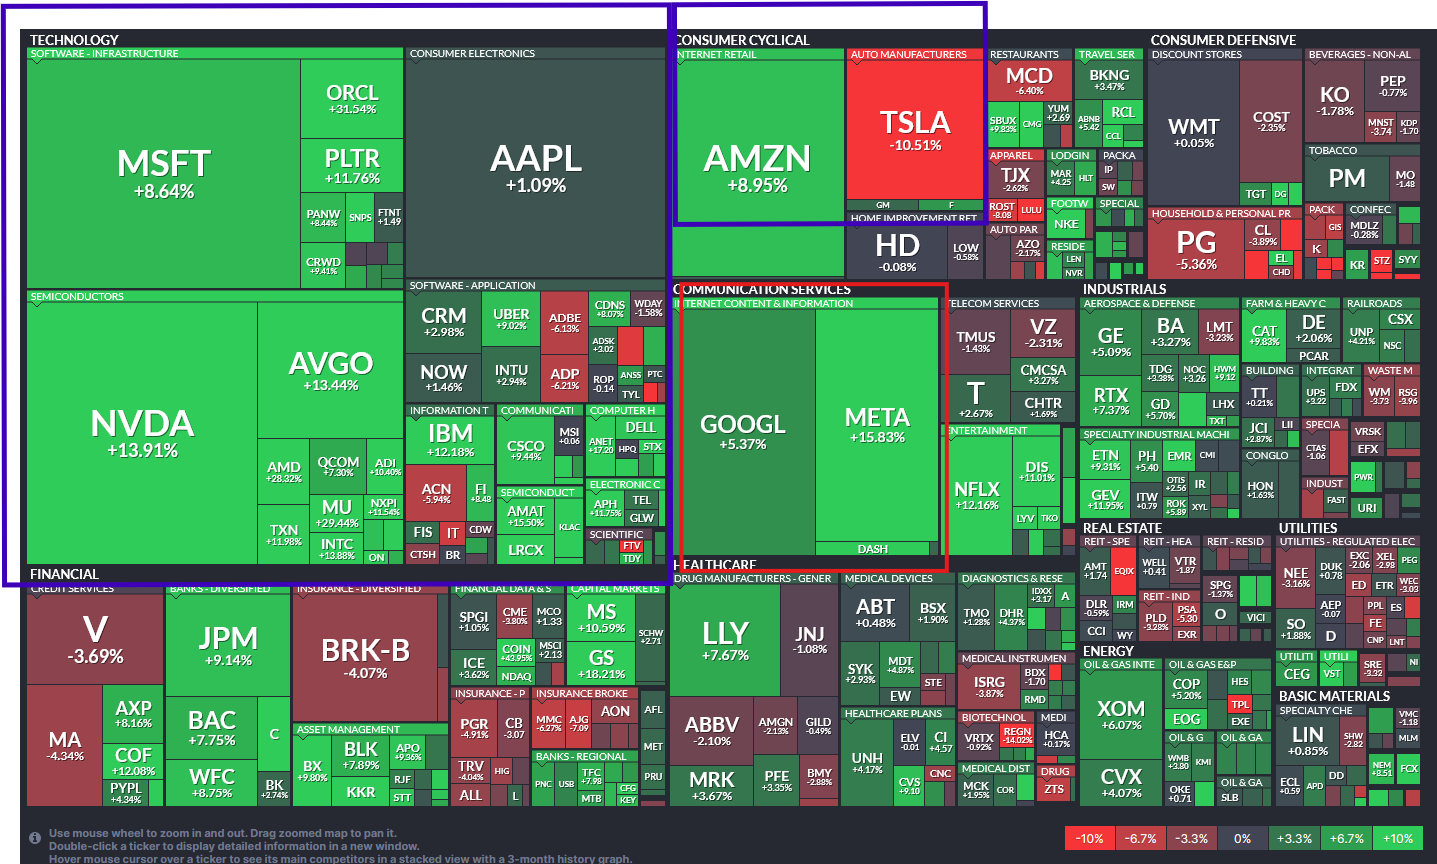
The second graphic, courtesy of FinViz, shows that the largest blocks, representing the most significant companies by market cap, are largely bright green over the last month. A significant portion of the remaining stocks is a mix of colors, not showing the same bullish consensus. It is worth noting that two large-cap stocks, Apple and Tesla, are not keeping up with the other Magnificent Seven stocks.
SLR: Could It End The Bear Market?
On June 25th, the Federal Reserve quietly announced a significant change to the Supplementary Leverage Ratio (SLR). While the headlines were muted, the implications for the U.S. Treasury market were anything but.
For sophisticated investors, this technical shift marks a subtle but powerful pivot in monetary mechanics. It could create demand for Treasuries, improve market liquidity, and push yields lower at a time when the economy is slowing. As shown in the Economic Output Composite Index (EOCI), which comprises nearly 100 data points, recent reports suggest the economy is weaker than headlines imply. The same is confirmed by the 6-month rate of change in the Leading Economic Index, which remains in contractionary territory.
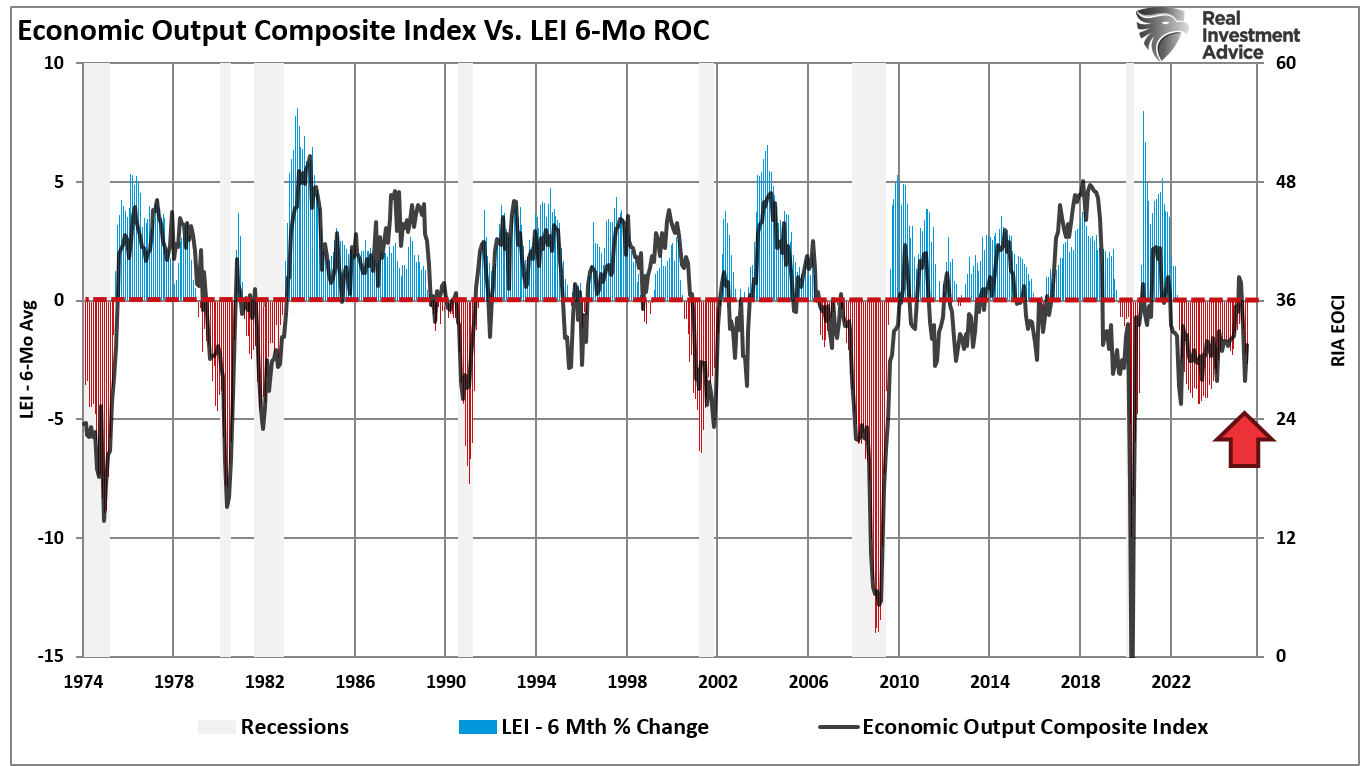
Historically, such readings have coincided with economic recessions. However, this has not been the case since 2022 due to the massive amounts of monetary stimulus that have kept the economy growing. That support is quickly fading, potentially putting the major banks at risk, which brings us to the SLR.
Tweet of the Day

“Want to achieve better long-term success in managing your portfolio? Here are our 15-trading rules for managing market risks.”
Please subscribe to the daily commentary to receive these updates every morning before the opening bell.
If you found this blog useful, please send it to someone else, share it on social media, or contact us to set up a meeting.

