In this week’s “Technically Speaking,” the “Golden Cross” arrives, but are the bulls safe? As noted two weeks ago, is the 50/200 dma crossover is historically bullish for equities. However, with markets facing one of the worst earnings declines on record, could overly exuberant investors be walking into a trap?
Let’s start with what we wrote previously:
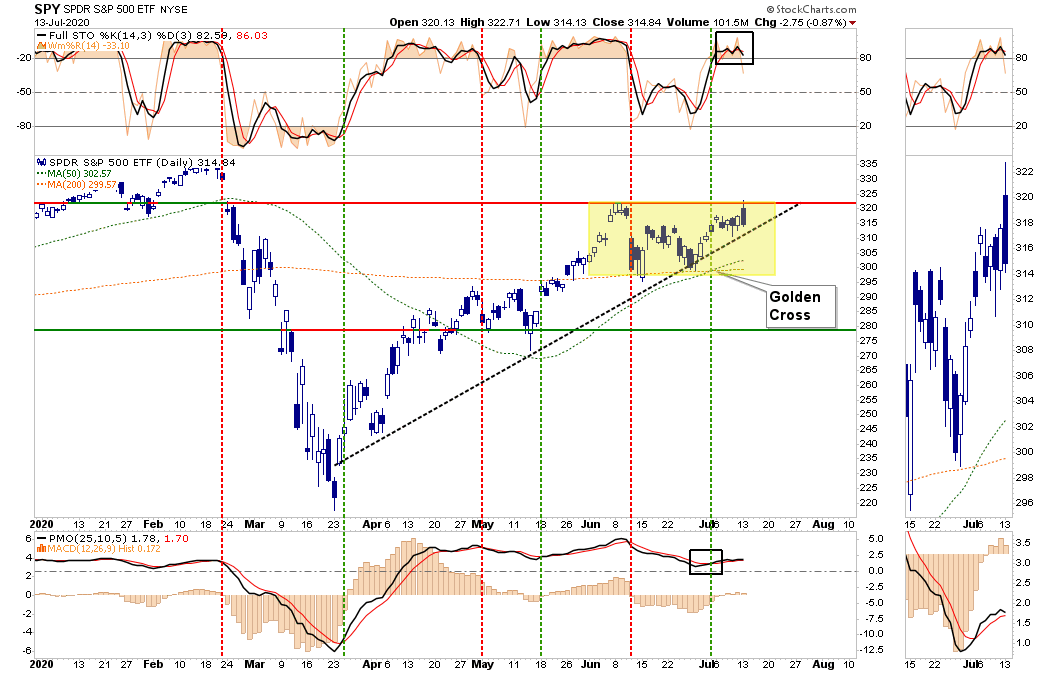
“As shown below, the market broke out of that consolidation and triggered “buy signals” across multiple measures. This breakout will give the “bulls” an advantage in the short-term with a retest of the June highs becoming highly probable.”
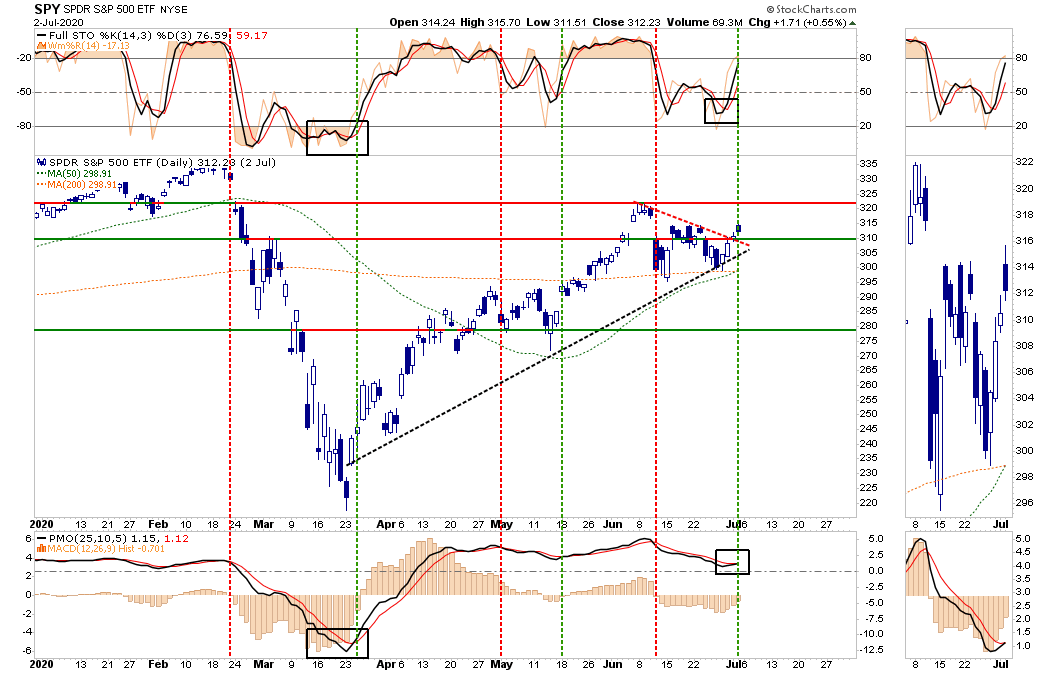
“The bulls will also gain some additional support from the “Golden Cross” (when the 50-dma crosses above the 200-dma). That “bullish signal” will likely occur over the next week or two depending on market action.”
As noted then, the “bullish supports” for the market kept our portfolio allocations weighted towards equity risk.
The “Golden Cross” Arrives
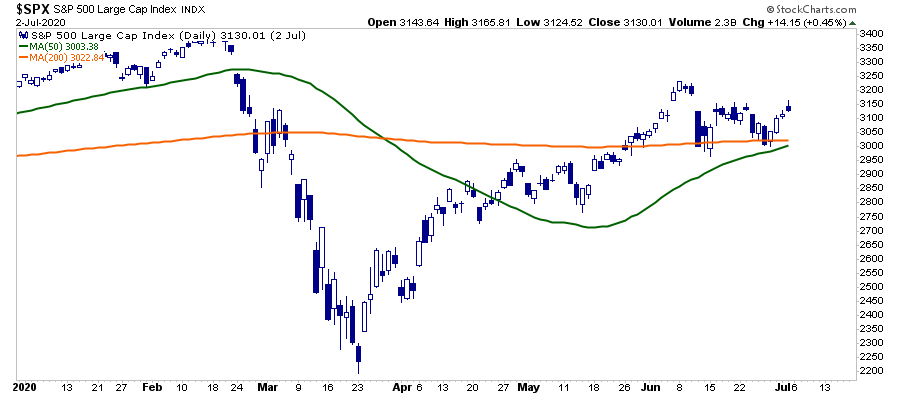
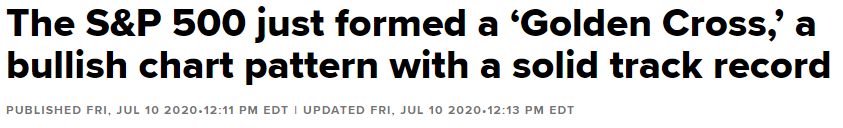
This week, the “Golden Cross” occurred as the 50-dma crossed back above the 200-dma. As suspected, the media was quick to take note. As noted by this headline from CNBC:
Bloomberg, via Yahoo Finance, was also quick on the trigger:
“The S&P 500 is sending a technical signal that has marked the end of every bear market in modern history.”
As Jeffrey Marcus noted at RIAPRO.NET (30-Day Risk Free Trial) the “Golden Cross” is indeed bullish for stocks.
“On Thursday, the S&P 500’s 50-DMA crossed above the 200-DMA. Such is known as a “Golden Cross” and has now happened 25-times over the past 50-years. The long term performance of the S&P 500 following such an occurrence is unabashedly positive.
TPA calculated the performance of the S&P 500 10, 20, 40, 80, 160, and 320 days following each of the 25 Golden Crosses since 1970. The average performance is 0.88%, 0.98%, 3.25%, 6.73%, 9.57%, and 15.70%, respectively.
The positive cross has happened 6-times in the past 10-years. The averages for 10, 20, 40, 80, 160, and 320 days following each was 0.53%, 0.89%, 2.64%, 8.17%, 10.45%, and 20.95%, respectively. “

No Guarantee Short-Term
While it is undoubtedly bullish from a historical standpoint, it isn’t always as simple as it seems. As Jeff further notes:
“There were years when using the S&P 500’s Golden Cross as a buy signal was a lot trickier than just owning stocks for the entire 320 days. In the years of 1977, 1984, 1990, 1994, 1999, 2015, and 2019 were years, the signal either did not work or spent long periods in negative territory. ”
Such was a point also confirmed by Sentimentrader.com, where Jason Goepfert has analyzed these types of technical signals for decades. He found they’re “barely useful” as a standalone metric. Take 2019, for example, when a golden cross registered, only completely to reverse a year later with the Covid-19 crash.
“We wouldn’t put a lot of faith in the golden cross by itself. The biggest reason for optimism is that it has reversed what had been a very negative medium- vs. long-term trend. That has led to big gains over the next 6-12 months every time over the past 70 years.” – Jason Goepfert
2015-2016
An excellent example of a period where the “best of indicators” can lead you astray was in 2015. While the “Golden Cross” has a strong record over 12-months, it doesn’t mean it will be a straight line higher.
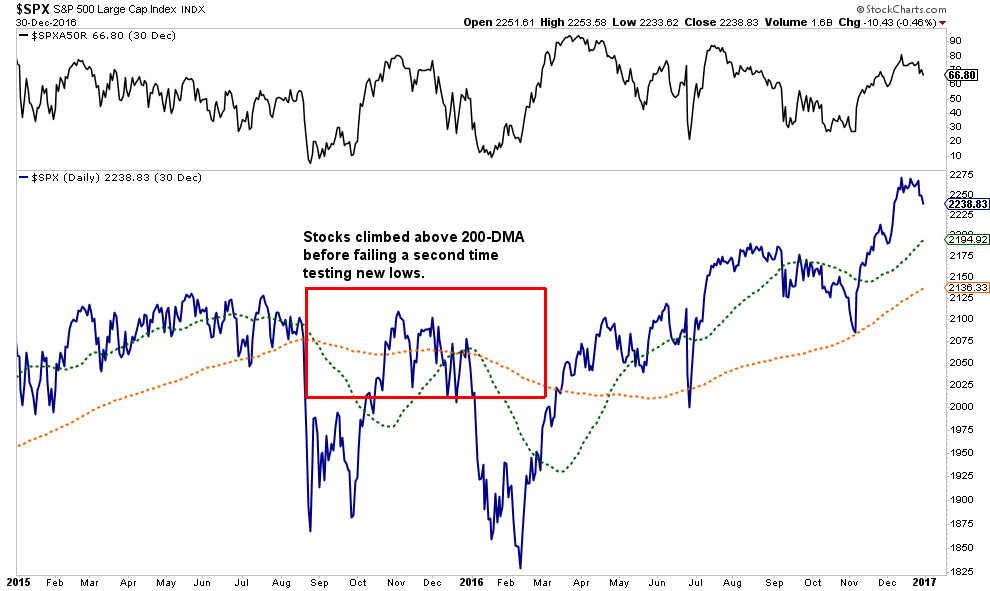
At that time, the markets climbed above the 200-dma, combined with a “Golden Cross” as the 50-dma also “crossed the Rubicon.” While the media bristled with bullish excitement, it was quickly extinguished as the markets set new lows as “Brexit” engulfed the headlines.
Importantly, while concerns about a “Brexit” on the global economy were valid, “Brexit” never materialized.
Conversely, the economic devastation in the U.S., and globally, is occurring in real-time. The risk of market failure as “reality” collides with “fantasy” should not be dismissed. It CAN happen.
Such doesn’t mean the next great “bear market” is about to start. It does mean that a correction back to support that reverts those overbought conditions is likely.
Such is why, as we discussed this past weekend, we took actions to reduce risk within our portfolios.

Lot’s Of Hope
The current advance is not built on improving economic or fundamental data. It is largely built on “hope” that:
- The economy will improve in the second half of the year.
- Earnings will improve in the second half of the year.
- Oil prices will trade higher even as supply remains elevated.
- The Fed will not raise interest rates this year.
- Global Central Banks will “keep on keepin’ on.”
- The U.S. Dollar doesn’t rise
- Interest rates remain low.
- Bankruptcies and Delinquencies will subside.
- More stimulus will come from the Federal Government
- A vaccine will soon be available.
- The pandemic will subside
- There will be a “V-shaped” economic recovery
- Employment will recover quickly.
I am sure I forgot a few things, but you get the point. There is a lot of “hope.”
However, “reality” may be more disappointing. Such is particularly the case with valuations expensive, markets overbought, and sentiment pushing back into more extreme territory.
There is much that could go wrong.

Technical Review Of The Market
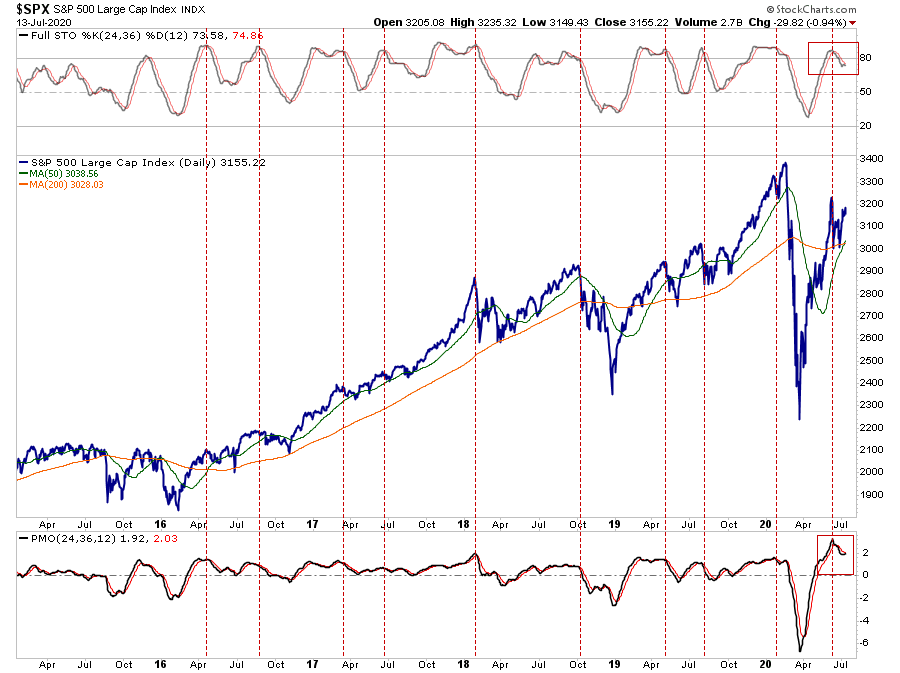
While the “Golden Cross” is certainly bullish over the next 6-12 months, it is important to note that markets are currently egregiously overbought on a short-term basis.
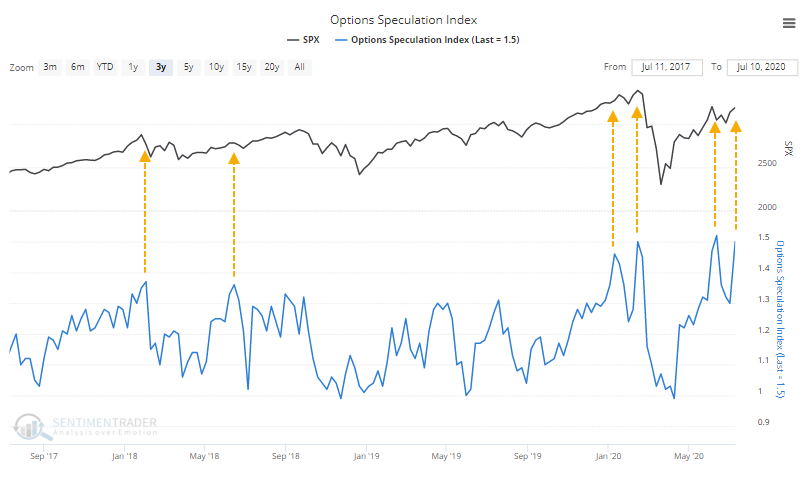
Furthermore, speculative excess has certainly become evident in the market on a variety of levels. However, options contracts are an excellent indicator of exuberance. As Jason went on to note:
“In mid-February, we saw that options traders were speculating heavily, a disturbing wrinkle in the positive momentum that markets were enjoying at the time. The pandemic slapped that speculation out of them. For a while.
They returned in force, and by early June, surpassed any previous speculative record. It was enough to push the ROBO Put/Call Ratio to the lowest level since November 2007.
Among all traders, the Options Speculation Index gives us a very good view of the distribution of speculative versus hedging activity on all U.S. exchanges. Once again, it’s above 50%, meaning that they opened 50% more bullish contracts than bearish ones.

Rebalancing The Equity Portfolio
For all of these reasons, this is why we chose to reduce our risk a bit last week.
“For the second time in a single year, we have begun the profit-taking process within our most profitable names. Apple, Microsoft, Netflix, Amazon, Costco, PG, and in Communications and Technology ETF’s.
(Note: Taking profits does not mean we sold the entire position. It means we reduced the amount of our holdings to protect our gains.)”
Taking profits in our portfolio positions remains a “staple” in our risk management process. We also continue to maintain our “hedges” in fixed income, precious metals, and a slight overweight in cash.
We don’t like the risk/reward of the market currently and continue to suspect a better opportunity to increase equity risk will come later this summer. If the market violates the 200-dma, or the current consolidation is breached to the downside, we will reduce equity risk and hedge further.
My colleague Victor Adair at Polar Trading, previously made a valid observation.
“The growing divergence between the ‘stock market’ and the economy the past several months might be a warning flag that Mr. Market is too exuberant. With the Presidential election just over 3-months away, the polls show that Biden may be the next President. The U.S./China tensions have been escalating, and the virus’s first wave continues to spread around the globe.”
I agree. While the markets may be ignoring the risks for the moment, markets have a nasty habit of delivering unpleasant surprises. Such is particularly the case when a handful of “Megacap” stocks are driving the markets higher. (H/T TheMarketEar.com)
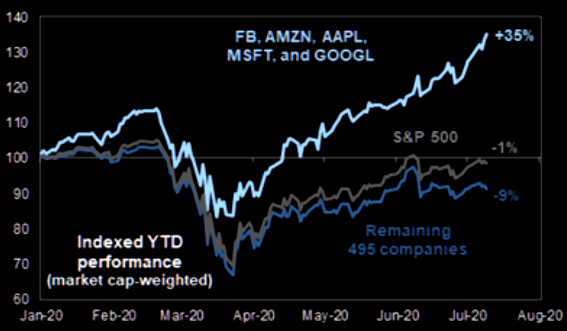
What lifted the market higher, can, and usually does, become the catalyst that pulls it down.
It’s Probably A Trap
I can’t explain the current market environment. Yes, it is the liquidity from the Fed. It is also a chase for momentum. Regardless of the explanation, price is driving portfolio management for now.
We can deny it, rail against it, or call it a conspiracy.
But in the “other” famous words of Bill Clinton: “What is…is.”
The markets are currently betting the economy will begin to accelerate later this year. The “hope” that Central Bank actions will indeed spark inflationary pressures and economic growth is a tall order to fill, considering it hasn’t worked anywhere previously. If Central Banks can indeed keep asset prices inflated long enough for fundamentals to catch up with the “fantasy” – it will be a first in recorded human history.
My logic suggests that sooner rather than later, someone will yell “fire” in this very crowded theater.
When that is, is anyone’s guess.
In other words, this is all probably a “trap.”
But then again, “hope does spring eternal.”
Pay attention to how much risk you are taking. The “Golden Cross” doesn’t provide the bulls a “guarantee of safety.”

