
Last week, the stock market rally was one of the best performances in nearly a year. The S&P 500 surged 3.4%, the Nasdaq climbed 4.4%, and the bulls declared the correction over. As I have stated before, having watched markets for more than 35 years, I have come to recognize the difference between a relief rally and the end of a corrective cycle. So far, this remains a relief rally until overhead resistance is broken through and successfully retested. The question that matters now is whether the stock market rally has the institutional support to break through those resistance levels, or whether Monday’s open will reveal the reversal was already finished before most investors realized it started.
The answer, based on every technical and macro lens I use, points heavily toward the latter.
Let’s Review The Tape
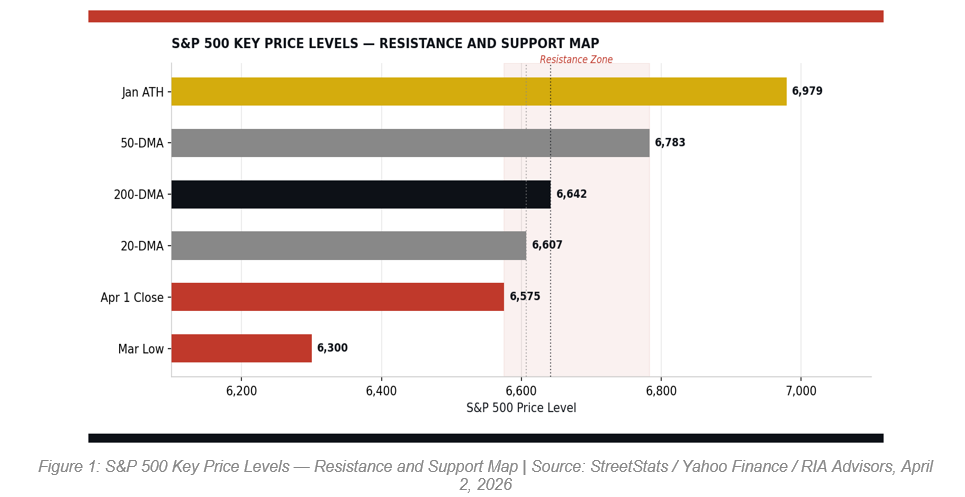
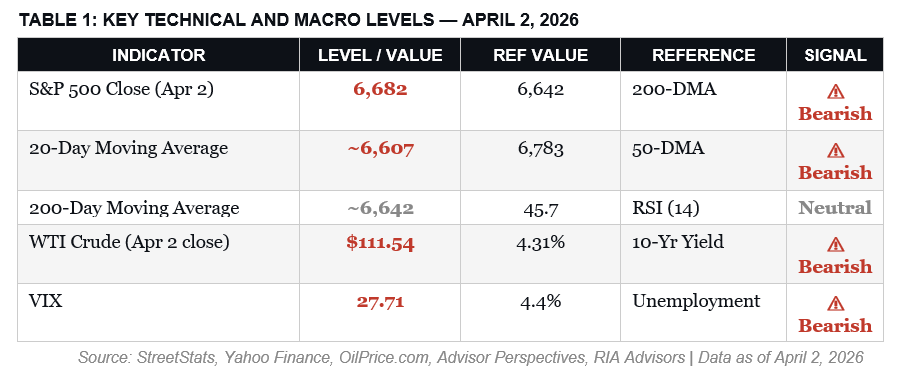
The S&P 500 closed at 6,582, bouncing roughly 4.5% off the late-March lows near 6,300. That sounds constructive until you examine what those price levels represent. The index pushed directly into its 200-day moving average near 6,642 and remains comfortably below the 50-day moving average near 6,789. The 20-DMA trends around 6,607. Together, those three levels form an overhead cluster of resistance that has historically acted as a gravitational ceiling for stocks in corrective environments. Furthermore, the volume profile we analyzed on Wednesday confirmed the same. Many investors are trapped at those prices, holding positions at a loss and waiting for any rally to exit at break-even, which adds to the risk of a relief rally failure.
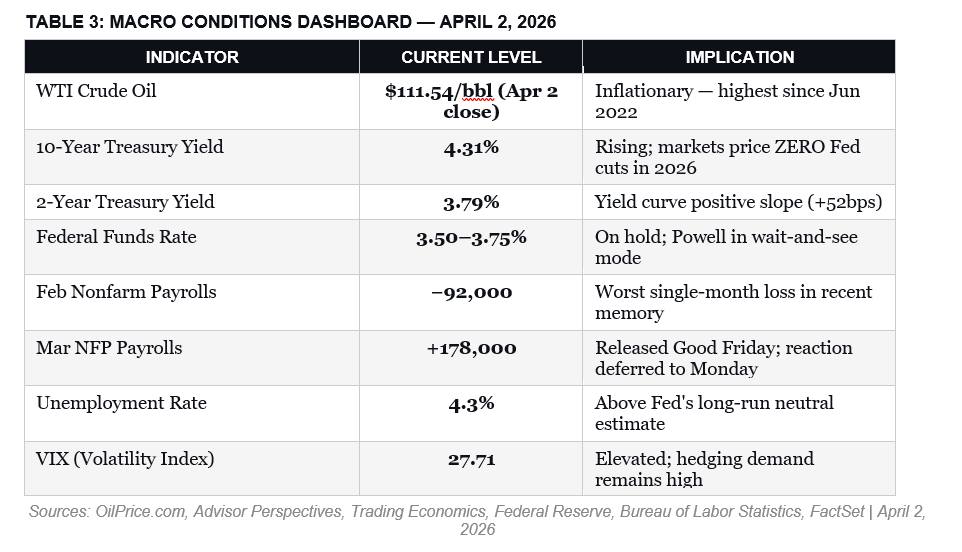
Then came Thursday’s escalation, following President Trump’s prime-time address, which offered no clear path toward ending the conflict or reopening the Strait of Hormuz. Unsurprisingly, oil responded immediately. WTI crude surged to $111.54 per barrel on settlement Thursday, the highest close since June 2022. Equity futures reversed what the bulls had built over two sessions, trading sharply lower Thursday morning before recovering to a small gain by the close. The only thing that likely helped the market end on a good note was that markets were closed for Good Friday. With the jobs report posting a gain of 178,000 on Friday, the market would likely have sold off on the expectation that the Federal Reserve is now fully trapped in terms of monetary policy.
With that said, we need to focus on what the market is telling us, which is where the MFBR index comes in.
Why You Should Listen To The MFBR Index
Our Money Flow Breadth Ratio, a rules-based institutional flow indicator we’ve backtested across 1,351 weekly observations from 2000 through 2025, currently stands at 35% and is declining.
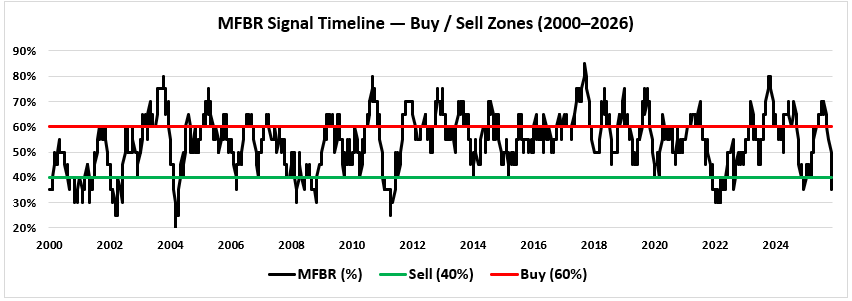
That places it squarely in the single worst sub-range within SELL territory, and historically suggests a higher degree of caution. The MFBR works by tracking weekly net dollar money flow in the S&P 500 index, counting the number of the last 20 weeks that showed positive institutional buying, and converting that count into a ratio. Readings above 60% signal sustained buying pressure, whereas readings below 40% signal sustained selling pressure. Notably, the model goes a step further and also incorporates the direction of the MFBR, whether it is rising or falling. This is because a 25-year backtest from 2000 to 2025 demonstrated that trajectory matters as much as level, particularly in transition zones.
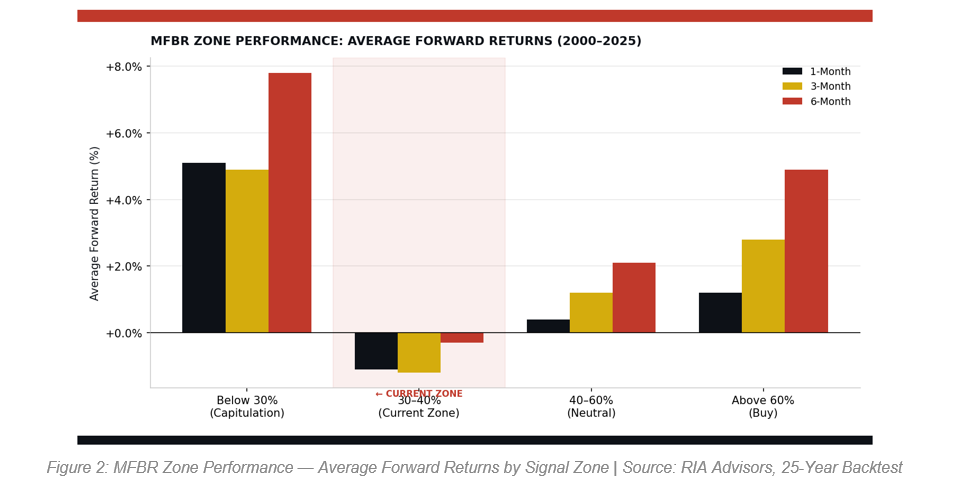
At 35% and declining, the data is unambiguous about what history suggests will happen next. Across 73 observations in the 35–40% zone, average forward returns were negative at one month (−1.1%), three months (−1.2%), and six months (−0.3%). The six-month win rate was just 34.7%, meaning the market was lower six months later nearly two out of every three times. The twelve-month win rate recovered to 58.6%, but that is still well below the all-period baseline of 75.7%. The backtest’s range of outcomes, from a best-case of +66.6% to a worst-case of −29.1% over 12 months, underscores why maximum defensiveness is the appropriate posture right now.
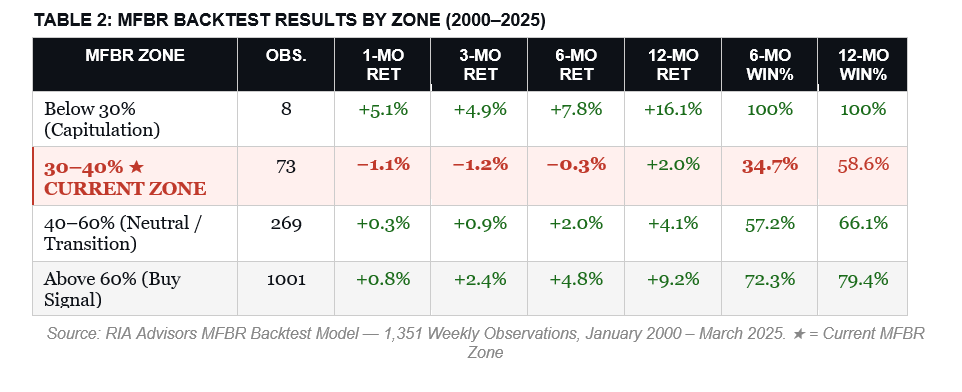
Bottom line: Until the MFBR stabilizes and recovers sustainably above 50%, patience over aggression and capital preservation over return-chasing are the rules. The one exception: if the MFBR drops below 30%, historical data shows a genuine contrarian buy signal with a 100% win rate at twelve months. We are not there yet.
That is just the technical data; other factors are at play that may also have an impact.

Other Risks: Oil, Interest Rates & The Fed’s Dilemma
The macro backdrop has rarely been this unfavorable for equities simultaneously across so many dimensions. Oil is the primary driver right now, with Brent crude oil spot price rising sharply following the onset of military action in the Middle East. With petroleum shipments through the Strait of Hormuz being disrupted and significant Middle East production shut in, recession risks are rising. The longer the situation persists, the greater the risk that the oil impulse translates into broader inflationary pressures. (As shown, there is a decent correlation between oil prices and CPI.)

That puts the Federal Reserve in a genuinely impossible position. It is also one that should concern every equity investor far more than the day-to-day volatility. Markets are now pricing zero-rate cuts for the remainder of 2026. The 10-year Treasury yield closed at 4.31%, while the 30-year yield was 4.88%. Fed Chair Powell has explicitly acknowledged the tension.
“Inflation remains above target, the labor market is softening, and the conflict has introduced significant uncertainty into every forecasting model the FOMC relies on.”
This is the risk where energy-driven inflation squeezes real purchasing power while employment deteriorates. The Fed cannot cut without inflaming inflation expectations, and it cannot raise rates without breaking an already-fragile labor market. The result is paralysis at exactly the moment markets need a clear policy anchor.
The jobs report adds another layer of complexity. March’s nonfarm payrolls print came in at +178,000. That was much stronger than the 60,000 estimates, and the unemployment rate dropped to 4.3%. With the market closed on Friday, the reaction will be delayed until Monday’s opening.
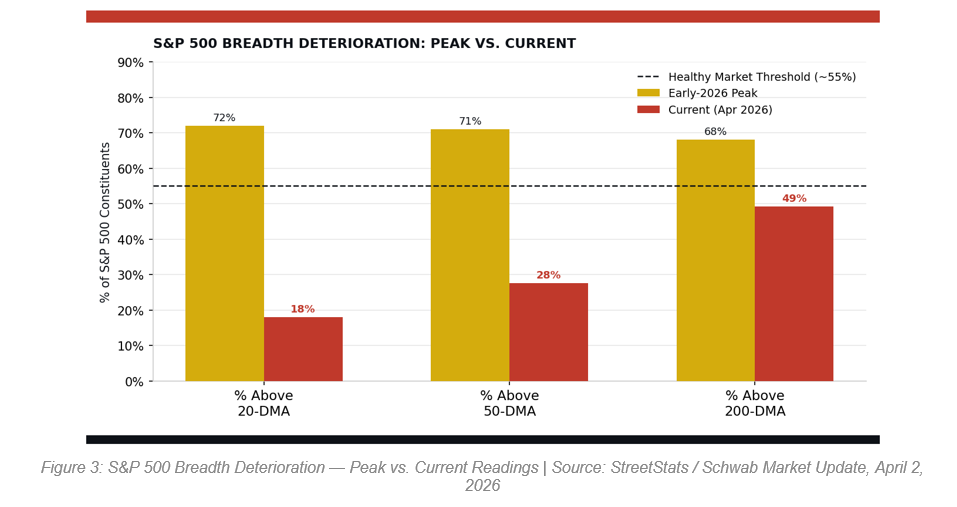
Furthermore, last week’s stock market rally was not broad, which matters far more than the headline index gain suggests. As of April 2, just 27.6% of S&P 500 constituents were trading above their 50-day moving averages. That is up from below 20% at the March low, but down ~70% during the broad-based advance earlier this year. The percentage of S&P 500 stocks above their 200-day moving average sits below 50%. These types of reading are more akin to corrections and bear markets than bull markets.
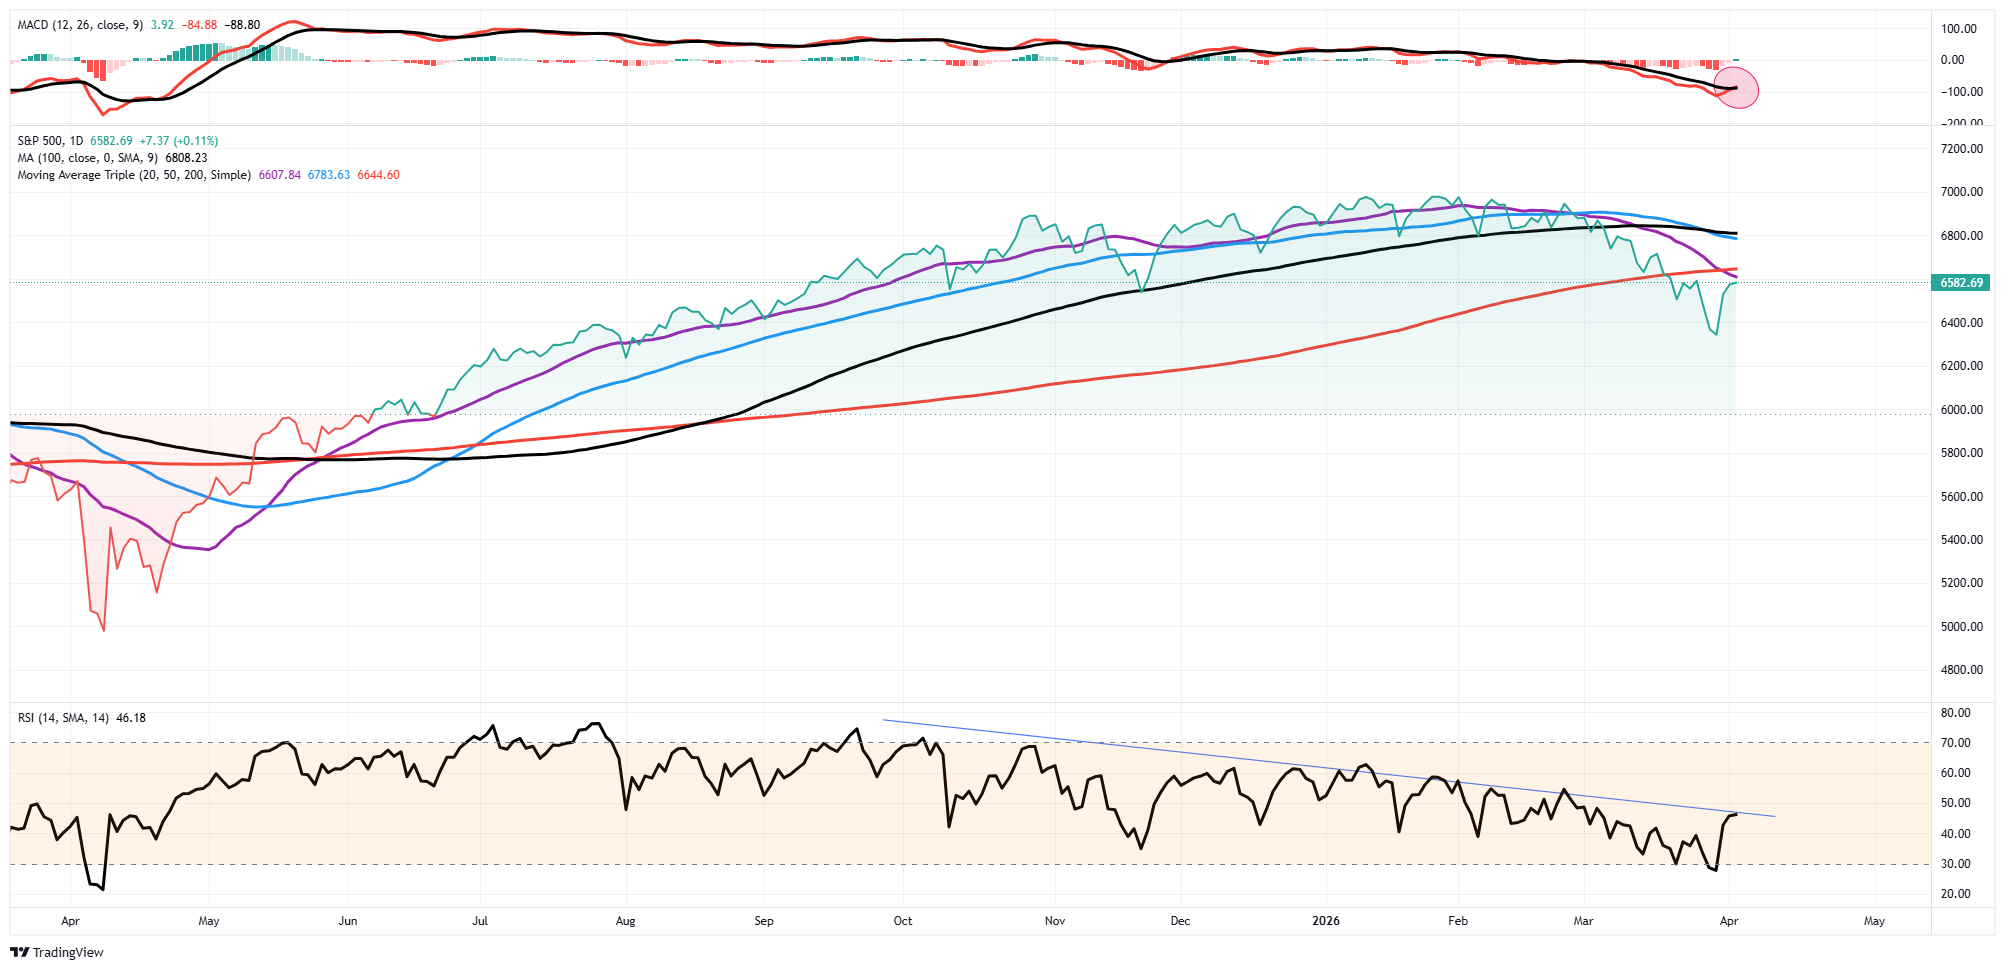
There are positives to consider. Relative strength (RSI) on the S&P 500 recovered from deeply oversold levels near 30 in late March to approximately 45. That is encouraging from a mean-reversion perspective; however, it is still below the neutral 50 level. The VIX is holding near 28, confirming that institutional hedging demand remains elevated. When professionals are still buying protection at these levels, they are telling you something about their conviction in the rally. Momentum, as measured by the MACD indicator, remains in negative territory. but did trigger a short-term buy signal. However, these momentum conditions are consistent with what we’ve seen historically in corrective environments. Short-covering bounces tend to fade back into the primary downtrend.
April seasonality deserves acknowledgment. Historically, April has been one of the stronger months for equities. But that historical average includes far calmer geopolitical and macroeconomic backdrops than today’s. A seasonal tailwind is a weak force compared to oil at $111, a frozen Fed, and a still weak labor market that hasn’t fully felt the oil price spike. Furthermore, the MFBR data also points to sustained institutional selling pressure.
So, while there are certainly reasons to be bullish, there is risk in that view.

Where The Bullish Case Potentially Fails
I take the bull case seriously because good analysis requires it, and there are genuine counterarguments worth acknowledging.
- First, the MFBR’s own 25-year backtest shows that when the ratio drops below 30%, a true capitulation washout has occurred. The subsequent returns flip dramatically positive: +5.1% at one month, +7.8% at six months, and a 100% win rate at twelve months. We’re not there yet, but that threshold isn’t far from the current 35% reading.
- Second, the volume profile below 6,300 thins out considerably. The lack of sellers could allow prices to squeeze back toward the resistance without much friction if buyers step in.
- Third, the first-quarter earnings season begins next week. FactSet currently projects roughly 13% S&P 500 earnings growth. If that number is confirmed by actual results, it could provide the fundamental catalyst bulls need.
The problem is that none of those factors changes the immediate risk-reward math. The 200-DMA remains resistant on a closing basis, despite last week’s stock market rally. Breadth has not recovered. Institutional money flow is in sell territory and falling. Oil is near a multi-year high with no clear resolution in sight. And the biggest monthly economic data release of April dropped on a closed market, deferring the full reaction to Monday. At the current MFBR reading, the historical six-month win rate is 34.7%. That reading indicates that selling near this resistance remains the correct trade in roughly 2 out of 3 comparable setups.
For now, the burden of proof is on the bulls, and last week’s rally has not yet met it.
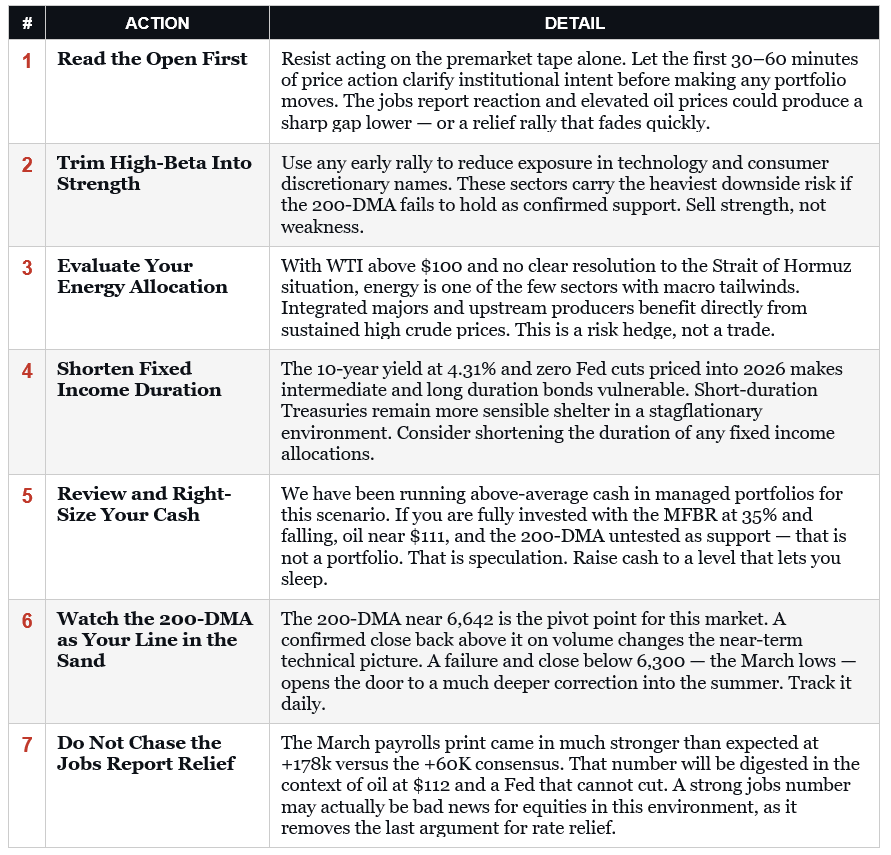
As such, following last week’s stock market rally, here are seven actions to consider when trading begins on Monday.
The summer sets up as one of the more difficult stretches for equities in recent memory. Oil above $100 for any sustained period has historically pressured both consumer spending and corporate margins simultaneously. The Fed will unlikely be able to provide a rate-cutting tailwind that markets previously relied on. Finally, the labor market, which was already softening before this conflict began, is now doing so with the added headwind of energy-driven inflation. None of that means a market crash is inevitable. However, it does mean that the risk-reward profile of being aggressively long equities at current levels is poor, and that patience, at least for now, is its own form of return.
Defense over offense. Trade accordingly.

