
An old Wall Street adage advises investors to sell in May and go away. Given that we have just turned the calendar to June, it’s worth assessing whether selling stocks and holding cash for the next seven months makes sense. The graph and data below are based on two trading strategies, both starting in January 1970. The first is a simple buy-and-hold strategy. The second is the sell in May and go away strategy. This entails buying in January and selling in May. From May through December, the portfolio earns Treasury yields. The results may likely satisfy those following the sell in May strategy, as well as those who think it’s nonsense.
From 1970 to 2022, the sell in May strategy outperformed the buy-and-hold plan. However, over the last few years, the buy-and-hold strategy has performed significantly better. From a risk-adjusted perspective, sell in May is a more effective strategy. The Sharpe Ratio in the table represents the portfolio returns divided by its volatility. The higher the ratio, the greater the return per unit of risk. However, bear in mind that selling in May entails holding zero-volatility cash for more than half of every year.
A glance at the median, average, and period returns reveals that the buy-and-hold strategy is more effective when volatility is not taken into account. The bottom line is that it’s tough to compare the strategies. From a risk-adjusted return perspective, it’s worth selling in May. However, from a longer-term perspective, the data suggests holding.

What To Watch Today
Earnings

Economy

Market Trading Update
As discussed yesterday, the market continues consolidating the May gains with the MACD “sell signal” now triggered. The good news is that consolidation is now allowing the weekly “sell signals” to turn higher, which may signal the end of the correction process in the next month, unless a larger reversal occurs. While there seems to be minimal evidence to suggest a larger drawdown, the risk is not entirely absent.

As we enter June, share buybacks are beginning to slow. As shown, there is a very high correlation between share buybacks and the direction of the market, given that buybacks add an additional buyer to the market. With companies going into “blackout” in the middle of June, that “buyer” will evaporate from the market before the beginning of the Q2 earnings season. Does this mean the market will crash? No. However, it suggests that any weakness in the market, given the current overbought conditions, could be amplified until buybacks return in late July.

We remain bullish on the overall market, but are waiting for a better entry point to deploy the excess cash holdings in our portfolios. For now, the cash continues to provide a hedge against market volatility.

Finding Odd Couples
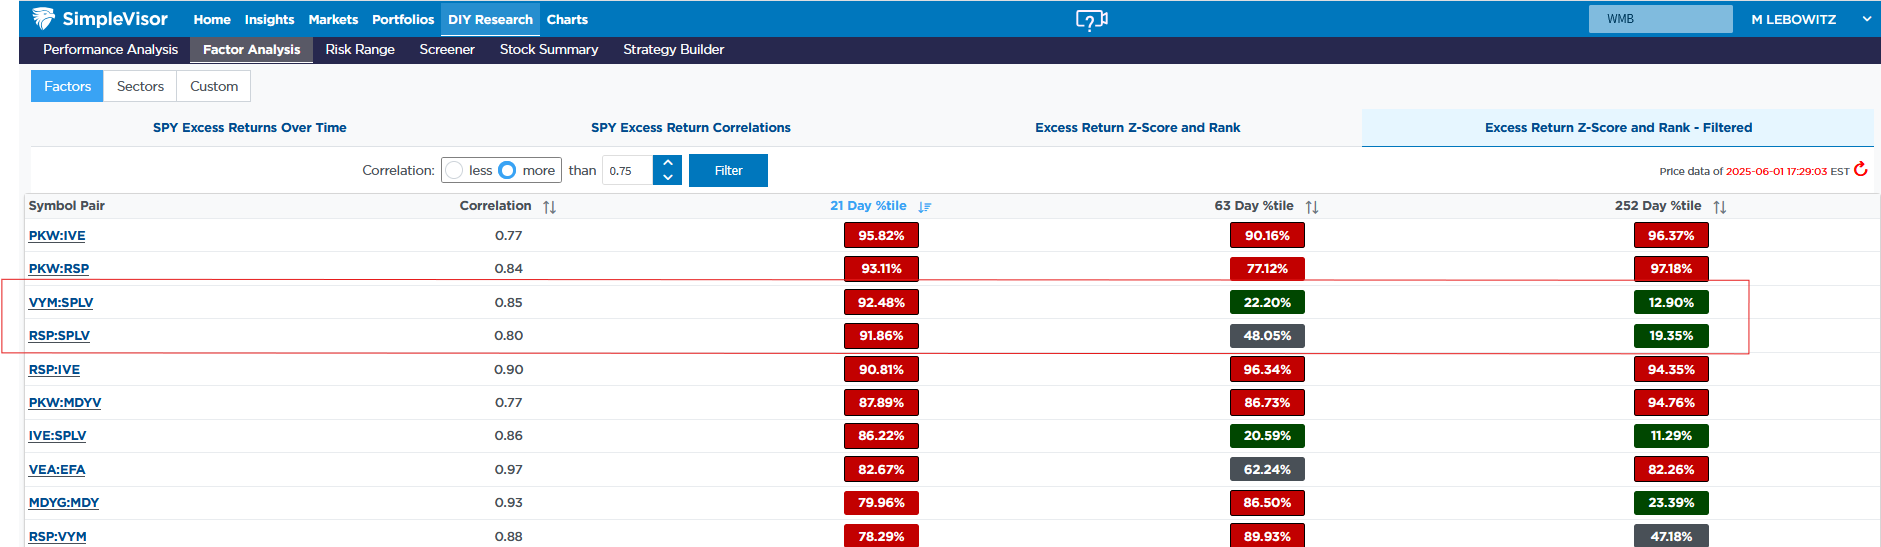
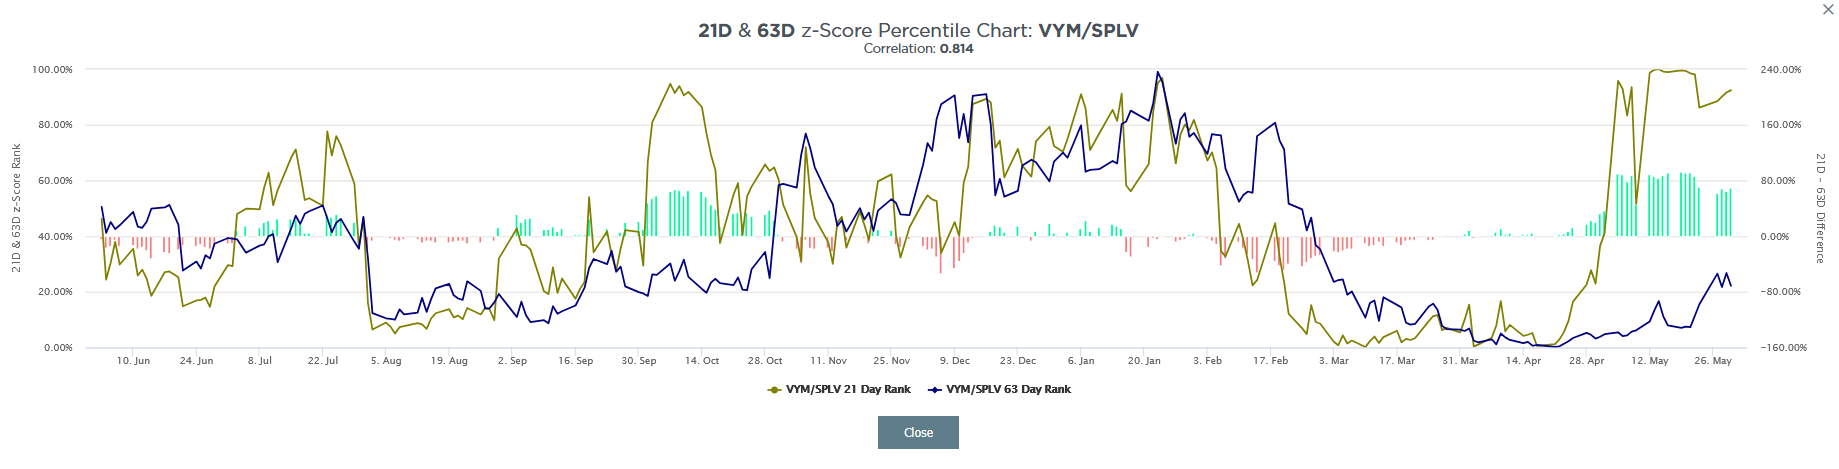
This week, we take a different approach in using our SimpleVisor relative and absolute analysis tool. The page below compares the correlation of excess returns (relative to the S&P 500) of various stock factors. The list is sorted by the strongest relationships over the last 21 trading days. To the right, it also shows the correlation of the excess returns over the past 63 and 252 trading days. In this analysis, we wanted to find new relationships. As we highlight with the red rectangle, VYM and SPLV, as well as RSP and SPLV, exhibit a powerful recent correlation; however, this correlation is much less pronounced over longer periods. If we click on the two tickers (VYM and SPLV), we get a chart of the historical relationship as shown in the second graphic.
The olive-colored line shows the shorter 21-day correlation is at its highest level in a year, but its 63-day correlation remains low. Typically, the short and medium-term correlations tend to follow each other. Therefore, can we expect the short-term correlation to decline? Or will it persist and drag the longer-term correlations up with it?
Buying Stocks Is Always Hard
Buying stocks is always hard. Particularly during corrections. Or, near market peaks. Or, when stocks are falling. And when they are rising. Oh, buying stocks is also tricky when valuations are high. And when they are low. You get the point. There is never the right time when it comes to buying stocks.
I recently read Ted Seides’s excellent post, “The Hardest Day To Invest Is Always Today.” As Ted notes, there is always a reason NOT to invest in the financial markets.
“Today is no exception. We face heightened uncertainty from tariffs, economic conditions, valuations, private market liquidity, and crowding in alternatives. Even leading macro strategists have begun to question the durability of U.S. exceptionalism. When stocks, bonds, and alternatives appear unattractive, what’s an investor to do?”
I agree. When buying stocks, we can always rationalize why we shouldn’t. Notably, the reasoning is always sound and logical. Such is particularly true if you consistently follow an “echo chamber of negativity” on the many podcasts, blogs, and mainstream media that use fear to generate views and clicks.
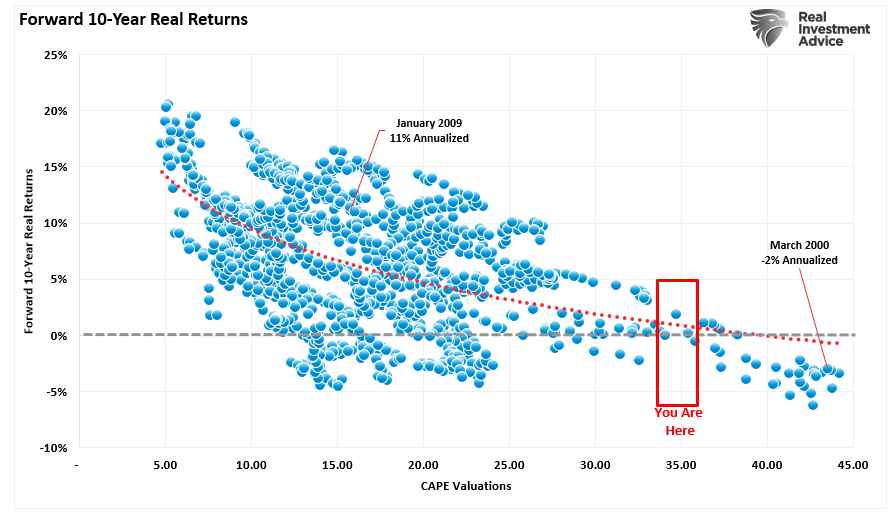
For example, many investors have argued that lofty valuations will impair forward returns. The data supports that claim.
Tweet of the Day

“Want to achieve better long-term success in managing your portfolio? Here are our 15-trading rules for managing market risks.”
Please subscribe to the daily commentary to receive these updates every morning before the opening bell.
If you found this blog useful, please send it to someone else, share it on social media, or contact us to set up a meeting.

