The Relative Value Report provides guidance on which sectors, indexes, and bond classes are likely to outperform or underperform its appropriate benchmark.
Click on the Users Guide for details on the model’s relative value calculations as well as guidance on how to read the graphs.
This report is just one of many tools that we use to assess our holdings and decide on potential trades. Just because this report may send a strong buy or sell signal, we may not take any action if it is not affirmed in the other research and models we use.
Commentary
- There was little surprising in this weeks results. The “go-go” sectors, Tech, Discretionary, and Communications continue to remain well overbought. At the same time, more conservative, value-based sectors are oversold.
- Utilities and Financials are the most oversold. Many banks will report earnings next week, so if you are tempted to bet on positive earnings reports, they do present some relative value. We have no exposure to banks or XLF, and have no plans to add at the moment primarily due to fundamental and economic concerns.
- In the Factor/Index (renamed) analysis we added Momentum (MTUM) and Equally Weighted S&P 500 (RSP). Both are assessed as a relative value versus SPY.
- QQQ and Momentum are grossly overbought. At the same time RSP, Mid-caps and Value are oversold. A market sell-off may likely coincide with a rotation to the more beaten down sectors and factors
- Mortgages remain the most oversold fixed income sector.
- The R-squared on the sigma/20 day excess return (Sectors) scatter plot is higher at .51. XLE is clearly reducing the correlation. Its score is not reflective of its recent performance versus the S&P 500.
Graphs (Click on the graphs to expand)
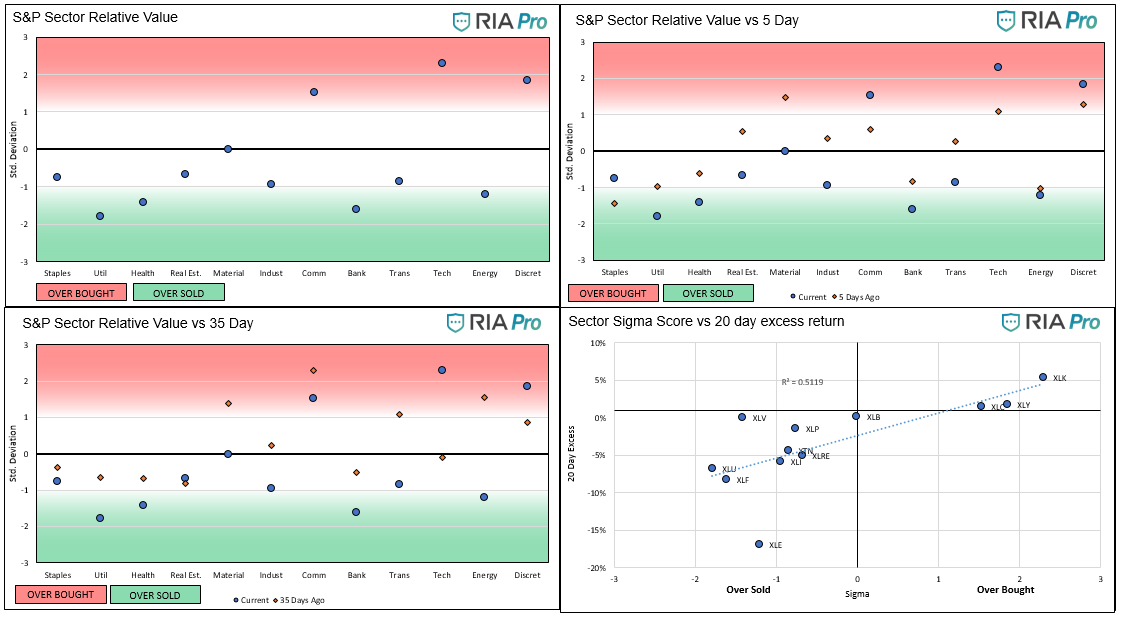
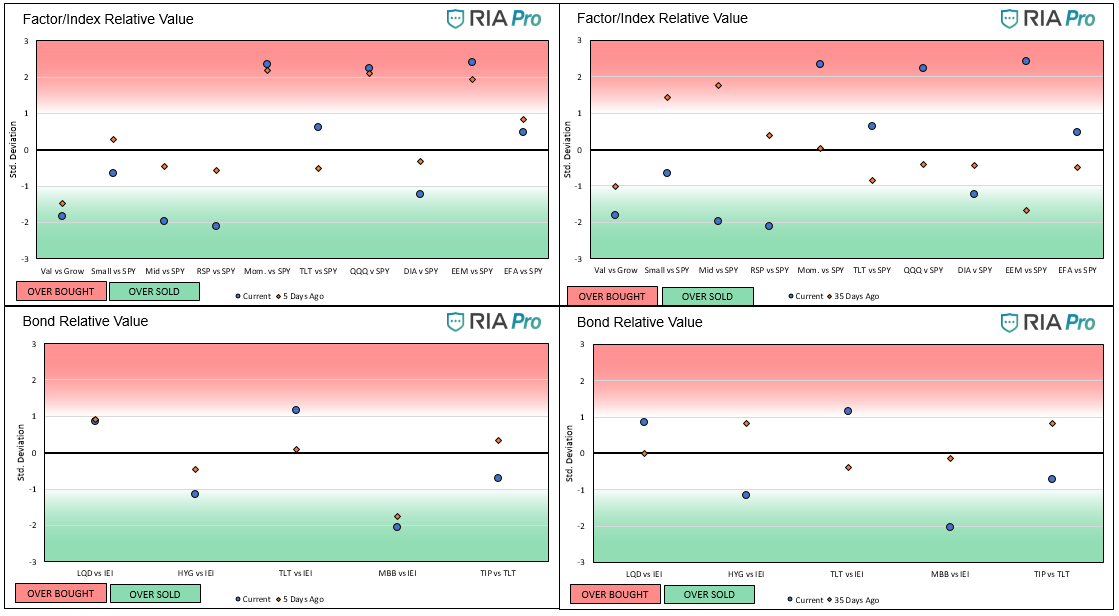
The ETFs used in the model are as follows:
- Staples XLP
- Utilities XLU
- Health Care XLV
- Real Estate XLRE
- Materials XLB
- Industrials XLI
- Communications XLC
- Banking XLF
- Transportation XTN
- Energy XLE
- Discretionary XLY
- S&P 500 SPY
- Value IVE
- Growth IVW
- Small Cap SLY
- Mid Cap MDY
- Momentum MTUM
- Equal Weighted S&P 500 RSP
- NASDAQ QQQ
- Dow Jones DIA
- Emerg. Markets EEM
- Foreign Markets EFA
- IG Corp Bonds LQD
- High Yield Bonds HYG
- Long Tsy Bonds TLT
- Med Term Tsy IEI
- Mortgages MBB
- Inflation TIP