



🔎 At a Glance
- The AI Capex Bill Comes Due
- Market Brief & Technical Review
- From Lance’s Desk: AI Capex Depreciation Risk Is The Catch To Record Earnings
- Market stats, screens, and risk indicators
🏛️ Market Brief – Eight Sectors Higher, Index Still Lower
The S&P 500 finished the week at 7,411.98, down about 0.6%, as an AI capex scare and an oil shock collided into its second straight weekly decline and the first back-to-back down weeks since March. The headline number hides what actually happened. Underneath a falling index, the average stock held up just fine.
Eight of the eleven S&P sectors rose on the week. Energy led, up 3.4% as crude spiked, and the more defensive and cyclical corners of the market, utilities, industrials, materials, and real estate, all gained ground. Equal-weight RSP actually finished higher, up 0.09%, while the cap-weighted SPY fell 0.59%. That gap tells the story. The damage was surgical, concentrated in exactly two places: communication services, down 3.9%, and consumer discretionary, down 5.2%. Those are the buckets that hold Alphabet, Meta, Amazon, and Tesla.
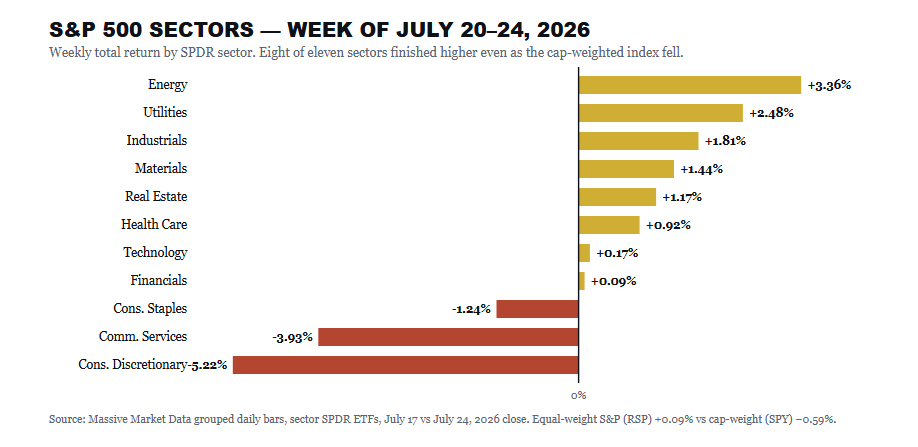
Thursday was the event. The Magnificent Seven shed roughly $800 billion in a single session, the worst megacap day since the April 2025 tariff shock. The triggers were Alphabet raising its capital spending plans again and Tesla’s profit sinking. As we warned in Momentum Meltdown Catches Traders By Surprise, the market’s narrow leadership was always the biggest risk to the tape. This week, the generals took the hit while the troops did not. The Nasdaq Composite lost about 2% on the week, the worst of the major averages, while the Dow and the small-cap Russell 2000 barely budged.
Two other forces pressed on stocks. Oil surged with Brent briefly tagging $100 for the first time since May on fresh attacks in the Red Sea. WTI booked its biggest weekly gain in months even after slipping to about $89.57 on Friday. Rising crude prices pushed the 10-year Treasury yield up to 4.67% midweek before easing on Friday as oil retreated. A new round of tariffs also took effect, but none of them triggered panic. The VIX rose about 12% on the week but still closed under 20, near 18.6.
So we head into a loaded week with the index below its 50-day moving average, the momentum names wobbling, and breadth quietly improving. The question is whether that broadening is the rally getting healthier or the last leg before the leaders drag everything lower.
📈Technical Backdrop – Below The 50-Day, Testing Support
The S&P 500 spent most of the year riding above its 50-day moving average, and we have warned for the last couple of weeks that a break lower would be worth paying attention to. That break occurred on Thursday, as the index closed the week at 7,411.98, roughly 0.8% below the 50-DMA at 7,467, marking its first decisive break below that line in months.
Momentum has clearly rolled over. The 14-day RSI sits in the mid-40s, below the neutral 50 line but not yet oversold, suggesting there is room for further downside before the tape gets stretched. The MACD agrees with the signal line crossing bearish about a week ago, and the histogram keeps widening to the downside. This is what the early innings of a pullback look like, not the middle or the end.

One encouraging detail sits beneath the surface. The tight link between the hyperscalers and the semiconductors has broken down, and the chip complex actually held up on the week, even as the megacaps were sold. Decliners still outran advancers by roughly three to one on the New York Stock Exchange during Thursday’s rout. This was a real risk-off session, not a quiet drift. A theme that rotates internally behaves very differently from one that investors are abandoning wholesale.
The bigger trend is still intact. The 200-day moving average sits at 7,001, and the index remains almost 6% above it. A slide to the 50-DMA or even the July closing low near 7,354 would be entirely normal inside an ongoing uptrend. The line that matters is the 200-DMA. Lose that, and the conversation changes.

In our own models, we continue to hold the AI complex at target weight rather than above it. We are not adding to them, given next week’s hyperscaler prints; instead, we would rather let the reports clear and buy confirmation than pay up for a guess. That discipline has kept risk contained through every one of this year’s AI-driven air pockets.
Here is the setup for next week. First resistance is the 50-DMA at 7,467, then the early-July high near 7,566, and the record close at 7,612. On the downside, watch 7,354, then the June closing low at 7,266, and the 100-day average at 7,172. A close back above the 50-DMA would repair most of the technical damage. A close below 7,266 would put the 200-DMA in play and argue for a more defensive posture.
🔑 Key Catalysts Next Week
Next week is the most consequential stretch of the summer. The Federal Reserve makes its decision on Wednesday, and four of the five largest companies in the index report within about 48 hours of that decision.
Start with the Fed. The FOMC meets July 28 and 29, with the decision at 2:00 p.m. Eastern on Wednesday and Chair Warsh’s press conference at 2:30. There is no new dot plot at this meeting, so the statement language and the press conference are the whole show. The funds rate has held at 3.50 to 3.75% all year on sticky inflation. This week’s oil spike does not make the case for a cut any easier. Watch how Warsh frames the inflation risk coming from energy.
Then the earnings deluge. Microsoft and Meta report on Wednesday after the close, and Apple and Amazon follow on Thursday after the close. FactSet has S&P 500 earnings growing about 24.7% in the second quarter, marking the second straight quarter above 20%. The bar is high, and the market’s patience is thin. Companies that have missed this season were punished harder than usual, falling an average of 4.2% against a historical norm closer to 2.9Z%.

The macro calendar fills in around those events. Consumer Confidence and home-price data land on Tuesday. The advance reading of second-quarter GDP and the June PCE deflator, the Fed’s preferred inflation gauge, both print Thursday morning at 8:30. That lands right on top of the Apple and Amazon reports that evening. Friday brings the Employment Cost Index and the final read on consumer sentiment. There is no monthly jobs report this week, so the Fed and the megacap prints will set the tone on their own.
For portfolios, the sequencing matters more than any single release. Wednesday afternoon delivers the Fed plus Microsoft and Meta. Thursday delivers growth, inflation, and the other two megacaps. By Friday’s close, we will know whether the AI capex trade can absorb both a cautious Fed and its own cash-flow math. Position sizes should reflect that this is a week built for surprises.
Need Help With Your Investing Strategy?
Are you looking for comprehensive financial, insurance, and estate planning services? Need a risk-managed portfolio management strategy to grow and protect your savings? Whatever your needs are, we are here to help.

💰 The AI Capex Bill Comes Due
On Friday, I laid out the accounting catch hiding inside this year’s record earnings in AI Capex Depreciation Risk Is The Catch To Record Earnings. The short version is simple. The AI capex boom has flattered reported profits while quietly draining cash, and next week, four of the five biggest spenders report at once. This is where the theory meets the tape.
The five biggest hyperscalers are on track to spend north of $725 billion on capital projects in 2026, up from roughly $412 billion last year. Yet only about $211 billion of that will show up as depreciation on 2026 income statements. The rest, more than half a trillion dollars, sits on the balance sheet as a long-lived asset and gets expensed over the years ahead. That timing gap is why earnings can grow more than 20 percent while the cash going out the door explodes higher. The capex is REAL.

There is nothing improper about any of this. It is how companies book capital assets, and it always works this way. What is different this cycle is the sheer scale of the spending and the speed at which the deferred bill will land. As Todd Castagno at Morgan Stanley put it, this is “a golden window where everybody looks good.” The window does not stay open forever.
Free Cash Flow Is Draining, Not Disappearing
Here is where investors get the story half right. Depreciation is a non-cash charge. It lowers reported earnings, but it does not touch the cash a business actually generates from operations. So when you watch a hyperscaler’s free cash flow collapse, you are mostly watching capital spending outrun everything else, not a business falling apart.
Amazon is the clearest example. Its trailing free cash flow fell to $1.2 billion from $25.9 billion a year earlier. That looks alarming until you remember why. The company is pouring roughly $200 billion into data centers, chips, and power. Cash leaves today, and the asset it buys is designed to produce revenue for years.

The mistake is treating compressed free cash flow as automatic evidence of waste. Falling FCF is far more defensible when it funds reinvestment than when it funds buybacks. Betting on permanent cash-flow impairment is a bet against the best capital allocators of the past two decades.
Negative free cash flow tells you a company is spending. It does not tell you whether the spending is smart. That answer shows up later, in the revenue the assets produce.
The honest caveat is that a GPU is not a railroad. If the useful life of these assets turns out shorter than management assumes, the depreciation bill arrives faster, and the payback window compresses. That is the real debate, and it deserves to be settled company by company rather than with a single scary headline.
Four Companies, Four Different Bills
Four of the biggest AI spenders report next week, and they sit in very different places on this map. Microsoft reports on Wednesday with consensus at $4.22. It is spending heavily, roughly $190 billion in calendar 2026, and the strain already shows. Free cash flow fell to $15.8 billion last quarter on $31.9 billion of capex, down from $25.7 billion two quarters earlier. The number that justifies the bill is Azure, which management guided to 39%-40% growth. Hold that line, and the spend looks bought. Miss it, and the cash-flow math gets uncomfortable in a hurry.
Amazon reports Thursday with consensus at $1.82. Its story is the same shape, only larger. The roughly $200 billion capex plan drove trailing free cash flow down to that $1.2 billion figure. But AWS reaccelerated to 28% growth last quarter, its fastest in over three years, with a backlog north of $360 billion, and is the entire tell. If cloud growth holds, the buildout is converting. If it stalls, the market will ask much harder questions about the check Amazon wrote. It did exactly that when the stock fell 8% after the spending plan was first announced.
Meta also reports on Wednesday, with a consensus at $7.23, and it is the odd one out. Meta is pouring a comparable fortune into AI, with 2026 capex guidance just raised to $125 billion to $145 billion, yet it has no cloud division to sell that capacity to (which is why we don’t own it).
For Meta, the payback has to show up inside its own business, in sharper ad targeting and deeper engagement, with Reality Labs and the new Meta Compute effort as longer-dated options. That makes Meta the purest test of the four. Its operating margin has already slipped from the peak as spending ramps up, and free cash flow could turn negative if capex keeps climbing. Watch whether AI is visibly lifting ad revenue. If it is, the spend defends itself. If not, Meta has the least coverage in the group.
Apple is the counterexample, and that is exactly why it belongs here. It reports Thursday with a consensus at $1.89, and it is barely part of this story. Apple’s capital spending is a fraction of its cash generation, and it still throws off enormous free cash flow every quarter. Its risks live somewhere else entirely, in the iPhone upgrade cycle, Services growth, China, and the perception that it has fallen behind on AI. This is also Tim Cook’s final earnings call before John Ternus takes over, which adds a layer of narrative that the numbers will not capture. Apple is the reminder that not every megacap is running the same capex gauntlet, a point we made in Mag 7 Stocks: Risk Or Opportunity.

The Market Is Treating The AI Capex As Dead Money
Watch how the tape reacted this month, and you’d think the AI buildout had already failed. Alphabet beat on revenue, grew Google Cloud 82%, and still fell about 5% after hours because it raised capital spending again. As I posted on Thursday:

Amazon got the same treatment earlier this year. The market is pricing the bill and ignoring the asset. That is usually where opportunity hides.
Be honest about the near-term risk first. Valuations are not cheap. The broad market still trades well above its long-term average multiple, and the megacaps carry a premium on top of that. Free cash flow is under real pressure, and Alphabet just posted negative free cash flow of $5.9 billion and paused buybacks to fund the buildout. Capex guidance keeps getting revised higher, not lower, which means the deferred depreciation bill I described earlier is still growing. Add a tape below its 50-day average and the worst three-month stretch of the calendar dead ahead. More downside over the next quarter or two would not surprise me.

The AI Capex depreciation risk is great for bearish headlines, clicks, and views. However, it misses a critical point. Negative free cash for a company that is losing market share, has declining revenue growth, and is unprofitable is a clear investment risk.
However, that is not the story of the hyperscalers. The revenue that justifies all this spending is accelerating, not fading. As noted, Google Cloud grew 82%, Azure is running near 40%, and AWS reaccelerated to 28%. The committed backlogs behind them are enormous, at $514 billion for Google, north of $600 billion for Microsoft, and more than $360 billion for Amazon. Those are not the numbers of a dying business. They are the numbers of businesses that cannot build capacity fast enough to meet demand.
This is where Howard Marks and his second-level thinking earn their keep. The easy call is to sell what just went down. The harder and usually more profitable call is to buy durable franchises when the crowd has decided the story is over. The hyperscalers are not dead. They are expensive, early in the payback, and briefly out of favor, which is a very different thing. We’d use this weakness to build positions in the names where cloud growth and backlog clearly justify the spend. And we’d do it in pieces rather than all at once.
What Should Investors Do Now
None of this argues for abandoning the AI trade. It argues for pricing it honestly. The businesses are real, the revenue is growing, and the best operators have earned some benefit of the doubt. But valuations already assume the capex converts cleanly, and next week, four companies have to show their work. Here is how we are approaching it.

A number that looks frightening in isolation can be rational once you see the asset it bought and the revenue it is producing. The bill for the AI buildout is coming due. Next week, we will start to find out who can pay for it.
Trade accordingly.
🖊️ From Lance’s Desk
This week’s #MacroView blog is the prequel to today’s newsletter, which discusses the AI Capex risk to record earnings when the future depreciation begins to eat into bottom-line earnings per share.

Also Posted This Week:
- Can SpaceX Fire On All Cylinders? – RIA – by Michael Lebowitz
- Why Retail Traders Consistently Underperform Over Time – RIA – by Lance Roberts
📹 Watch & Listen
Climbing Oil prices continue on a momentum buy signal as crude approaches key resistance near the 100-day moving average. A stronger U.S. dollar is rising alongside oil, while gold remains under pressure as global demand for dollars increases. Despite geopolitical tensions and higher energy prices, market volatility remains surprisingly subdued.
Subscribe To Our YouTube Channel To Get Notified Of All Our Videos
📊 Market Statistics & Analysis
Weekly technical overview across key sectors, risk indicators, and market internals

💸 Market & Sector X-Ray: Market Gains Ground
The market slid this past week, falling below the 50-DMA. However, it was the function of primarily the decline in Discretionary, Technoloogy and Communications. With those sectors oversold, and Energy, Industrials, Real Estate and Utilities overbought, a rotation between those sectors seems increasingly likely.

📐 Technical Composite: 77.09 – Still Bullish But Easing
The technical condition eased last week as semiconductors and momentum names came under pressure. With the selloff last week, the techical conditions fell 12 points. While the market is no longer overbought, it is also not oversold either.
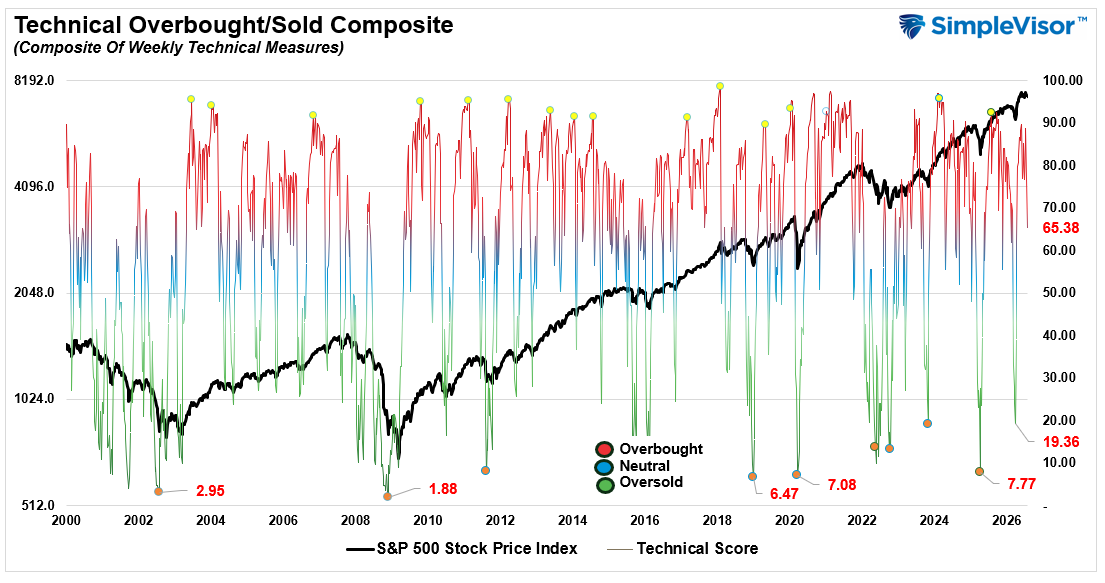
🤑 Fear/Greed Index: 69.05 – A Reversion From Extreme Greed
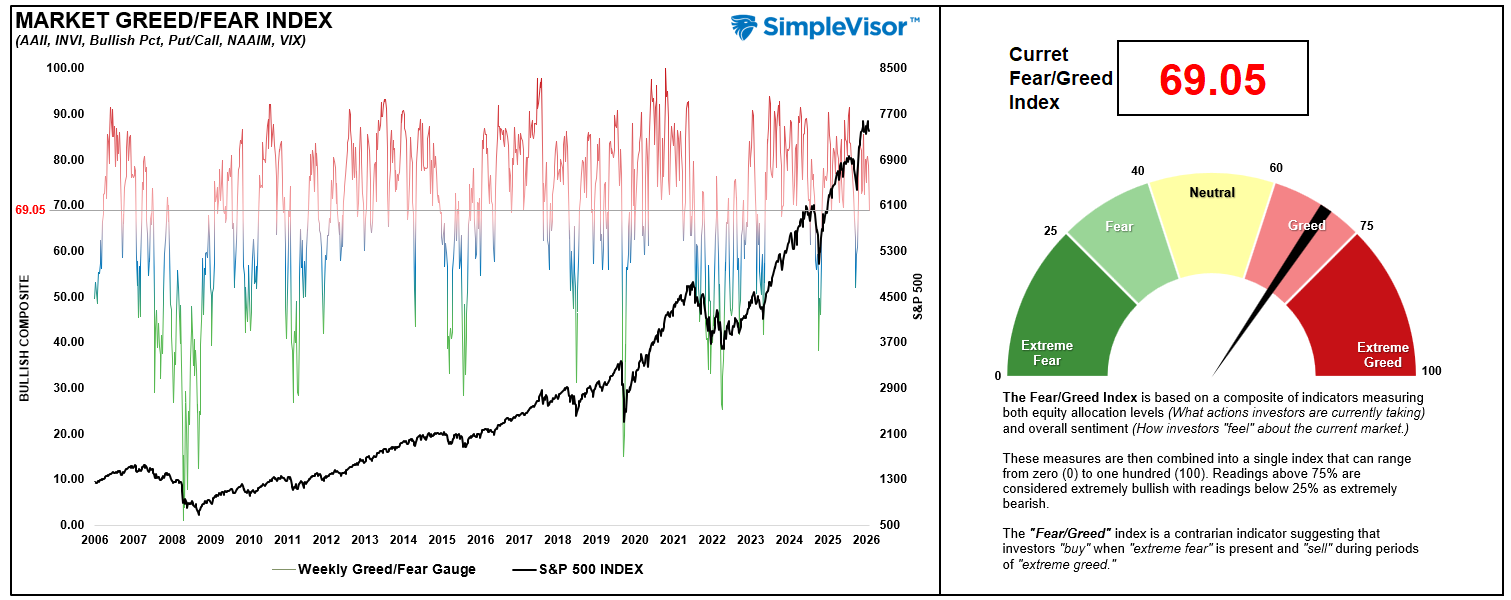
The pick up in volatility and sell off into the end of last week has finally started weighing on investor positioning which fell 10-points from last week’s reading. We are not washed out yet, and with the market below the 50–DMA there is more downside risk near term.
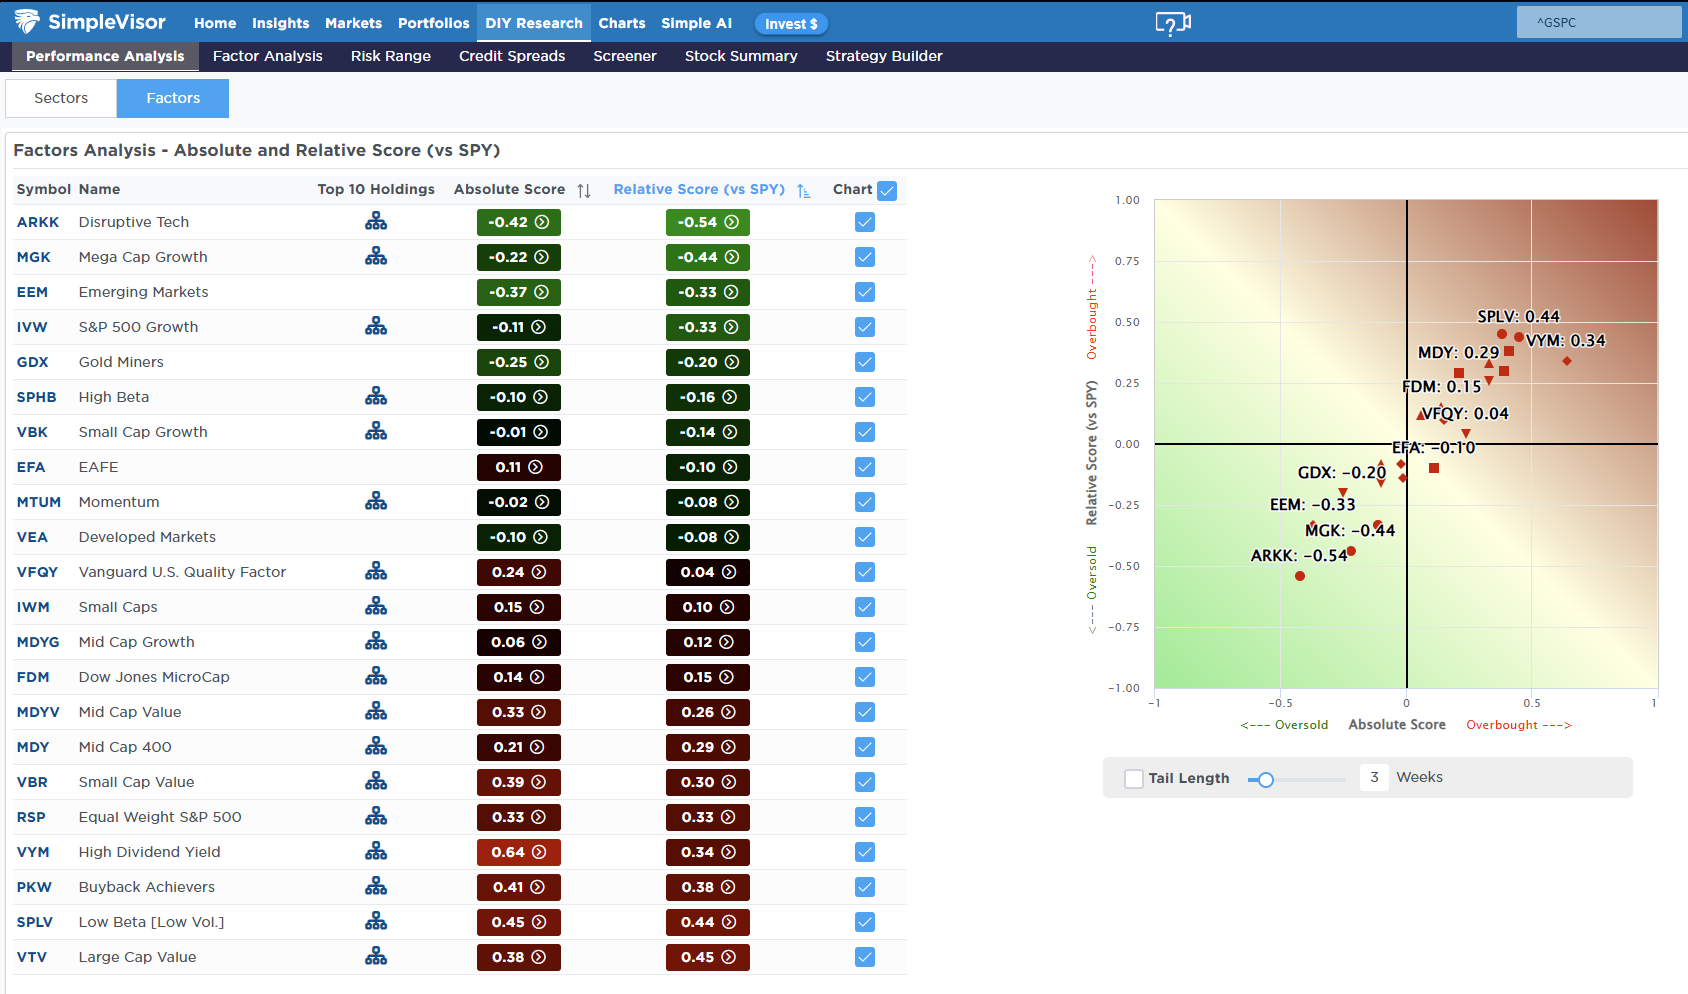
🔁 Relative Factor Performance
We noted two weeks ago that “compression of factors has been evident…that clustering will shake itself out sooner than later, and the opportunity will be in which factors start to take the lead.” With the Megacaps on deck to report this week, and given their more deeply oversold condition, the bar has been lowered significantly. A rotation from Low Beta and Value to growth is becoming more likely over the next couple of months.
📊 MFBR Index (Money Flow/Breadth Ratio Indicator)
NEW! MFBR Index: The Money Flow Breadth Ratio (MFBR) model is a rules-based equity allocation framework that uses weekly S&P 500 money flow data to generate buy, sell, and neutral signals. The MFBR systematically adjusts portfolio equity exposure in response to the direction and persistence of institutional capital flows. It aims to reduce drawdowns while capturing the majority of market upside.
“As of July 24, 2026, with the S&P 500 at 7,411.98, the Money Flow Breadth Ratio (MFBR) stands at 65% and rising. This places the indicator in BUY territory (60-70%), triggering a BUY signal. The prior week reading was 65%, representing a 5% decline over the trailing four weeks.
The model currently recommends HOLDING exposure at 92%, a level that has remained since July 10, 2026 (2 weeks). This reflects a FLOW-OVERLAY OVERRIDE: the trailing 4-week net dollar flow has swung sharply positive (>$300B) after a deeply negative prior 4 weeks, a historically strong contrarian buy signal.”

📊 Sector Model & Risk Ranges
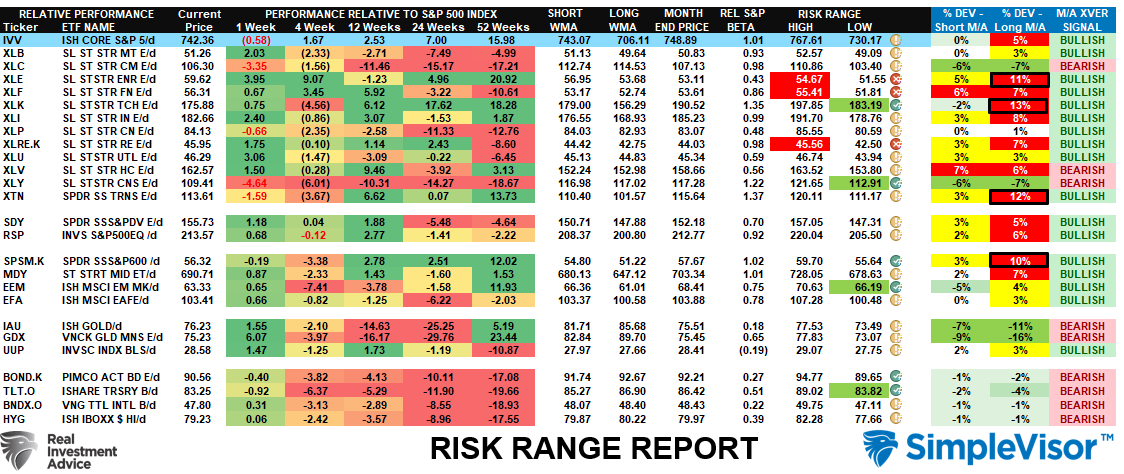
The market consolidation over the last month has slowly started reducing the more extreme deviations in some sectors and markets, specifically Energy, Financials and Small Caps. Take profits in these areas and rebalance to target weights. Conversely, Technology, Discretionary, Emerging Markets, and Bonds are all trading well below normal ranges and may catch rotationary flows.
Have a great week.
Lance Roberts, CIO, RIA Advisors