With politicians squabbling over lifting the “debt limit,” few are paying attention to the ongoing “Japanification” of the U.S. economy. What do I mean by “Japanification?” With a zero to negative debt multiplier on economic growth, the ongoing spending spree by the Government continues to push the U.S. to the same slow growth economy as in Japan.
We previously discussed the CBO’s (Congressional Budget Office) long-term debt projection through 2050 compared to the historical exponential growth trend of the debt. Such suggests that the CBO’s projections, as always, are well short of reality. As we will discuss, such ensures poor economic returns.
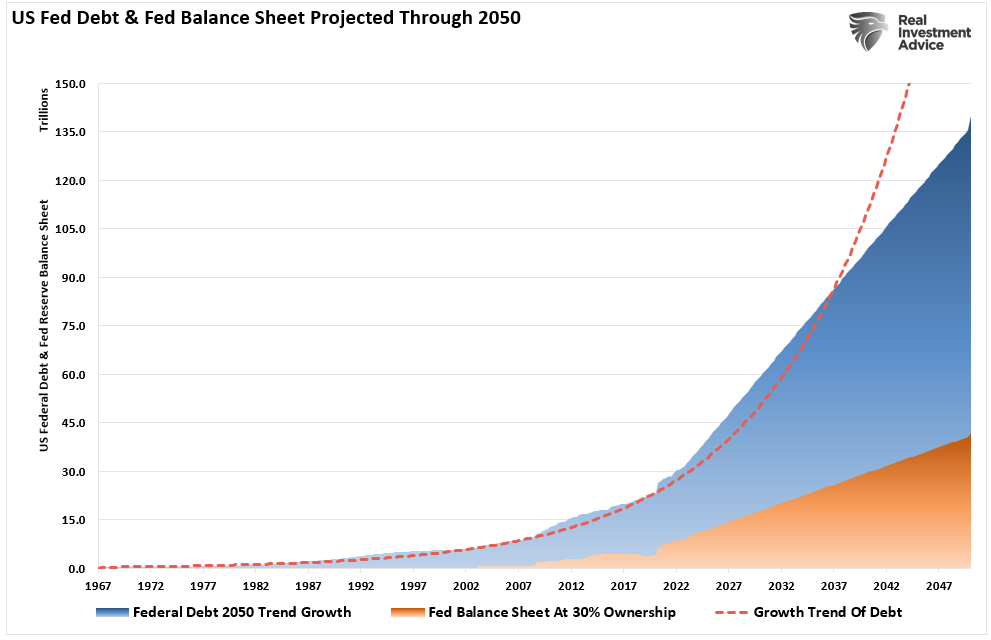
At the current growth rate, the Federal debt load will climb from $31 trillion to roughly $140 trillion by 2050. Concurrently, assuming the Fed continues monetizing 30% of debt issuance, its balance sheet will have to swell to more than $40 trillion.
Let that sink in for a minute.
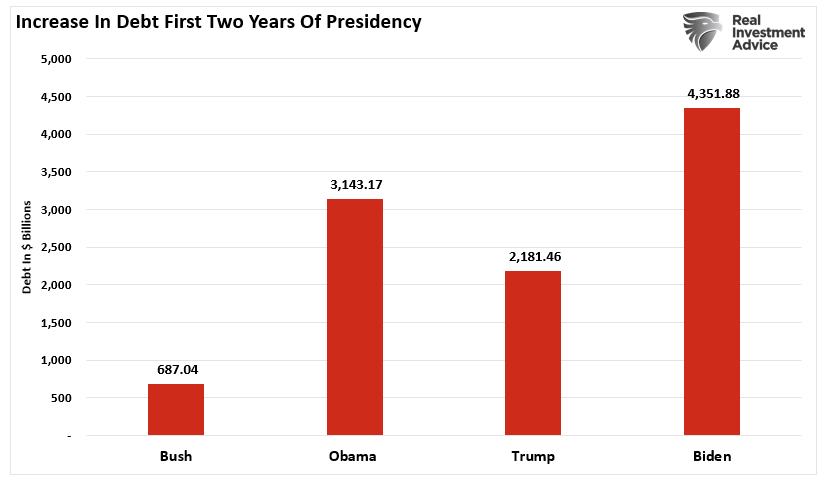
This also is not a partisan issue. Since the turn of the century, every President and Congress has spent with unbridled enthusiasm. Since President Biden has only been in office for two years, the chart shows the total debt increase in the first two years of each Presidency.
As noted, debt does not create economic growth.
More Debt = Less Growth.
What should not surprise you is that non-productive debt does not create economic growth.
Since 1977, the 10-year average GDP growth rate has steadily declined as debt increased. Using the historical growth trend of GDP, the increase in debt will lead to slower economic growth rates. The brief bump in economic growth following the injection of fiscal stimulus into the economy will be only temporary.

Given the historical correlation of debt to GDP growth, such suggest future outcomes will be no different.

Dollars Of Growth
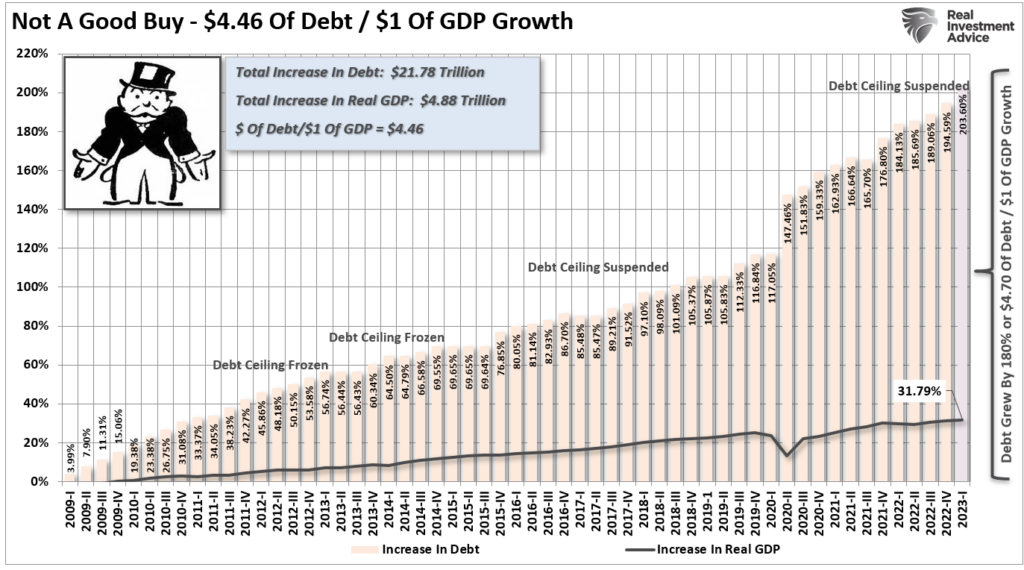
We can view this differently by looking at the dollars of debt required to create a dollar of economic growth. Since 1980, the increase in debt currently usurps the entirety of economic growth. The growth in debt diverts tax dollars away from productive investments into debt service and social welfare.
The chart below shows the debt growth trajectory since the financial crisis compared to the economy’s growth. It is hard to suggest that almost $4.50 of debt to create $1 of economic growth is sustainable long-term. It furthermore highlights the fallacy that more debt creates economic growth.
Another way to view this is to look at what “debt-free” economic growth would be. In other words, without debt, there has been no organic economic growth.

The economic deficit has never been more significant. From 1952 to 1982, the economic surplus fostered an economic growth rate averaging roughly 8% during that period. Today that is no longer the case, as the debt detracts from growth. Such is why the Federal Reserve has found itself in a “liquidity trap.”
Interest rates MUST remain low, and debt MUST grow faster than the economy, just to keep the economy from stalling out.
A Negative Multiplier
Notably, excess “debt” has a zero to a negative multiplier effect. Such was shown in a study by the Mercatus Center at George Mason University by economists Jones and De Rugy.
“The multiplier looks at the return in economic output when the government spends a dollar. If the multiplier is above one, it means that government spending draws in the private sector and generates more private consumer spending, private investment, and exports to foreign countries. If the multiplier is below one, the government spending crowds out the private sector, hence reducing it all.
The evidence suggests that government purchases probably reduce the size of the private sector as they increase the size of the government sector. On net, incomes grow, but privately produced incomes shrink.”
Personal consumption expenditures and business investments are vital inputs into the economic equation. As such, we should not ignore the reduction of privately produced incomes. Furthermore, according to the best available evidence, the study found:
“There are no realistic scenarios where the short-term benefit of stimulus is so large that the government spending pays for itself. In fact, the positive impact is small, and much smaller than economic textbooks suggest.”
Politicians spend money on political ideologies rather than sound economic policy. Therefore, the findings should not surprise you. The conclusion of the study is most telling.
“If you think that the Federal Reserve’s current monetary policy is reasonably competent, then you actually shouldn’t expect the fiscal boost from all that spending to be large. In fact, it could be close to zero.
This is, of course, all before taking future taxes into account. When economists like Robert Barro and Charles Redlick studied the multiplier, they found once you account for future taxes required to pay for the spending, the multiplier could be negative.”
As discussed recently, as that “fiscal pig” exits the “economic python,” there will be a large deficit to fill.
The remnants of the fiscal “pig” in the economic “python” is masking the effects of higher interest rates and more restrictive monetary accommodation. While the tighter monetary policy will eventually bite deeply into economic growth, there is an extended “lag effect” as excess liquidity provides a buffer. However, as shown, while increases in credit and the remnants of fiscal largesse continue to support spending, the reversion to historical norms is inevitable.
As the “pig” exits the “python,” the lag effect will catch up to stock prices that have vastly outgrown corporate revenue and economic growth.

This all suggests that we are looking at the “Japanification” of the U.S.

Following In Japan’s Footsteps
Years of low rates, economic growth, inflation, and ongoing monetary interventions have led to a massive surge in debt in the U.S. and globally. While many want to suggest “debt” isn’t a problem, we don’t have to go far to see what ultimately happens.
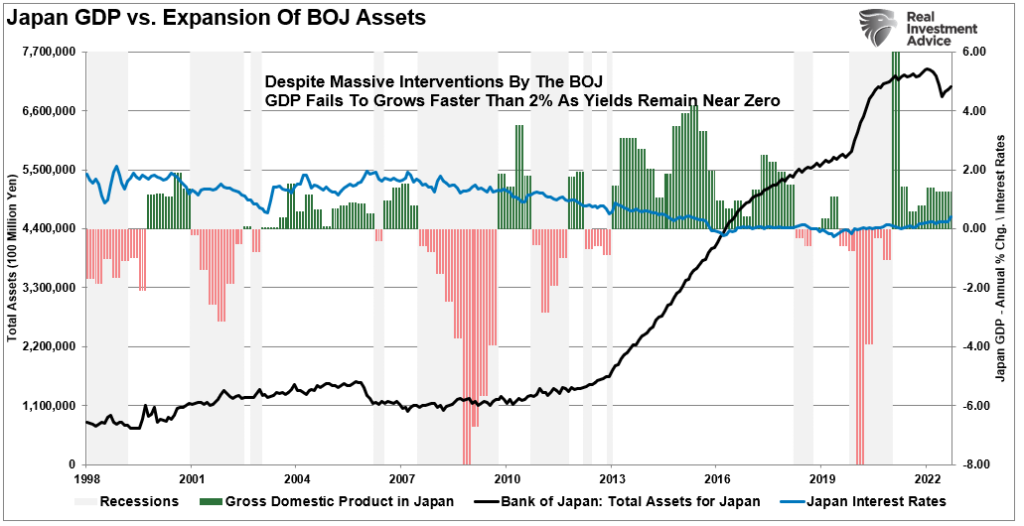
Since 2008, Japan has run a massive “quantitative easing” program. That program, on a relative basis, is 3-times more extensive than in the U.S. Not surprisingly, economic prosperity is no higher than before the turn of the century.
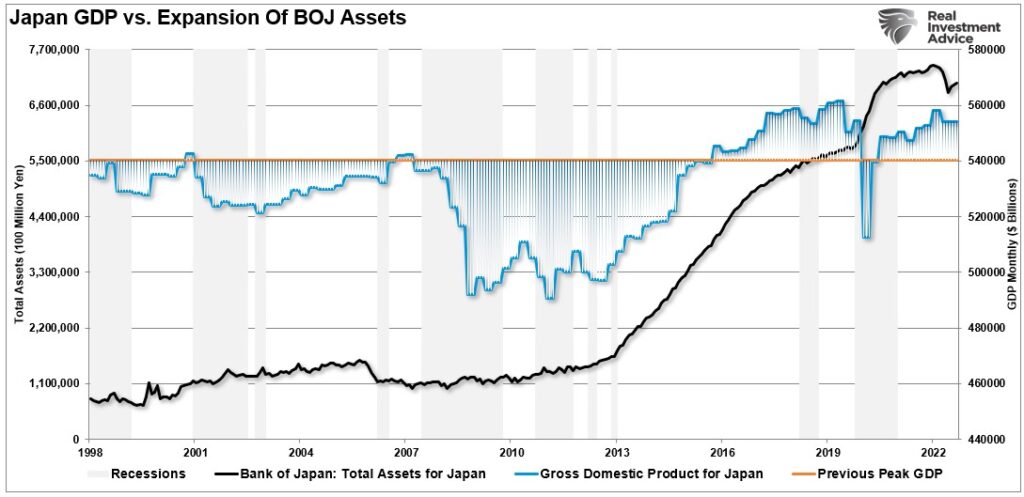
Furthermore, even though the BOJ’s balance sheet owns most of the ETF, corporate, and government debt markets, Japan has been plagued by rolling recessions, low inflation, and low-interest rates. (Japan’s 10-year Treasury rate fell into negative territory for the second time in recent years.)
While many argue the U.S. economy will eventually “grow” its way out of debt, there is no evidence such a capability exists. We know that interest rates in the U.S. and globally are telling us economic growth will remain weak in the future.
“The fact is that financial engineering does not help an economy, it probably hurts it. If it helped, after mega-doses of the stuff in every imaginable form, the Japanese economy would be humming. But the Japanese economy is doing the opposite. Japan tried to substitute monetary policy for sound fiscal and economic policy. And the result is terrible.” – Doug Kass
Japan is a microcosm of what the U.S. will face in coming years as the “3-D’s” of debt, deflation, and the inevitability of demographics continue to widen the wealth gap.
Japan has shown us that financial engineering doesn’t create prosperity, and over the medium to longer term, it has negative consequences.
Such is a crucial point.
What is missed by those promoting more debt is the underlying flawed logic of using debt to solve a debt problem.
At some point, you have to stop digging.

