
We recently read someone’s take that the graph below decisively points to the “bond market being under serious pressure.” The graph, courtesy of Bloomberg, shows that the yield on the ten-year US Treasury note is about 1% more than the earnings yield on the S&P 500. The S&P 500 earnings yield is calculated by dividing the S&P 500 earnings per share by its price. It gives us a yield that stock investors are “earning” based on the income generated by the underlying companies.
When looking at any graph comparing two instruments, as we have below, it’s always tempting to tell a story based on one of the two securities. For instance, the commentator we noted above thinks that bonds are in trouble because their yields are too high relative to equity valuations. While that is one side of the coin, it’s just as easy to tell the opposite story. In this case, might equity investors be paying too much for earnings? Would you buy a company that returns less via earnings than a risk-free bond?
If we assume the average premium for the S&P 500 earnings yield over the ten-year Treasury yield is 3%, then, given the current earnings yield, the Ten-year UST note should be yielding 0.50%. Obviously, with inflation near 3%, that is not realistic. Thus, maybe the question we should be asking is not whether bonds are under pressure but whether stocks are very overvalued. The truth probably lies somewhere in the middle. Bonds are under some pressure and cheap, while stocks are expensive.

What To Watch Today
Earnings

Economy

Market Trading Update
Yesterday, we reviewed the technical backdrop of the market. Given today’s introduction by Michael Lebowitz, I thought we could also review the technical backdrop for bonds and a potential trade setup that is developing.
The bond market just handed us something interesting. After the 30-year tagged 5% intraday last Monday and the 10-year ran to 4.39%, the long end has quietly rolled over. As I’m writing this morning, the 10-year sits at 4.38%, the 30-year is back at 4.95%, and the 2s/10s spread has steepened to roughly 48 basis points. The tape is telling us the rate-shock leg of this Iran-driven oil spike is losing momentum.
TLT closed Friday at $86.09 and is trading near $85.75 yesterday. The chart looks uglier than the price action suggests. The ETF is below both its 50-day moving average at $87.12 and its 200-day at $88.17, and those two averages are now stacked overhead as resistance. The 50 has rolled under the 200, so the death cross is in. That’s the bear case in two lines.
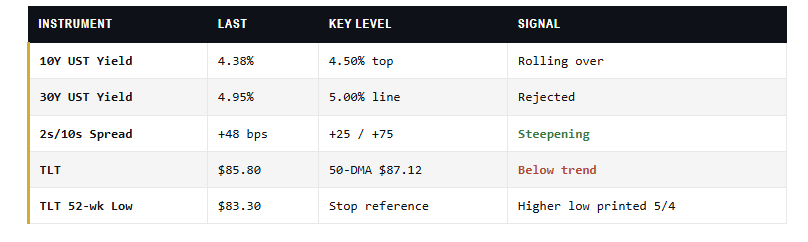
Here’s the problem with that bear case. TLT just printed a higher low on the May 4 pivot, well off the lows of $80.50. RSI is diverging positively against the April retest of that low. Speculator positioning shows a crowded short position above the recent bottom. Every ingredient for a counter-trend squeeze is sitting there.

This ties directly into the broader recovery scenario we’ve been mapping. The V-shaped bounce in equities off the February breakdown rests on one assumption. Oil rolls over, inflation expectations cool, and yields follow oil down the slope. That’s playing out in real time. Crude has cracked from triple digits, and the 30-year tagged a round number and rejected. Bonds are the second derivative of that trade.
The mechanics are straightforward. Long TLT around $85.80 against a stop just below $83.30, the 52-week low. First target is the 50-DMA near $87.10, where systematic shorts will likely reload. The second target is the 200-DMA at $88.20. A clean break of $88.20 opens the door to $90, and a full ceasefire confirmation puts $92 back on the table. That’s roughly $5 of upside against $2.50 of risk.
“Crowded short, higher low, positive RSI divergence, and a round-number rejection on the 30-year. The setup is finally giving us defined risk and asymmetric reward in the same chart.”
Tuesday’s April CPI print is the immediate catalyst, with consensus at 0.6% headline month-over-month. A soft number lights the fuse on the trade. A hot number forces a retest of $83, and we re-evaluate. Beyond CPI, Strait of Hormuz headlines remain the wild card, and any reacceleration in oil flips the entire thesis.
This isn’t a be-all-in-bonds analysis, but a decent trade setup seems to be forming.

Semiconductors Drive The Market Higher
The first graphic, courtesy of FinViz, shows percentage returns for the last five days and tells a pretty succinct story about which stocks are driving the market to record highs. Other than the top-left technology corner, large portions of the rest of the market are lagging. While many technology stocks are forging ahead, the chipmakers are clearly in the driver’s seat. Note that Micron (MU), Intel (INTC), and Advanced Micro Devices (AMD) were all up over 30% last week. Moreover, that is on top of spectacular gains over the last month.
In the wake of this very impressive run, every other sector is oversold relative to the S&P 500, with over half of the sectors having relative scores below -0.50, indicating very oversold conditions. XLK, a beneficiary of the chip stocks and others, has one of the highest relative and absolute scores we have ever witnessed, +0.93 and +0.90, respectively.
It’s likely a rotation from technology to other sectors is in the works. While timing such a rotation is tricky, we can prepare by asking ourselves which sector(s) will money flow to if it leaves the technology sector. Bear in mind that the money may flow within the technology sector, perhaps to the beaten-down software companies.


Parabolic Semiconductor Rally Is Pricing In 2028 Already
The parabolic semiconductor rally crossed a line this week. SOXX, the iShares Semiconductor ETF, closed Friday at $509.77 after touching a fresh intraday high of $511.68. That’s a gain of roughly 244% from the April 2025 low of $148.31. Most of that move has been compressed into the last two months alone. Since mid-March, SOXX has tacked on another 58%. The chart is now textbook parabolic. And parabolic charts almost never end politely.
If you wanted a real-time stress test of how fragile this move is, you got one this week. Semiconductors took a -2.86% hit on Thursday on softer Iran headlines, with Broadcom and Micron dragging. By Friday’s open, the dip was already being bought aggressively. A stronger-than-expected April jobs report (115,000 vs. 65,000 expected) and renewed peace-deal optimism sent the Nasdaq up 1.71% on the day, with SOXX printing a new intraday high before the close. That’s not a market digesting risk. That’s a market refusing to take “no” for an answer.
I’ve watched this movie before. After 30 years of cycles, the ending is rarely a surprise. The setup, however, is almost always sold as “this time is different.” It isn’t. In fact, every parabolic semiconductor rally in modern memory has ended the same way, and there’s no reason to expect a kinder math this round.

Tweet of the Day
“Want to achieve better long-term success in managing your portfolio? Here are our 15-trading rules for managing market risks.”
Please subscribe to the daily commentary to receive these updates every morning before the opening bell.
If you found this blog useful, please send it to someone else, share it on social media, or contact us to set up a meeting.

