
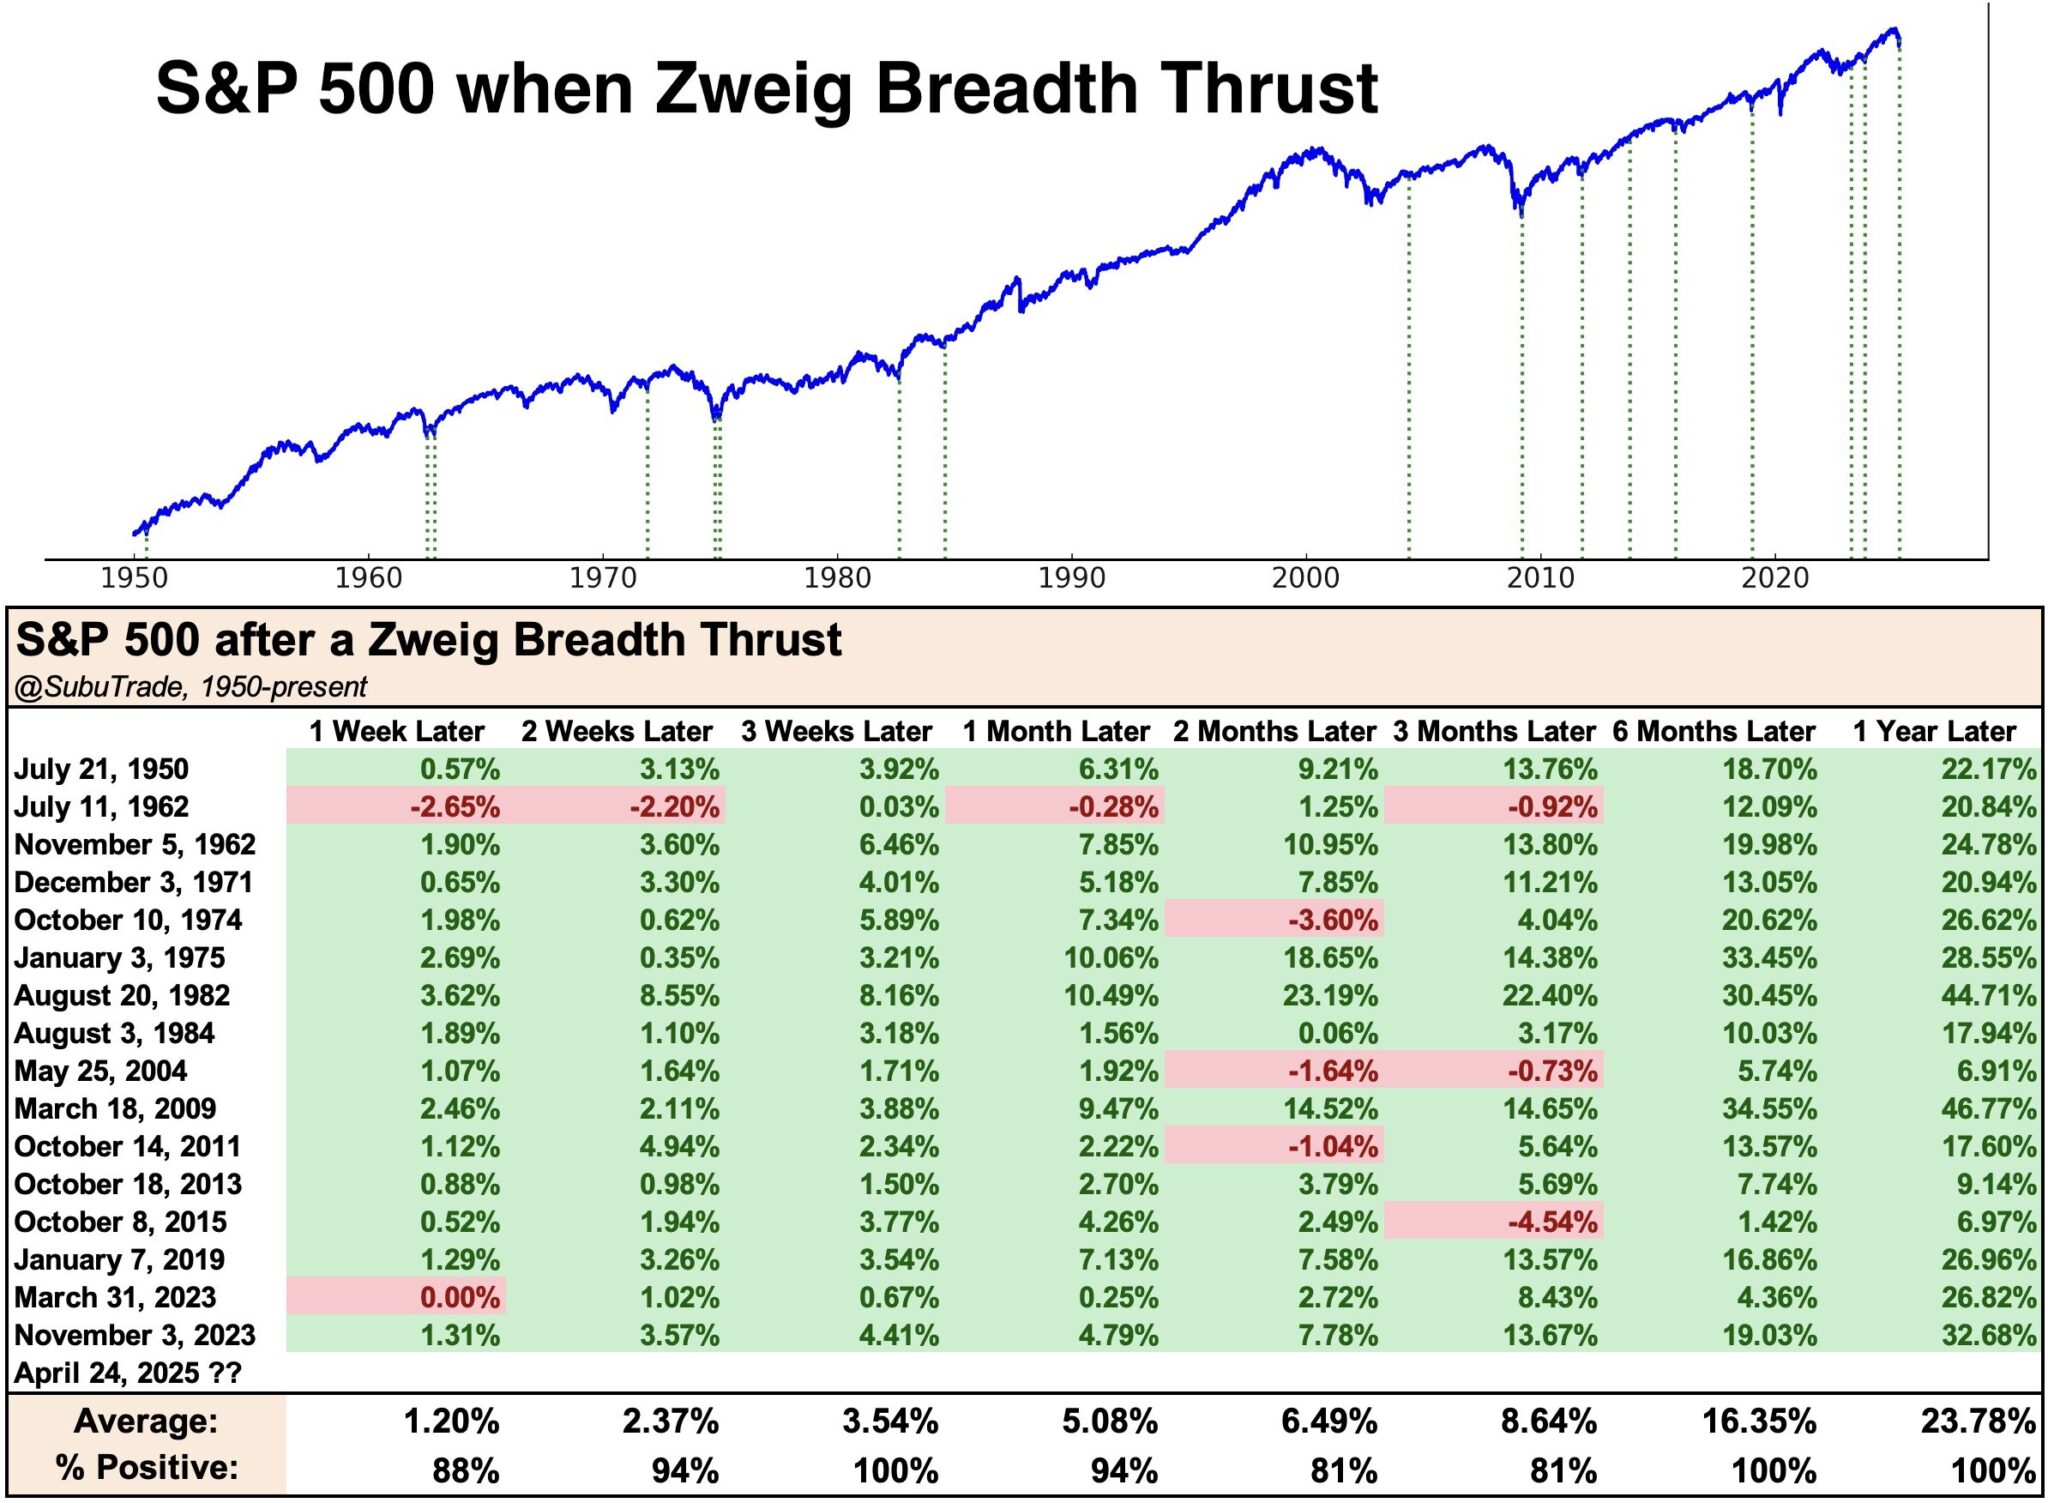
The Zweig Breadth Thrust, a rare technical indicator, triggered a bullish signal on Friday. The signal indicates rapid and significant changes in momentum. The calculation is based on the 10-day moving average of the percentage of stocks that were positive on a daily basis. The Zweig Breadth Thrust signal occurs when the moving average rises from below 40% to above 61.5% within 10 days. It is trying to capture the final capitulation in a downward trend.
A Zweig bullish thrust signal is rare. But it’s been a great predictor of positive forward returns when triggered, as shown below. Since 1950, the bullish indicator has only triggered 16 times, not including last Friday. The graph and table below show that in every instance the rare Zweig bullish thrust signal has occurred, it has consistently produced positive returns in the six-month and one-year periods. The shorter-term returns are positive in almost all cases. While this doesn’t guarantee the downward trend is over, it does provide optimism that those willing to hold through more volatility and potentially lower lows will ultimately be rewarded.
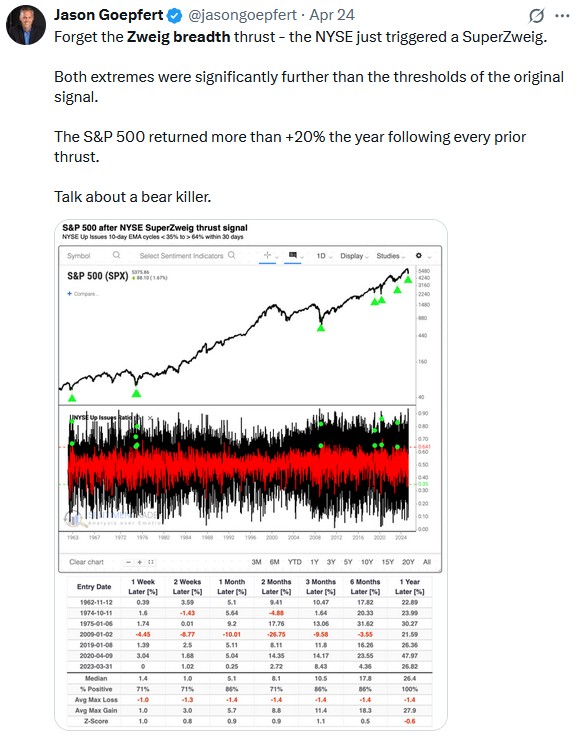
Check out the Tweet of the Day below. It shares Jason Goepfert’s analysis of triggering the even rarer Super Zweig. The Zweig Breadth Thrust and Jason’s Super Zweig show average one-year returns, post trigger, in the mid-20s percentage range.
What To Watch Today
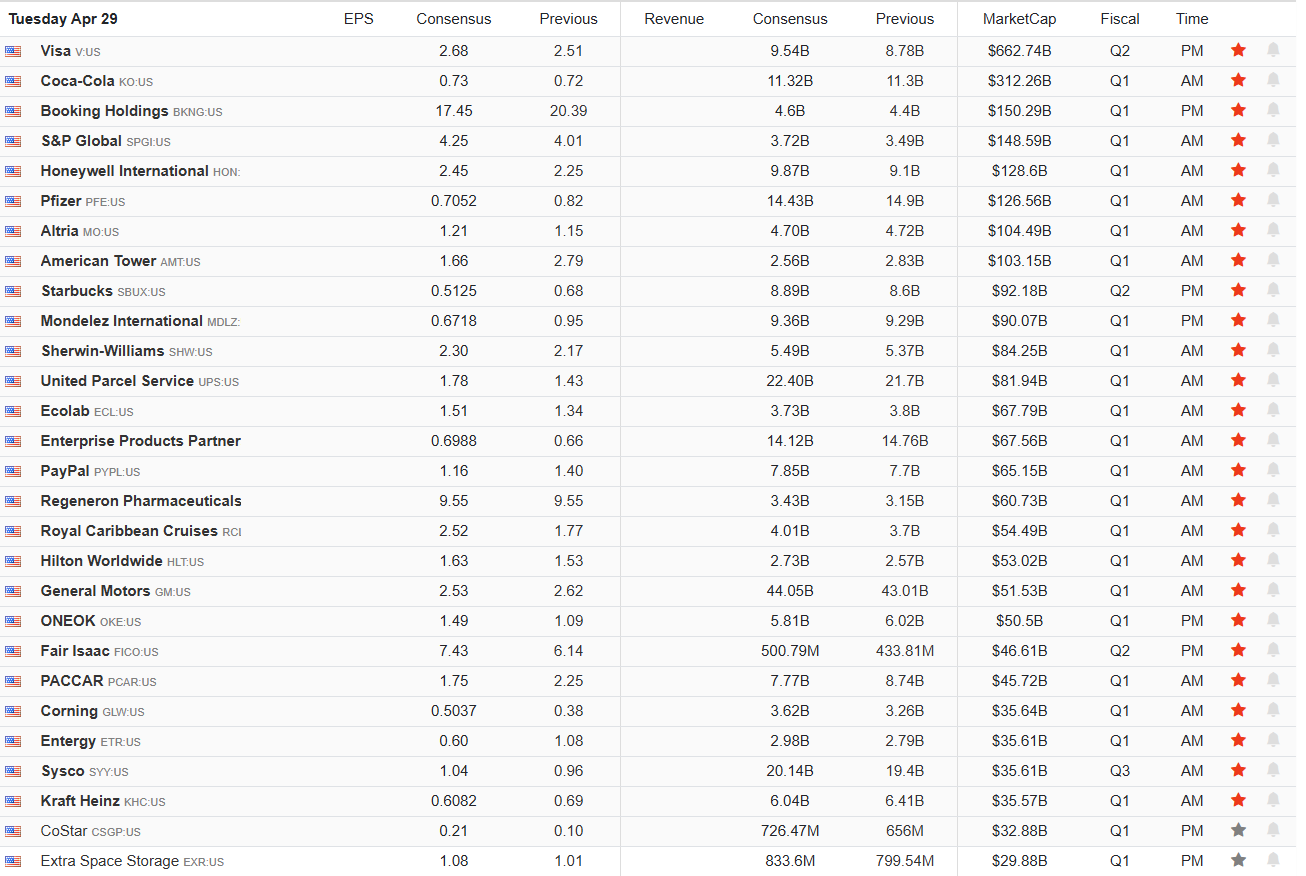
Earnings
Economy

Market Trading Update
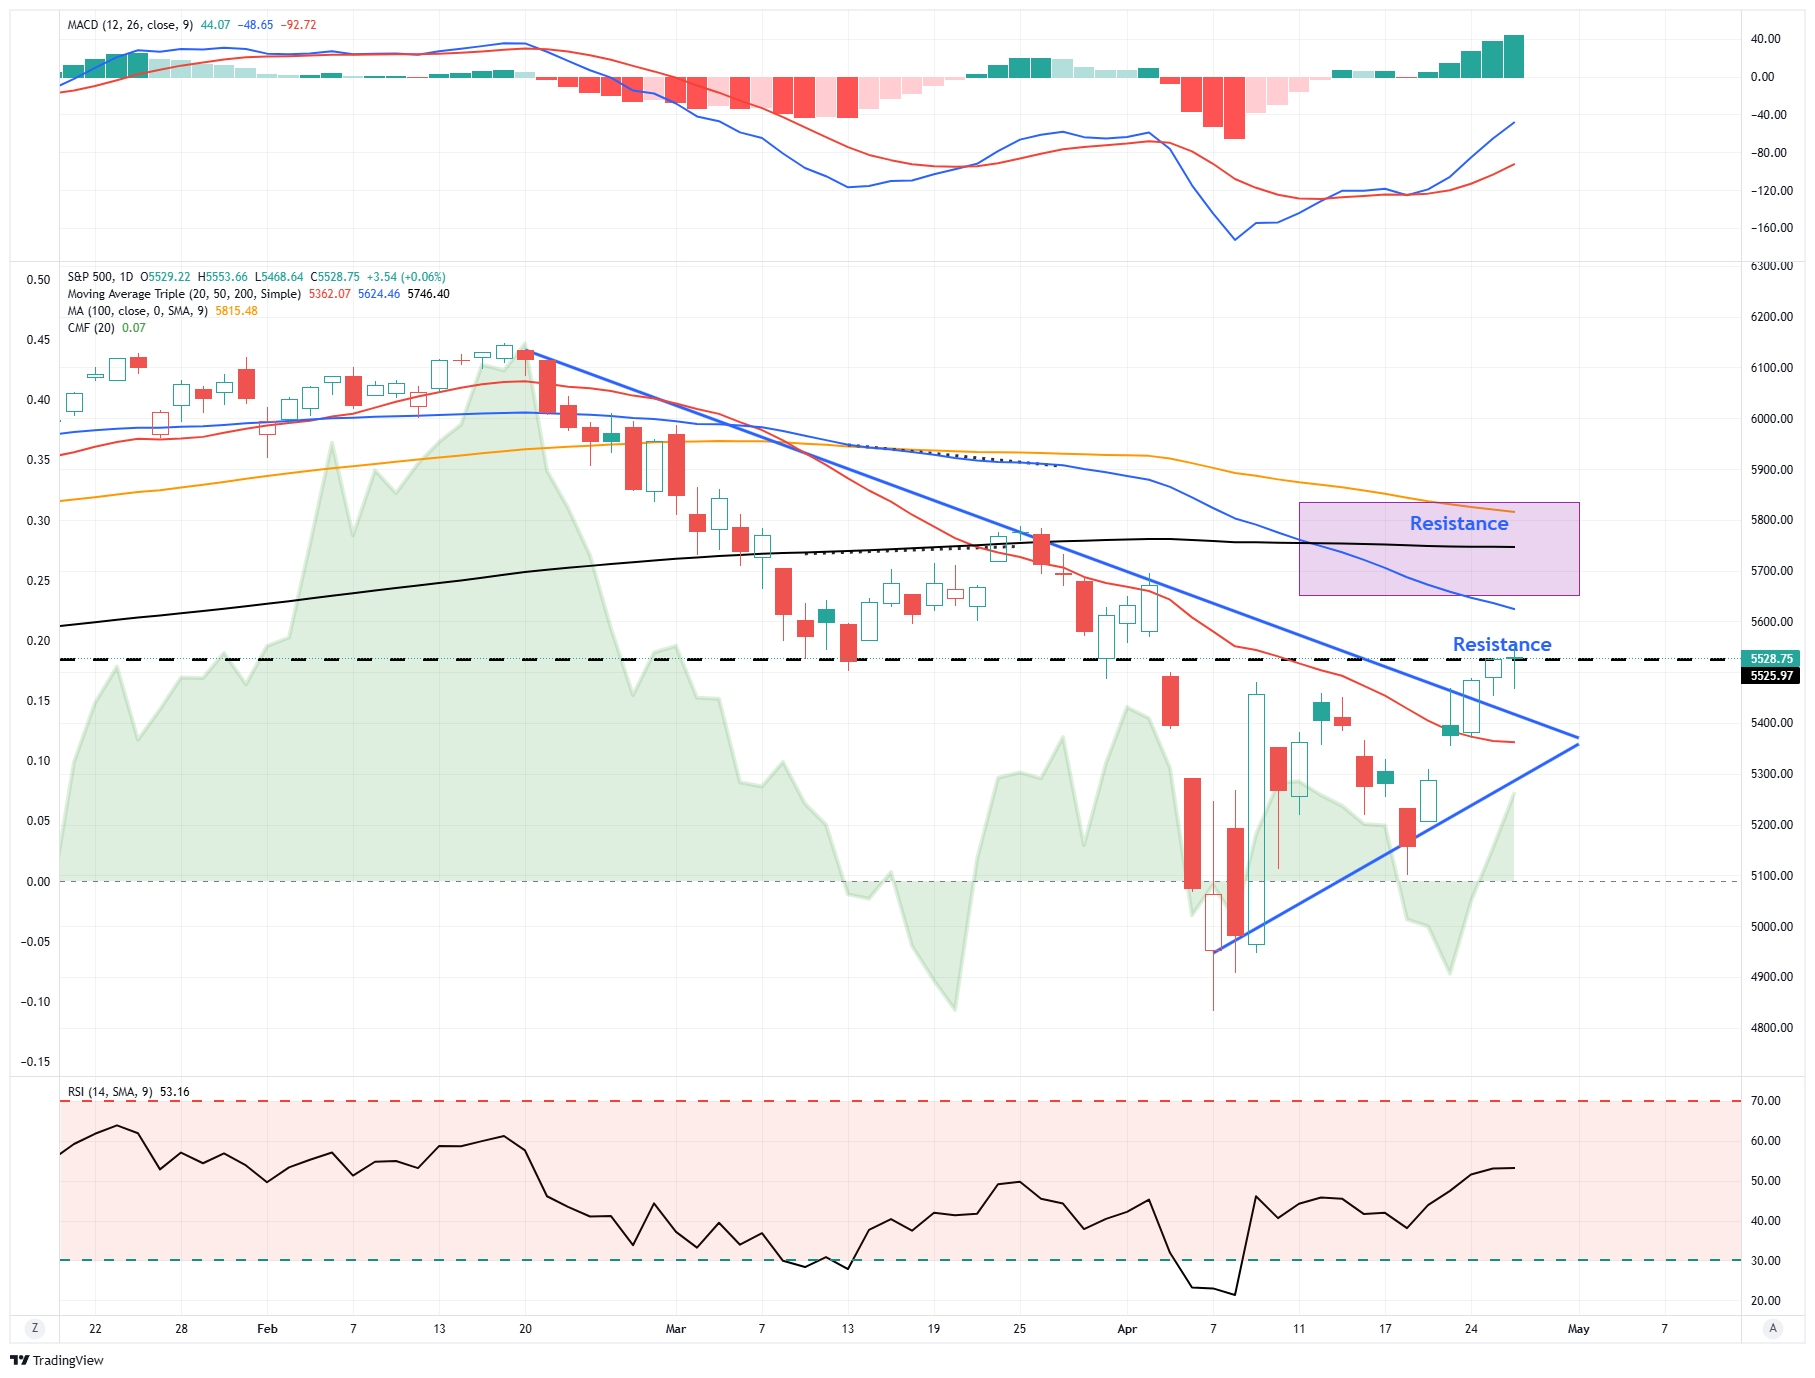
Yesterday, we discussed the recent breakout above the 20-DMA and the downtrend from the February peak. Last week, saw a strong rally from the recent lows, which put markets back into a short-term overbought condition. As Goldman Sachs noted:
“On April 3, the S&P 500 opened at 5462 (when we got our first look at the now (in)famous tariff board after the close on April 2. Four days later, on April 7th, the S&P 500 made its one-year low of 4835. On Friday, after four consecutive positive trading sessions (S&P 500 gained 735bps during this stretch), we closed at 5525.”

It should be unsurprising that after such a strong rally from the lows, and completely retracing the entire tariff decline, markets gave back a bit of the advance yesterday. What is crucial is that the recent breakout of the downtrend holds, without violating the rising trend line from the recent lows as shown. A violation of those levels would suggest a retest of recent lows. Such a decline would likely require either bad news on the tariff front or a collapse in economic data suggesting rising recession risks. Both are likely events at this juncture, and we must remain cautious.
This snippet from yesterday’s blog encapsulates our current concerns.
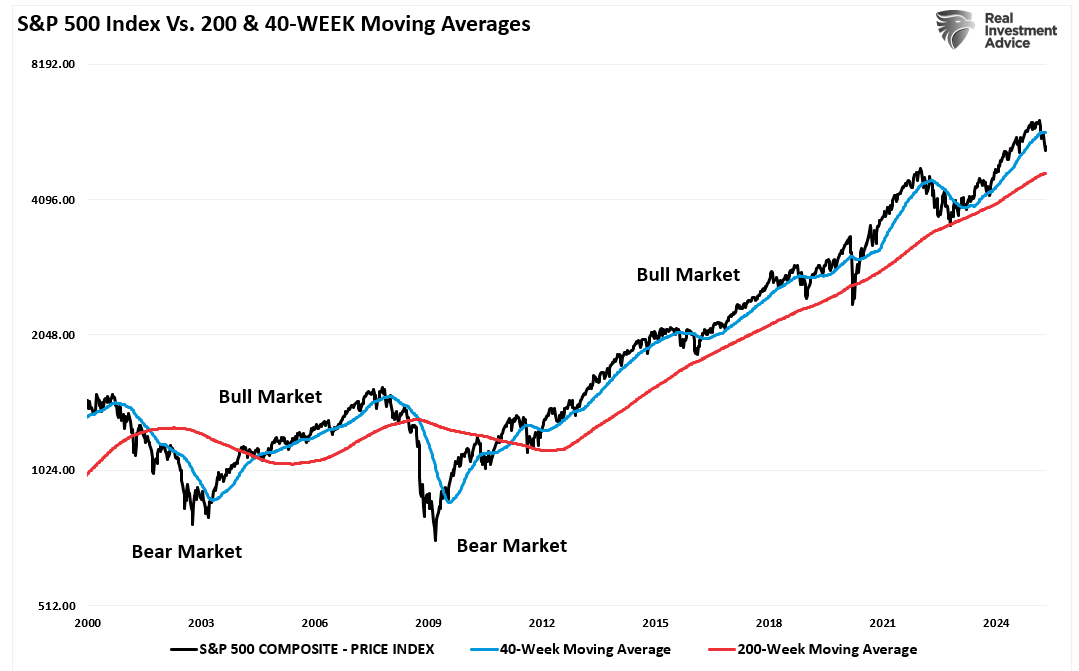
“As the current correction continues, the market has violated the 40-week moving average. This has only happened a handful of times since 2008, namely during:”
- The Euro crisis in 2012
- Brexit in 2015
- The Fed Taper Tantrum in 2018
- COVID in 2020
- Russia/Ukraine War in 2022
- And currently.
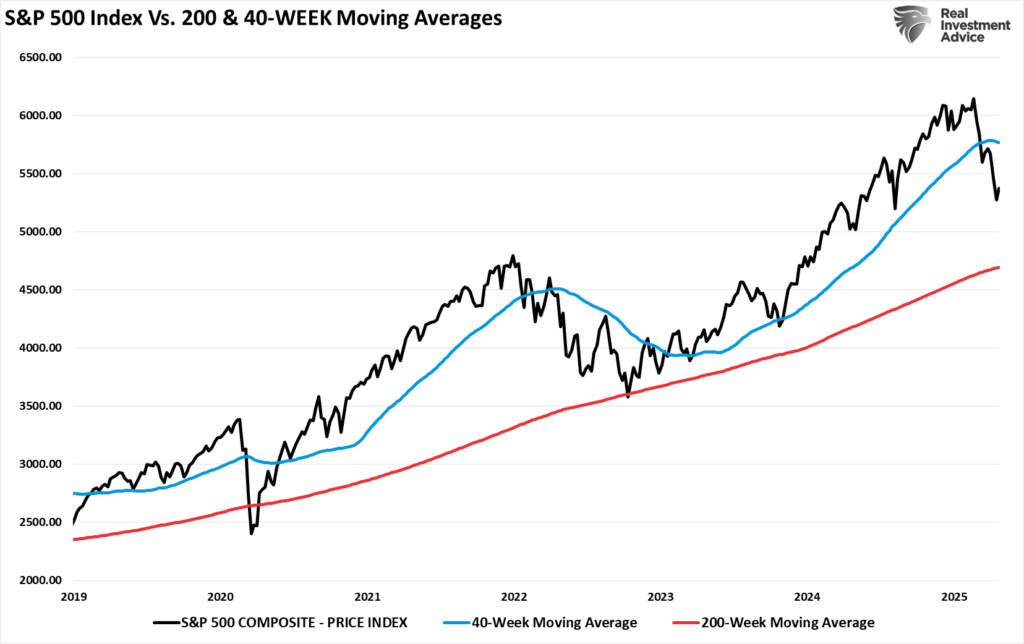
“Each one of those corrections ended without a confirmed violation below the 200-week moving average, but each lasted a few months before the bull market returned. As the correction continues, the violation of the 40-week moving average puts us in the position of needing reduced equity risk in portfolios until we begin to see more bullish price action take shape.”
Such is why we remain risk-averse for now and added to a short S&P 500 hedge last week.

Correction Continues- The Value Of Risk Management
Despite the recent rally, the correction continues. While wanting to “buy the dip” is tempting, there has been enough technical damage to warrant remaining cautious in the near term. As we have discussed, managing risk requires discipline and the emotional ability to navigate more volatile markets until a more straightforward path for risk-taking emerges. The problem with this statement is that it often immediately gets translated to mean “being entirely out of equities,” which is the act of “market timing.”
That is not what we mean by risk management. Repeated studies have evidenced that the problem with market timing is that individuals cannot successfully replicate the profitable timing of the buys and sells. However, individuals can increase and reduce exposure to risk during periods of higher volatility. This is because the most significant drawdowns tend to occur during periods of increased price volatility. As this correction continues, volatility remains relatively subdued. However, if the economy slips into a recession or some other event disrupts forward earnings expectations, there is undoubtedly a risk of a further increase.
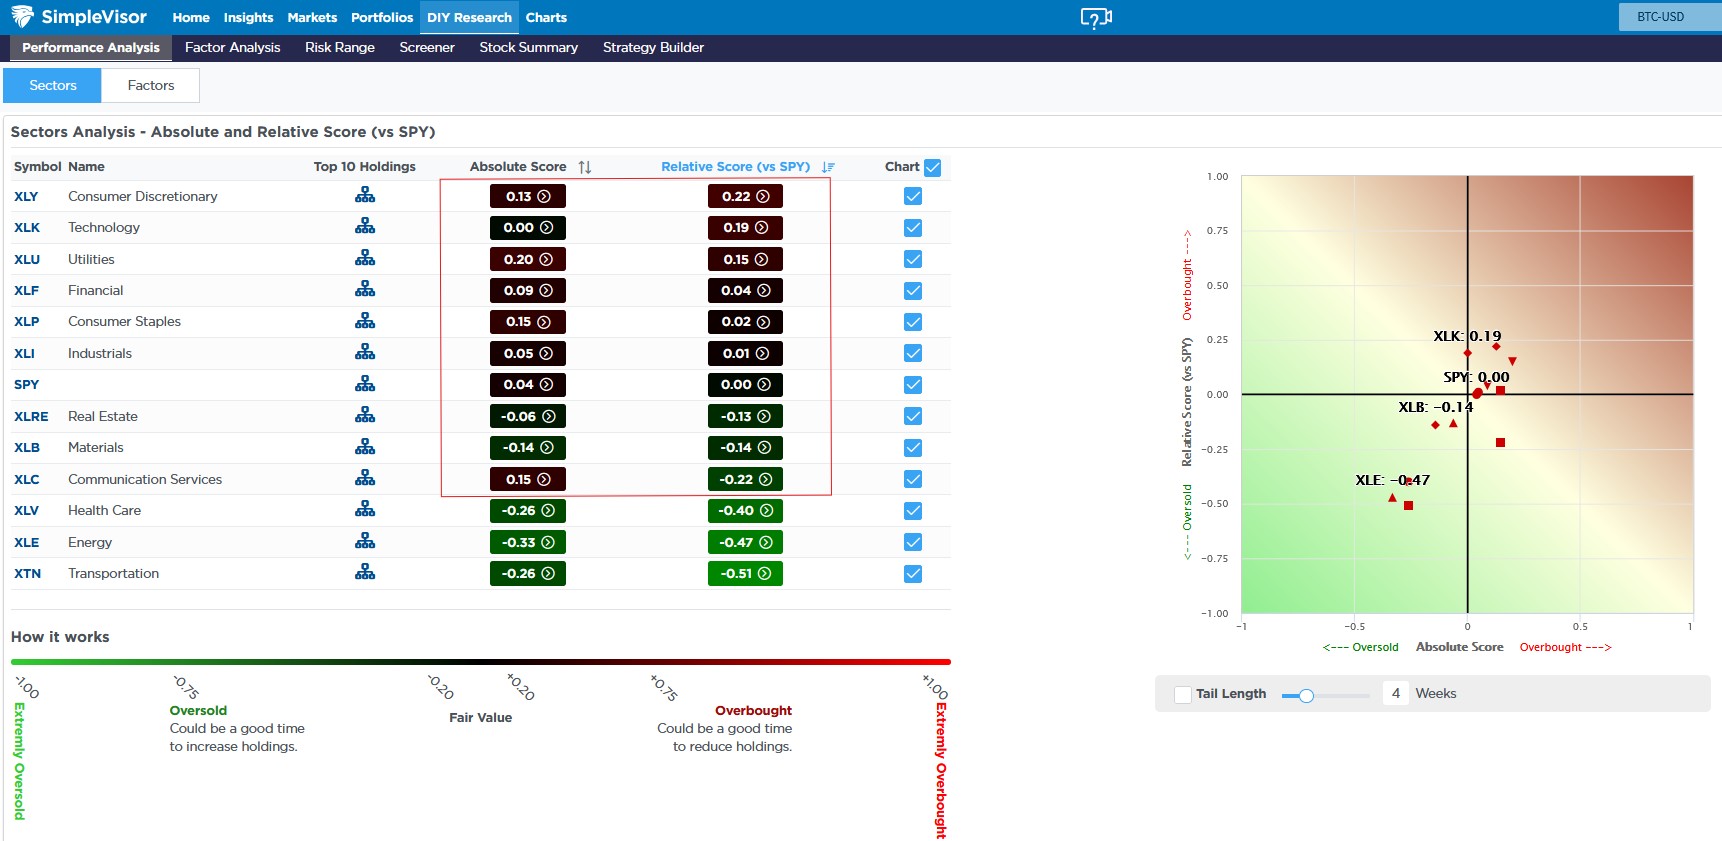
Market Breadth Normalizes
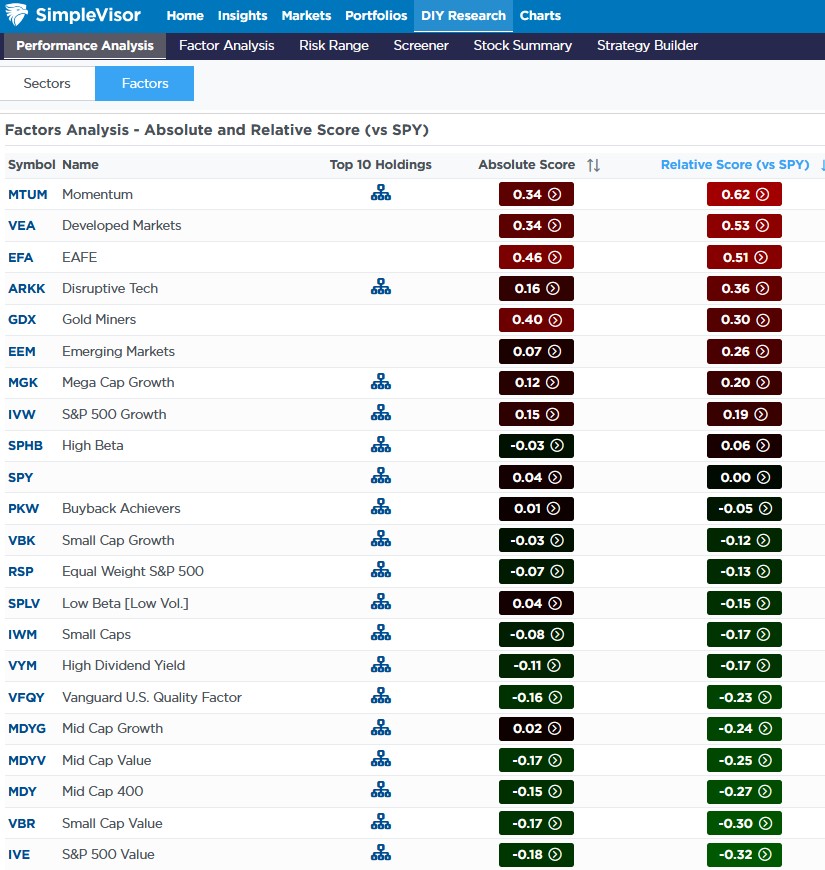
As we led, the Zweig Breadth gauge indicates the potential for resuming the bullish trend. The SimpleVisor graphic below also provides optimism that the recent market decline and significant volatility are ending. Whether this period is a rest bit before further downside pressure, or signals a healing process that will lead to eventual upside, is unclear. As we highlight with the red square, all but three sectors have absolute and relative scores near zero. This entails that most sectors are trading similarly to the market. The absolute scores indicate most sectors are no longer oversold and have room to the upside (become overbought), but they also have room to become oversold again. The second graphic showing factor scores tells a similar story, with many scores near zero.
Tweet of the Day
“Want to achieve better long-term success in managing your portfolio? Here are our 15-trading rules for managing market risks.”
Please subscribe to the daily commentary to receive these updates every morning before the opening bell.
If you found this blog useful, please send it to someone else, share it on social media, or contact us to set up a meeting.

