Inside This Week’s Bull Bear Report
- Rate Cut In July?
- How We Are Trading It
- Research Report – Q2 Earnings Season Begins With A Lowered Bar
- Youtube – Before The Bell
- Market Statistics
- Stock Screens
- Portfolio Trades This Week
Administrative Note
I am leaving for our annual family vacation early Friday morning. As such, this week’s missive will be a little shorter than usual, and our technical analysis will be as of the close of business on Wednesday. Next week’s newsletter will also be a brief update as we return home.
Thank you so much for your readership and your understanding. Have a great weekend.
Q2 Earnings Season Kick Off
Last week, we noted that we were about to enter Q2 earnings season.
“Speaking of earnings, analysts have been extremely busy over the last 30 days, slashing estimates. In June, Q2 earnings estimates for the S&P 500 index were cut by $5/share to the lowest level yet. Interestingly, while Wall Street continues to boast confidence in rising asset prices, they have cut estimates from $214/share in March last year to just $193/share. Such suggests a dichotomy between expected market performance and the economy, which is where earnings come from.”
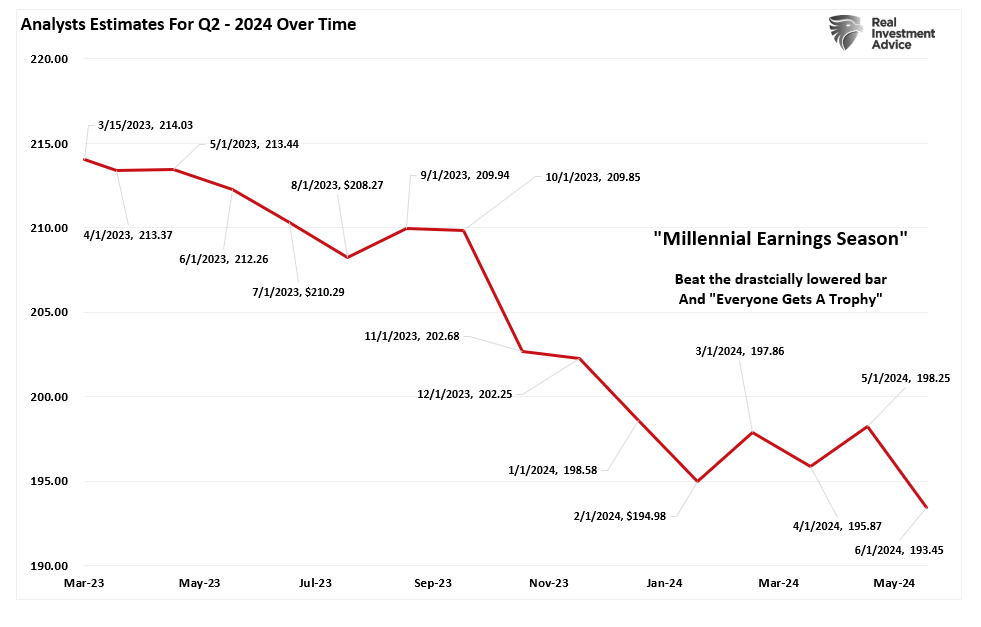
For a deeper discussion on Q2 earnings, read “Earnings Bar Lowered.”
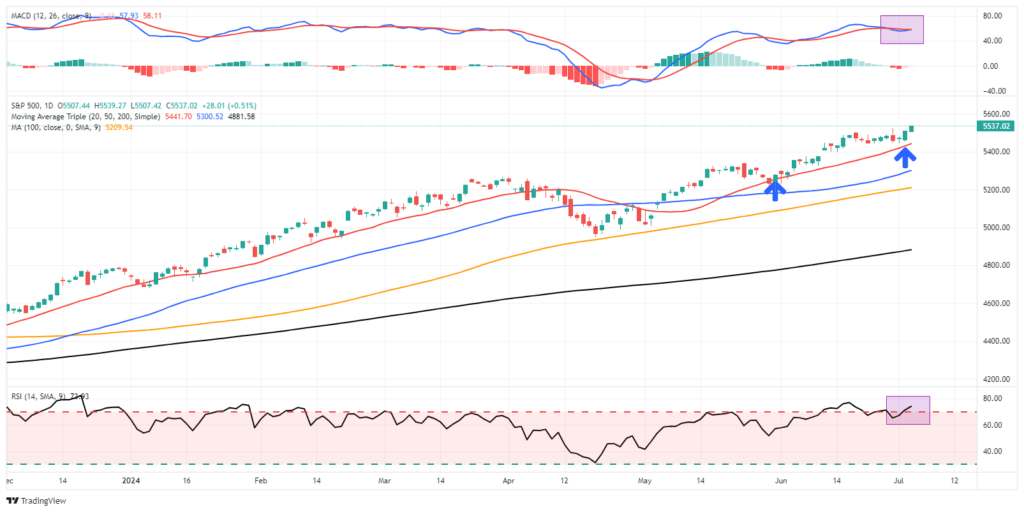
As noted, I am using Wednesday’s closing data for the current analysis before I head out for vacation. First, while markets hit an all-time high, I wouldn’t read much into it. Trading volume was light due to the shortening of the week for the Independence Day holiday week. Secondly, while the market did make a new high, it remains a marginal new high tracking along the 20-DMA, which continues to act as bullish support.
The market remains overbought short-term, but the recent rally is close to flipping the short-term MACD “sell signal.” Such would suggest that while the overbought condition could limit the upside, the market will likely try to climb higher over the next two weeks. Continue to manage portfolio risk accordingly, but the bullish trend remains intact.
As noted, investors remain very optimistic about the market currently. Net bullish sentiment remains elevated, volatility is suppressed, and “bad news remains good news” for now.

Of course, the current “A.I.” driven rally based on Fed rate cuts seems eerily familiar.
Need Help With Your Investing Strategy?
Are you looking for complete financial, insurance, and estate planning? Need a risk-managed portfolio management strategy to grow and protect your savings? Whatever your needs are, we are here to help.

Is 2024 Repeating 2023?
As noted above, the market continues its bullish trend from the October 2023 lows. Of course, that rally has been the byproduct of the chase for anything related to “artificial intelligence,” the chase for performance (buy the “Magnificent 7”), and ongoing hopes for Fed rate cuts.
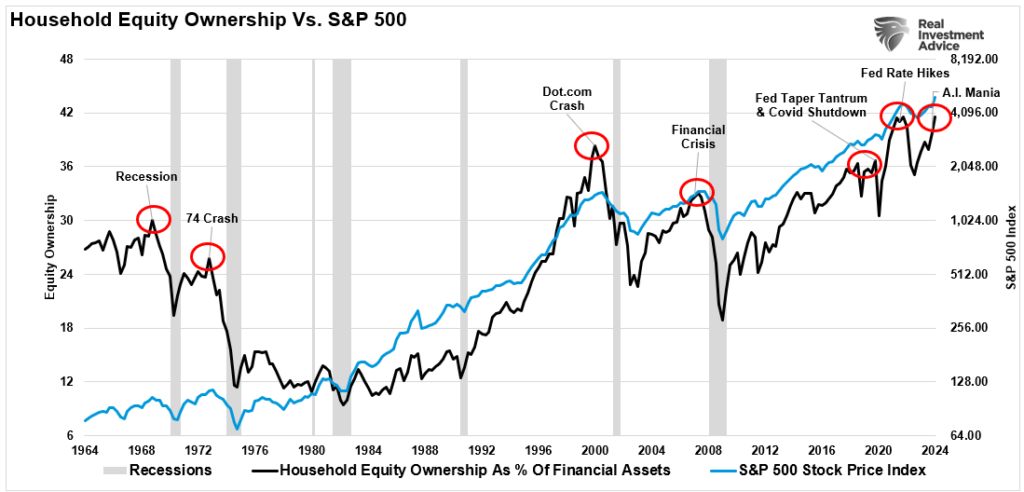
In “Rising Bullishness,” we discussed how the performance chase has led to individual investors slashing cash and increasing household equity allocations to record levels.
At the same time, consumer expectations for higher stock prices in the next 12 months are at a record.
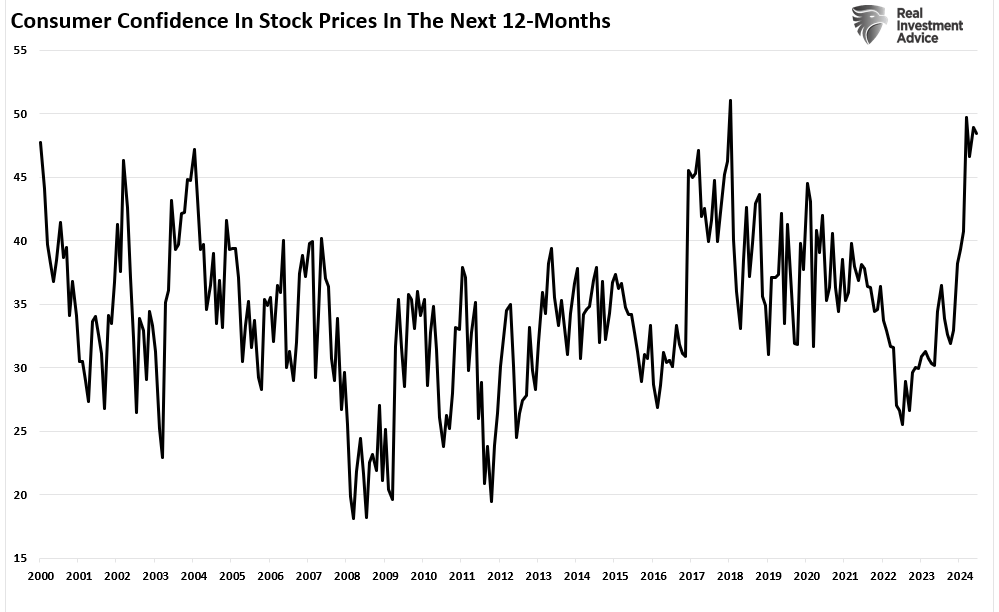
In other words, investors are bullish about the market, given consistently rising stock prices. However, we have noted that with the markets overbought, investors extremely optimistic, and volatility low, the risk of a 5-10% correction has risen. We discussed that risk in June.
“This past week, the market pushed well past our previous price target and is moving well into 3-standard deviations above the 50-DMA. Furthermore, the market is very overbought on multiple levels. Lastly, the volatility index is at extremely low levels, which has almost uniformly preceded corrections of 5-10% during both bull and bear markets.“
Notably, that was June 2023, about a month before the market peaked in July. That market peak was followed by a 10% correction at the end of October.
Interestingly, I can almost pen the same commentary with investors bullish, low volatility, and markets deviating well above long-term moving averages. As shown, the year-to-date price performance of the S&P 500 index is almost a mirror image of 2023. With the election approaching, the seasonal tendency of a market correction between August and October of election years suggests we may continue to see a repeat performance.
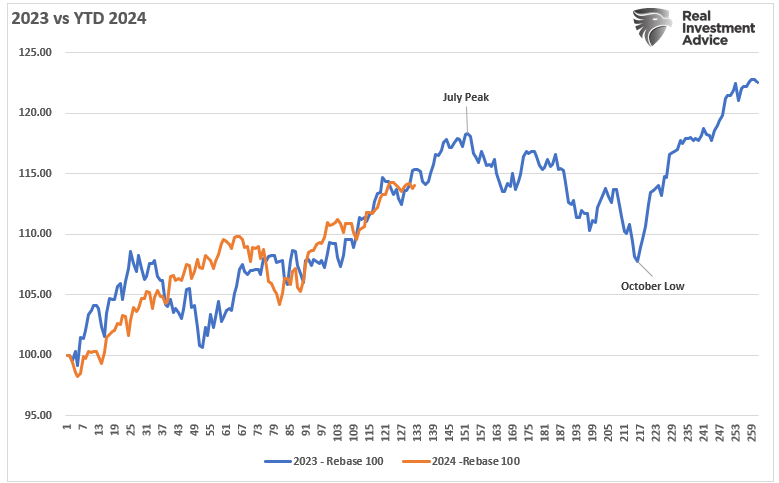
If the market does derisk pre-election, it will provide an opportunity to increase exposure as needed for the post-election rally into the year-end.
Of course, much of this will depend on what the Fed does next.
Rate Cut In July?
The Federal Reserve will meet at the end of this month to determine its next steps in monetary policy. While the market has been rallying on expectations of the Fed cutting rates this year, there is a very low expectation of a rate cut in July. However, could the Federal Reserve surprise the market with a rate cut? It is certainly possible, but much will depend on the data in the upcoming employment report and the core consumer price index.
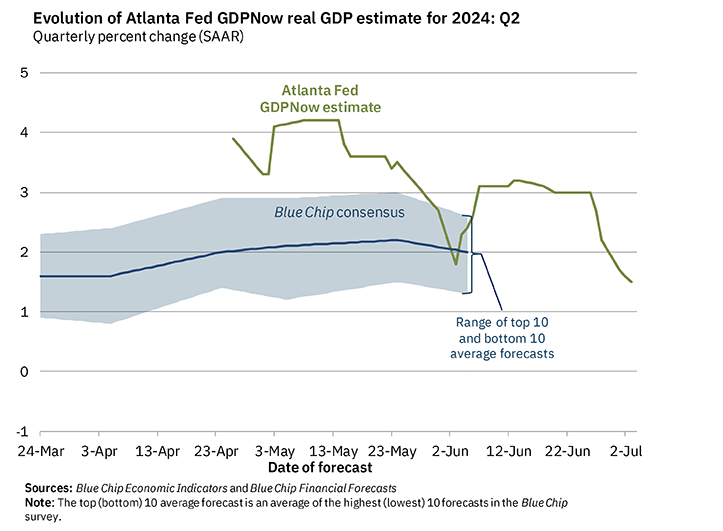
The Fed’s primary concern continues to be keeping the economy out of a recession while slowing the growth rate to bring down inflationary prices. It is a tricky tightrope, likely leading to significant policy-making errors. However, as of late, economic data continues to disappoint, with the Atlanta Fed’s GDPNow tracker for Q2 dropping from over 4% to 1.5%. Such suggests an unexpected deterioration in activity over the last two months.
Most notably, the Institute of Supply Management (ISM) Non-Manufacturing index turned sharply lower in June. As we explained previously:
“While much of the manufacturing data has remained weak for quite some time, the services side of the data has remained somewhat robust. Services are essential to the economic outlook. While many looked at the manufacturing data and suggested a recession was likely, we argued previously that such was not possible as services now comprise 80% of the economy.
The reason was that the service sector of the U.S. economy remained strong enough to keep the economy afloat until the debt ceiling issue was resolved and Japan returned online. Unlike in the past, where manufacturing was a significant component of economic activity, today, services comprise nearly 80% of each dollar spent.”

“This isn’t the first time we have seen the manufacturing side of the economy contract, but services remained robust enough to keep the overall economy out of recession. As shown, when the economy’s manufacturing side contracts while services remain expanding, the economy has a “soft recession.” The 1998, 2011, and 2015 periods are the most recent examples.”
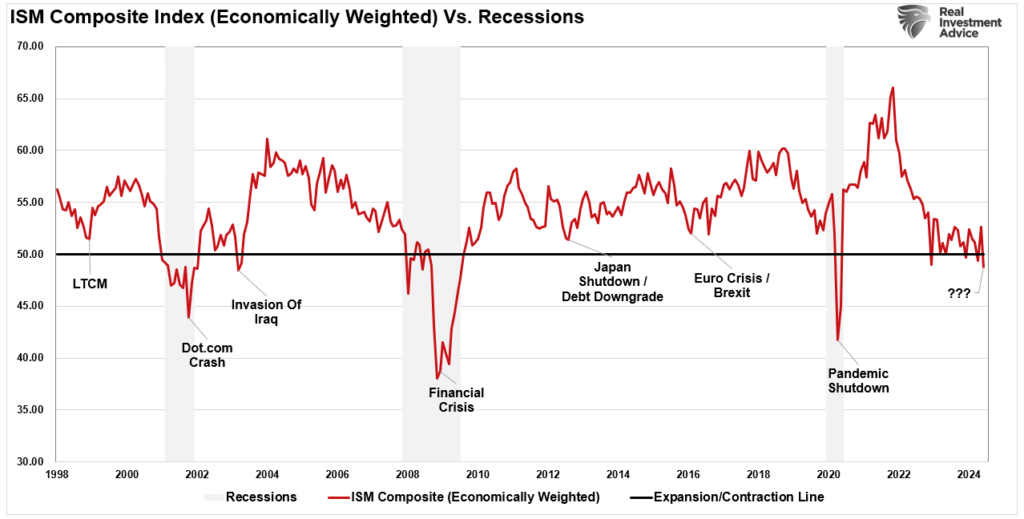
While the ISM services index has been very volatile over the last few months, the latest reading showed a sharp contraction into contractionary territory and remains in a downtrend. Such continues to suggest the economy is much weaker than headline data suggests. While one month of a contraction reading is not meaningful, if the economically weighted index remains in contraction territory over the next several months, such will be another indicator that previously coincided with economic recessions.
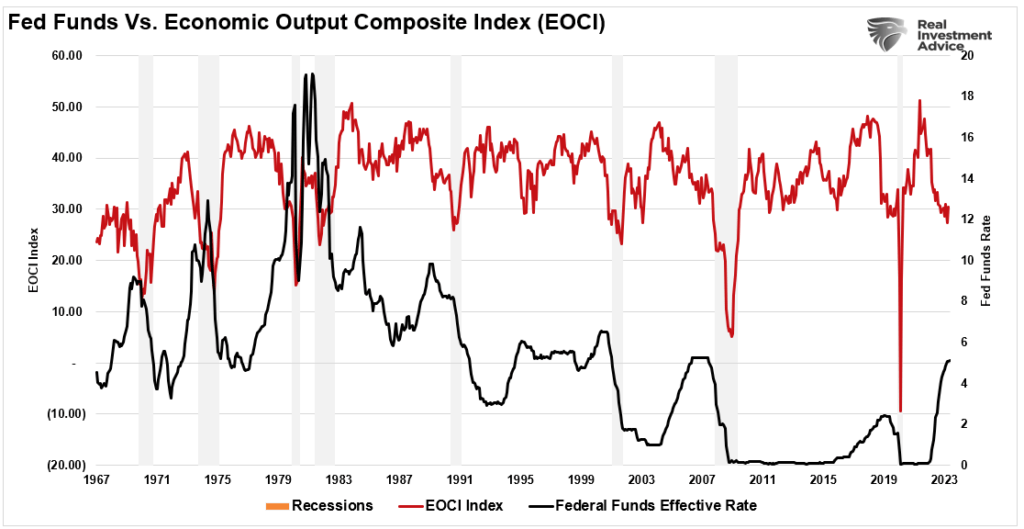
Furthermore, confirming the ISM readings, the Economic Composite Index (an index of more than 100 data points) has fallen to levels previously coinciding with recessions. Such suggests economic risk and a sharp deterioration in upcoming economic data will catalyze an initial rate cut. The Fed previously cut rates sharply, with the EOCI index at very low levels due to the onset of a recession.
Crucially, the financial markets are running well ahead of economic production. As shown, there is usually a reasonably close relationship between the ISM Composite Index and the annual rate of return of the S&P 500. That is because earnings are a function of economic activity. However, as shown above, and below, investors and analysts are incredibly ebullient about future growth far above what the economy produces.
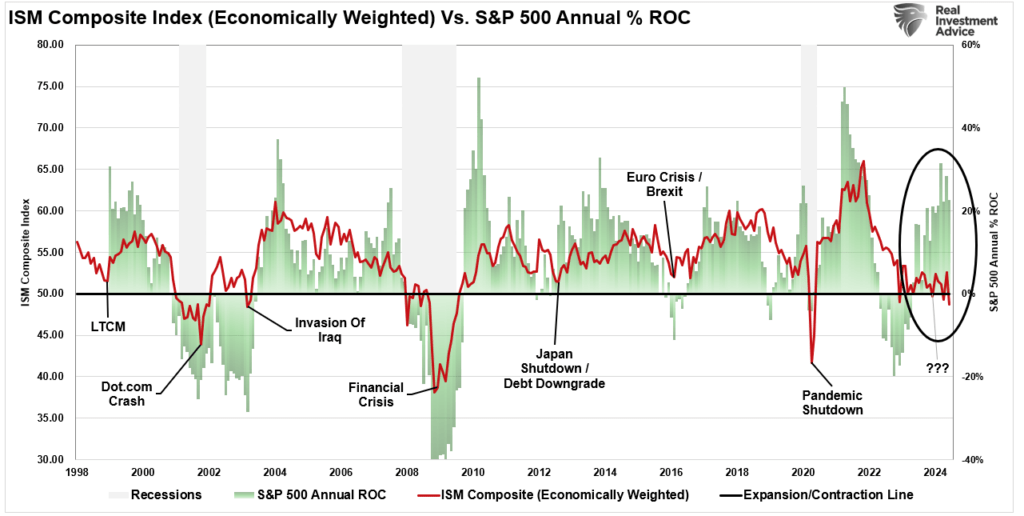
Of course, while the markets may be rallying in anticipation of rate cuts now, that bullishness will evaporate quickly when the decline in economic activity impacts earnings.
Will the Fed cut rates in July? We don’t think so, but the data is becoming more supportive of action. However, if the Fed cuts rates in July, it is likely a good signal that we will need to become less aggressive on equity allocations.
How We Are Trading It
As discussed above, 2024 has been almost a mirror image of last year, with market performance very close. Will the correlation continue, and we see a correction this summer, or will this time be different? I don’t know, but the similarity is eerie, and the risk of correction is elevated in the near term.
For now, momentum remains king, keeping portfolios allocated towards equity risk. However, we are beginning to look into more “defensive” positions to add to or swap in the portfolio. We expect a correction this summer to provide a better risk/reward opportunity to increase equity exposure.
While I have repeated the rules below over the last several weeks, reviewing your portfolio for opportunities to manage risk remains a good practice.
- Tighten up stop-loss levels to current support levels for each position.
- Hedge portfolios against significant market declines.
- Take profits in positions that have been big winners
- Sell laggards and losers
- Raise cash and rebalance portfolios to target weightings.
Notice, nothing in there says, “Sell everything and go to cash.”
Just manage risk as needed to mitigate the impact of a sudden reversal.
Have a great week.
Research Report

Subscribe To “Before The Bell” For Daily Trading Updates
We have set up a separate channel JUST for our short daily market updates. Please subscribe to THIS CHANNEL to receive daily notifications before the market opens.
Click Here And Then Click The SUBSCRIBE Button
Subscribe To Our YouTube Channel To Get Notified Of All Our Videos
Bull Bear Report Market Statistics & Screens

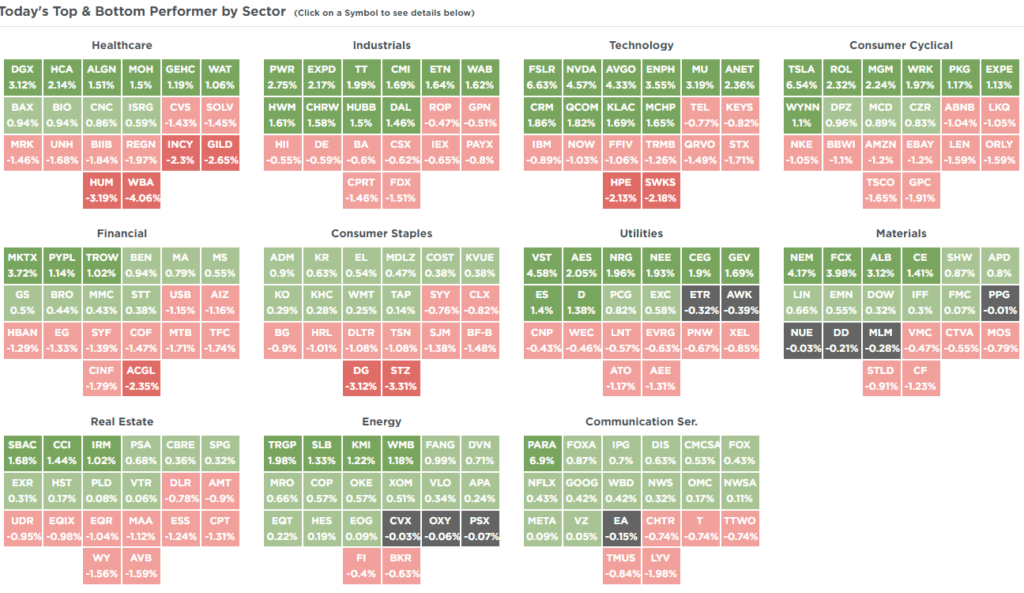
SimpleVisor Top & Bottom Performers By Sector
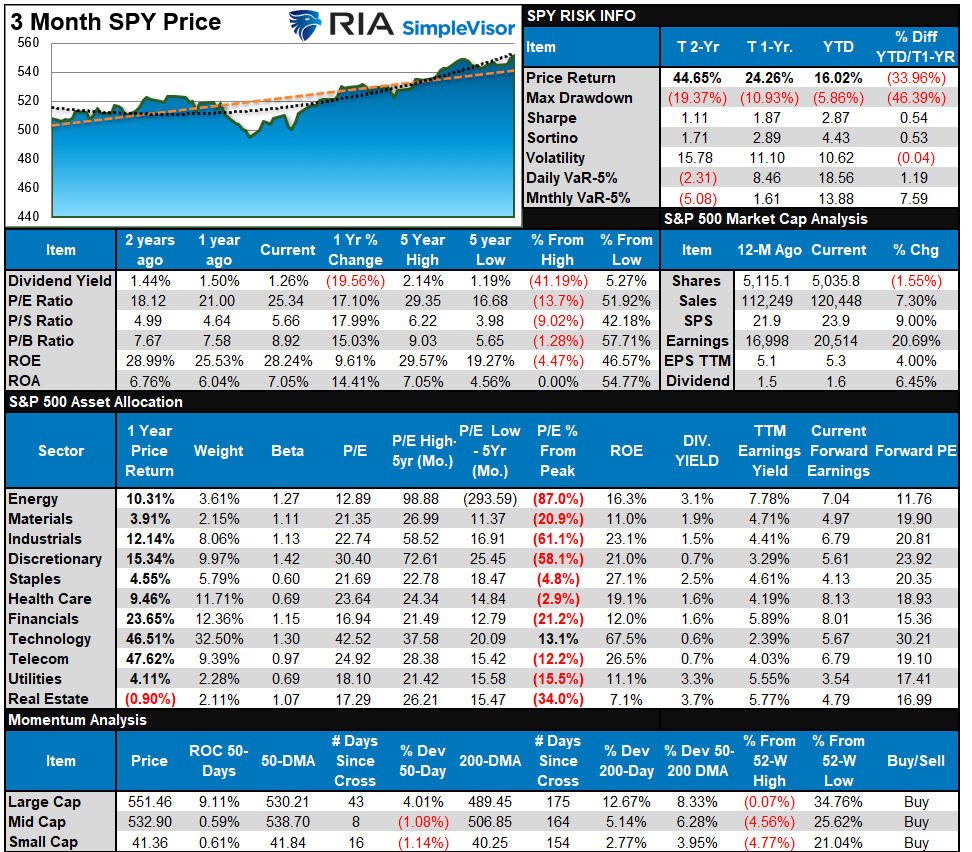
S&P 500 Weekly Tear Sheet
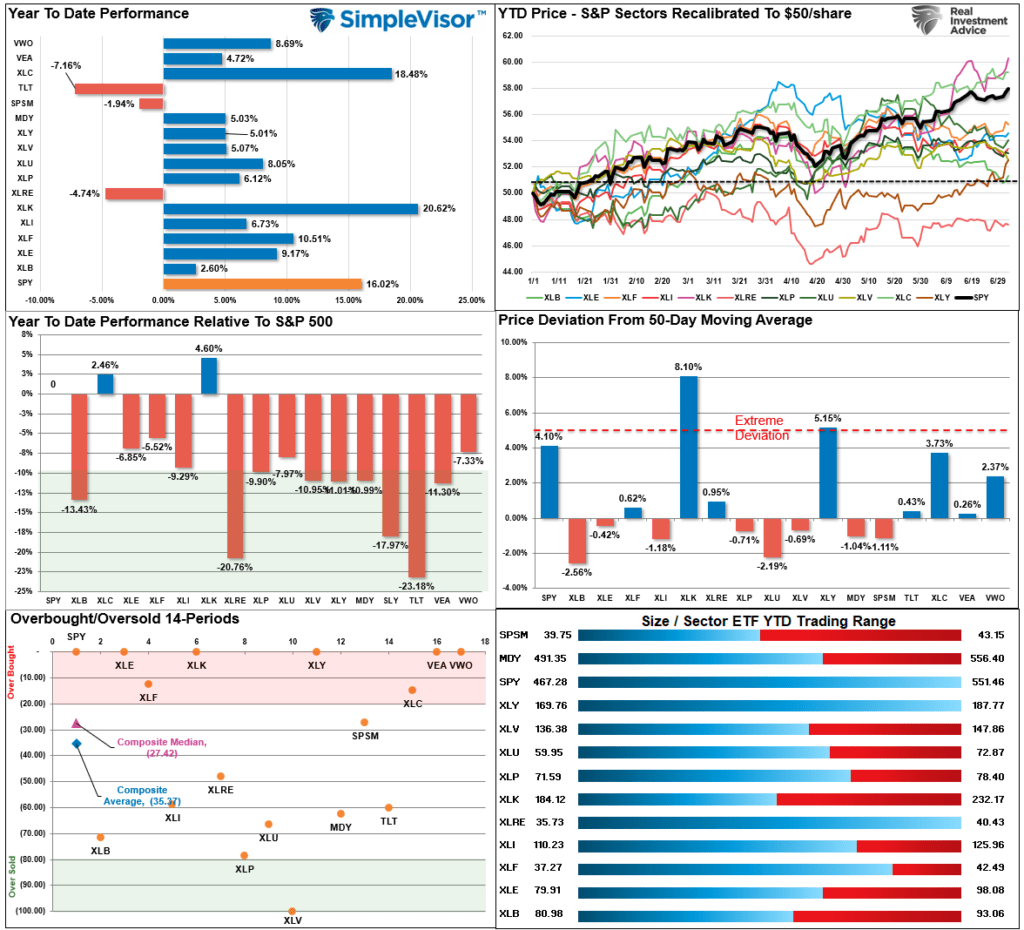
Relative Performance Analysis
This past week, energy, technology, financials, and discretionary stocks, along with small caps and international and emerging markets, picked up a bid. Much of this week’s action is a function of portfolio rebalancing for the beginning of the new quarter and the last half of the year. I wouldn’t read much into this week’s action, with the Q2 earnings season kicking off with the major banks late next week.
Technical Composite
The technical overbought/sold gauge comprises several price indicators (R.S.I., Williams %R, etc.), measured using “weekly” closing price data. Readings above “80” are considered overbought, and below “20” are oversold. The market peaks when those readings are 80 or above, suggesting prudent profit-taking and risk management. The best buying opportunities exist when those readings are 20 or below.
The current reading is 87.08 out of a possible 100.

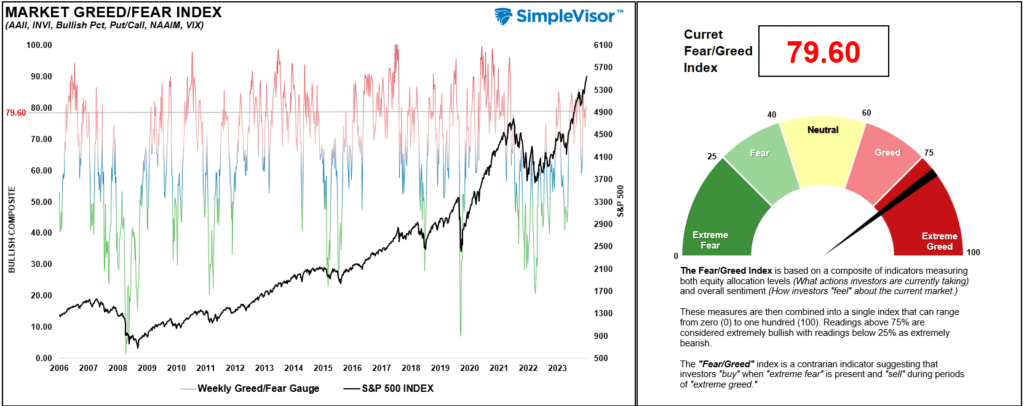
Portfolio Positioning “Fear / Greed” Gauge
The “Fear/Greed” gauge is how individual and professional investors are “positioning” themselves in the market based on their equity exposure. From a contrarian position, the higher the allocation to equities, the more likely the market is closer to a correction than not. The gauge uses weekly closing data.
NOTE: The Fear/Greed Index measures risk from 0 to 100. It is a rarity that it reaches levels above 90. The current reading is 79.60 out of a possible 100.
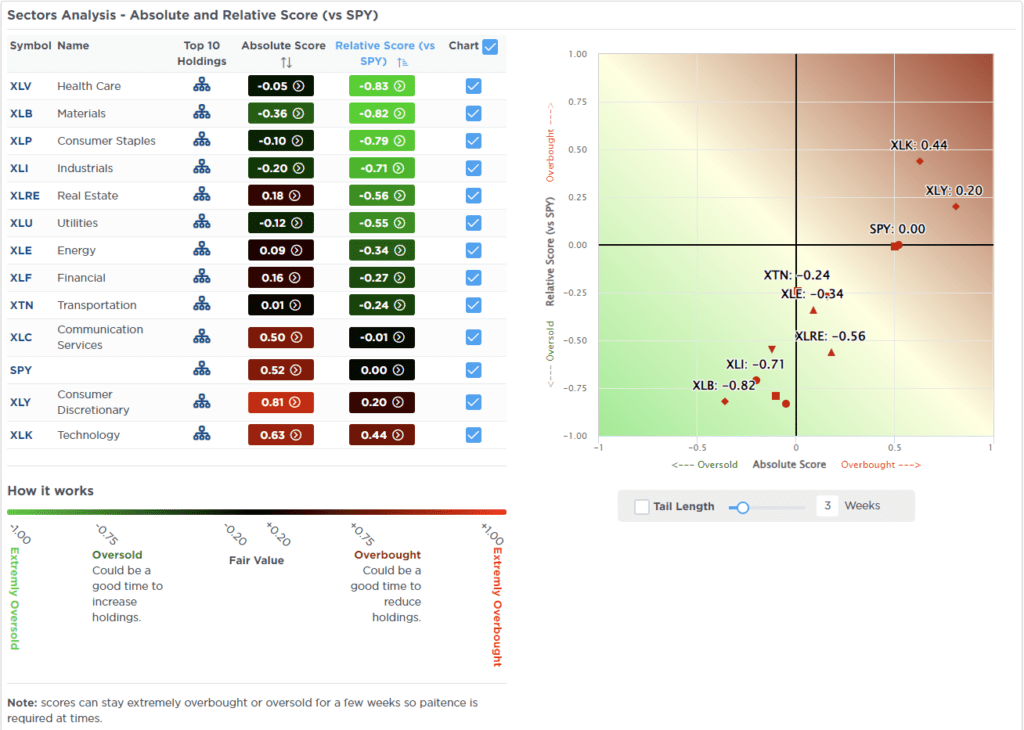
Relative Sector Analysis
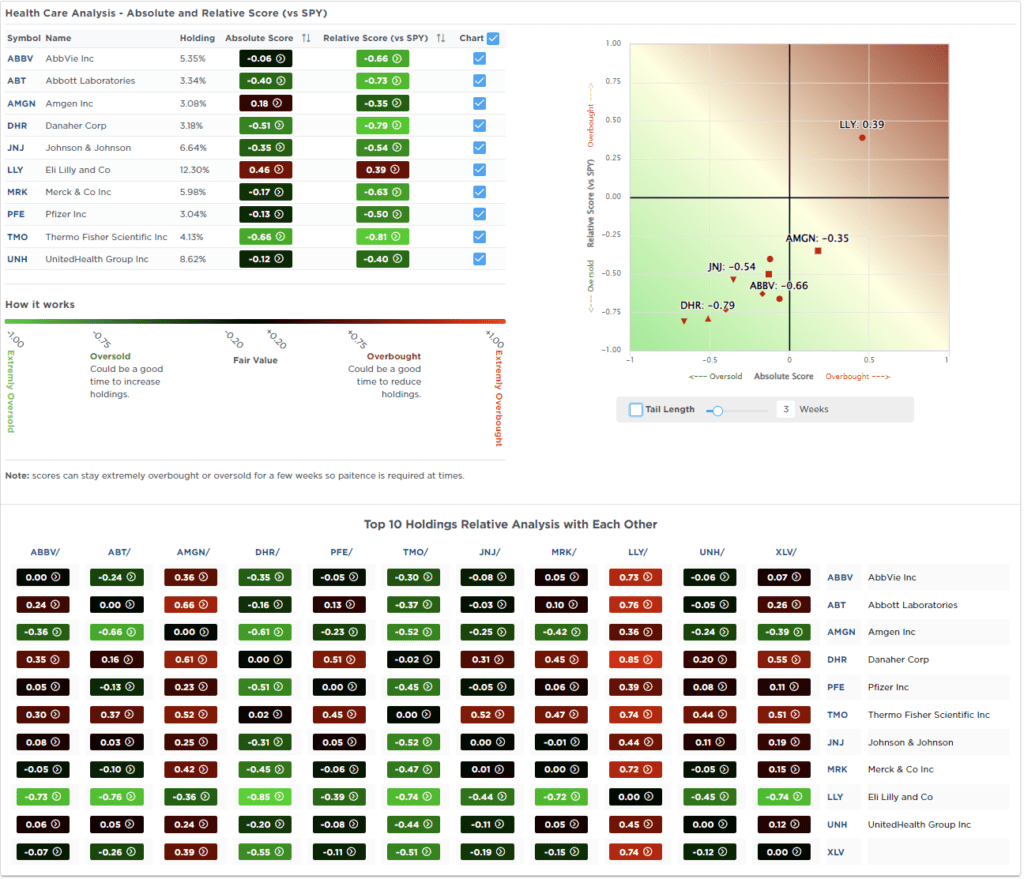
Most Oversold Sector Analysis
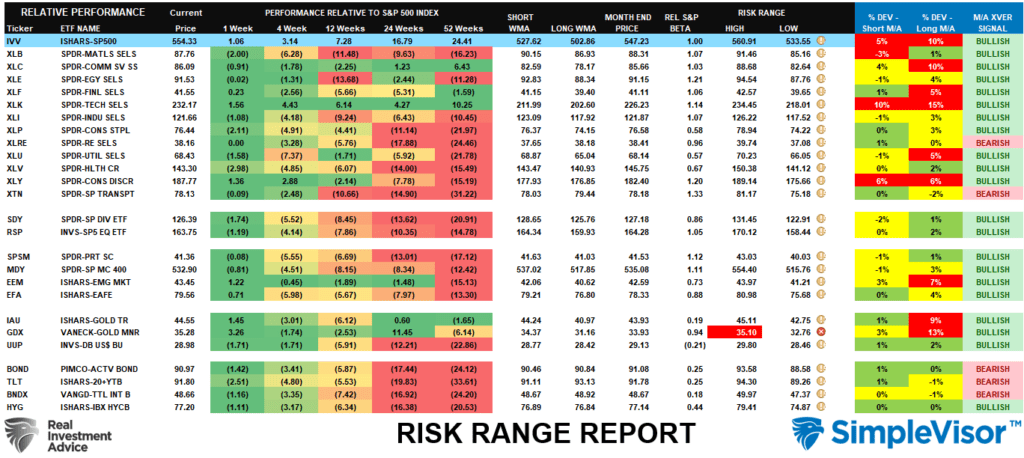
Sector Model Analysis & Risk Ranges
How To Read This Table
- The table compares the relative performance of each sector and market to the S&P 500 index.
- “MA XVER” (Moving Average Crossover) is determined by the short-term weekly moving average crossing positively or negatively with the long-term weekly moving average.
- The risk range is a function of the month-end closing price and the “beta” of the sector or market. (Ranges reset on the 1st of each month)
- The table shows the price deviation above and below the weekly moving averages.
Many sectors and markets reversed their underperformance this past week. I wouldn’t read too much into the current action as a “change in trend,” as it likely has much to do with the end of last quarter and the beginning of the new one. Most markets are in bullish long-term crossovers, with trends remaining intact. There isn’t much reason to be bearish, but keep monitoring this report, as it will signal deterioration when it begins to occur.
Weekly SimpleVisor Stock Screens
We provide three stock screens each week from SimpleVisor.
This week, we are searching for the Top 20:
- Relative Strength Stocks
- Momentum Stocks
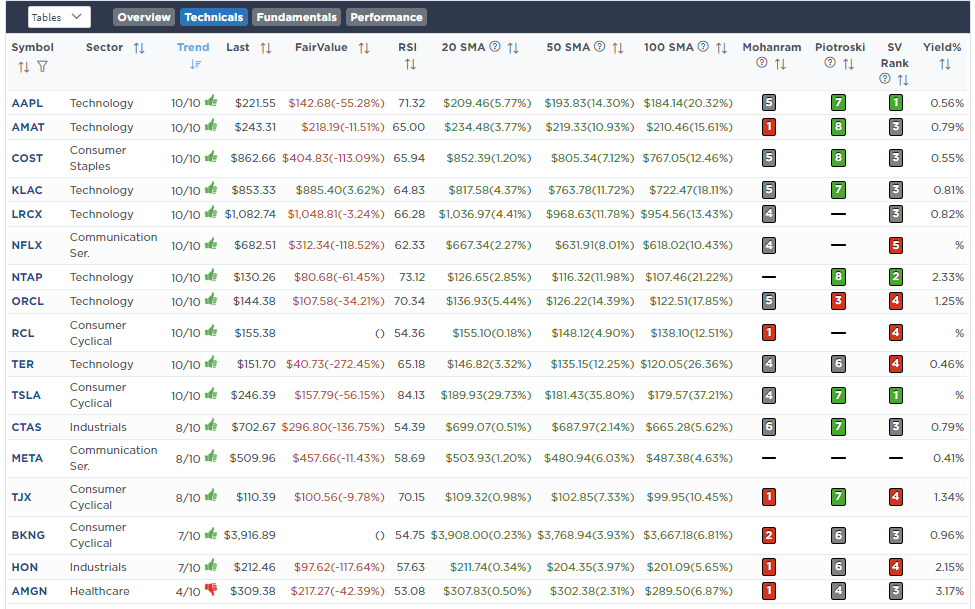
- Fundamental & Technical Strength W/ Dividends
(Click Images To Enlarge)
RSI Screen
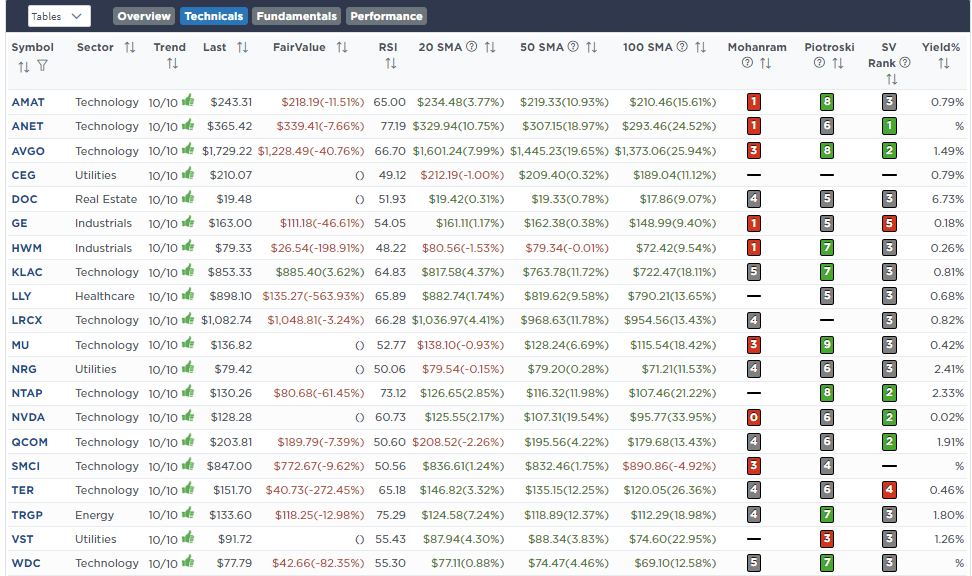
Momentum Screen

Fundamental & Technical Screen
SimpleVisor Portfolio Changes
We post all of our portfolio changes as they occur at SimpleVisor:
No Trades This Week

Lance Roberts, C.I.O.
Have a great week!

