
This Wednesday’s Nvidia (NVDA) quarterly earnings announcement will be the most watched earnings report of the quarter. Not only will Nvidia’s shareholders pay close attention, but many non-shareholders will watch as the results could have a big impact on the entire market. Quite simply, not only has Nvidia’s stock been the poster child for all that AI offers, but its earnings have been a massive driver of S&P 500 earnings. The graph on the left, courtesy of BofA Global Research, highlights that Nvidia’s earnings have accounted for about a third of the entire S&P 500 earnings growth over the past two quarters.
So what is the market expecting? Wall Street consensus expectations are for revenue growth of more than +230% and earnings growth of +400%, year over year. As shown on the right side, options prices imply a +/- 8.5% move on Nvidia’s earnings report. That equates to roughly $200B in market cap. Put another way, Nvidia is expected to add or lose McDonald’s market cap ($196B) Wednesday afternoon. Beating expectations may not be enough to push Nvidia’s stock higher. Given its incredible outperformance, investors may not only want revenues and EPS to come in above estimates but also be banking on the company to increase its earnings guidance for the coming quarters.

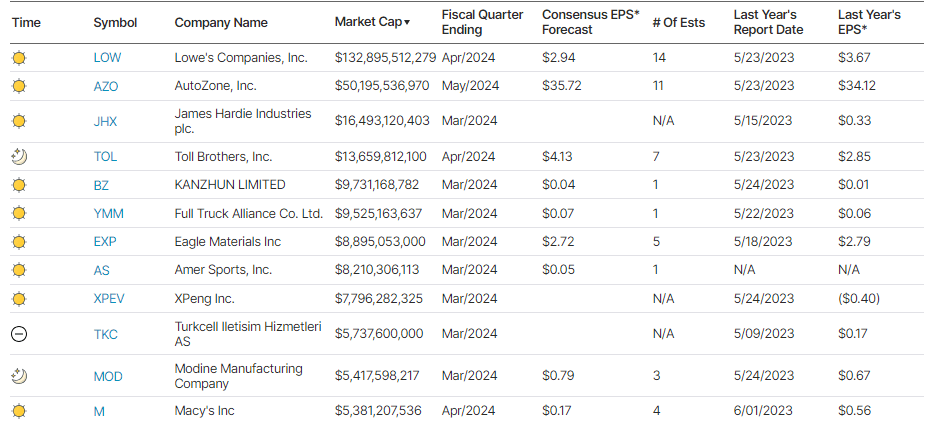
What To Watch Today
Earnings
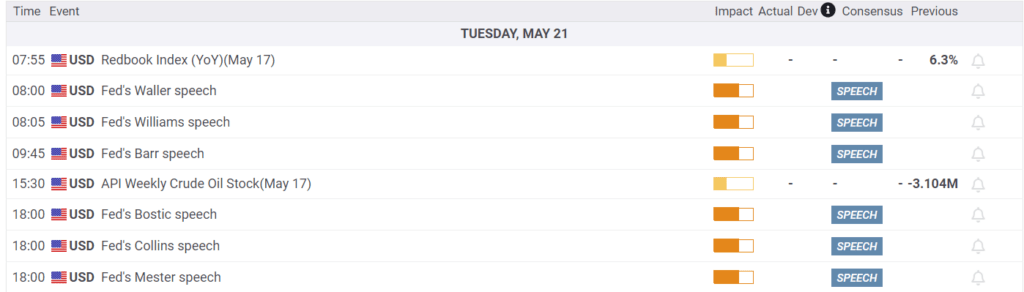
Economy
Market Trading Update
As discussed yesterday, the market continues to trade bullishly but is getting overbought on many levels. Such was evident in this weekend’s risk/range report, with many sectors and markets trading well above long-term moving averages. As noted, double-digit deviations from long-term means tend to be corrected over time. However, in the short-term, these bullish trades, driven by momentum and narrative, can last longer than you think.
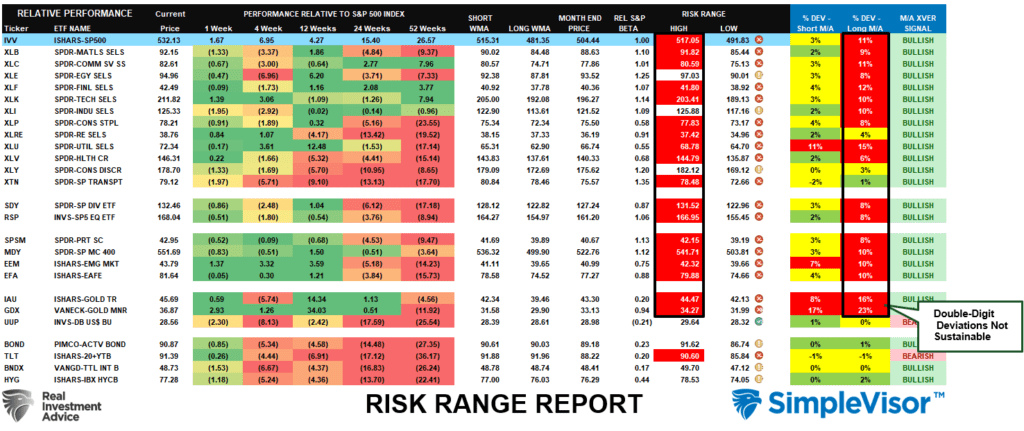
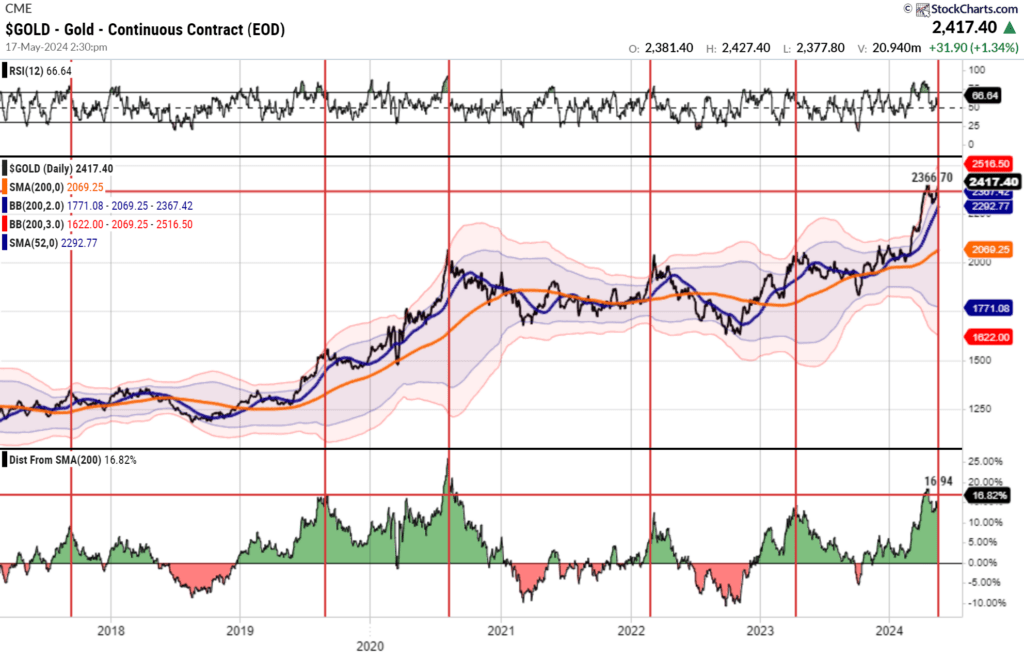
One of the more extreme deviations is in gold and gold miners, which are extremely overbought and extended from long-term means. As shown in the chart below, historically, large deviations in gold from the 200-DMA typically correlate with peaks in the metal. Those peaks typically lead to larger corrections to revert those deviations. Therefore, if you are long gold and gold miner stocks, they have had a great run. Don’t forget to take profits. (That doesn’t mean sell everything.)

Is AI A Bubble, A Sustainable Trend, Or Both?
As explemplified by Nvidia, stocks related to AI have been the market leaders recently. The incredible performance of some AI stocks leads some to compare the current period to 1999. At that time, tech stocks related to the web were flying high on expectations for massive earnings growth. So, we must ask ourselves whether AI is also a bubble or if the market might be correctly pricing for significant earnings growth in the future. We rely on George Soros, one of the most successful investors, to opine.
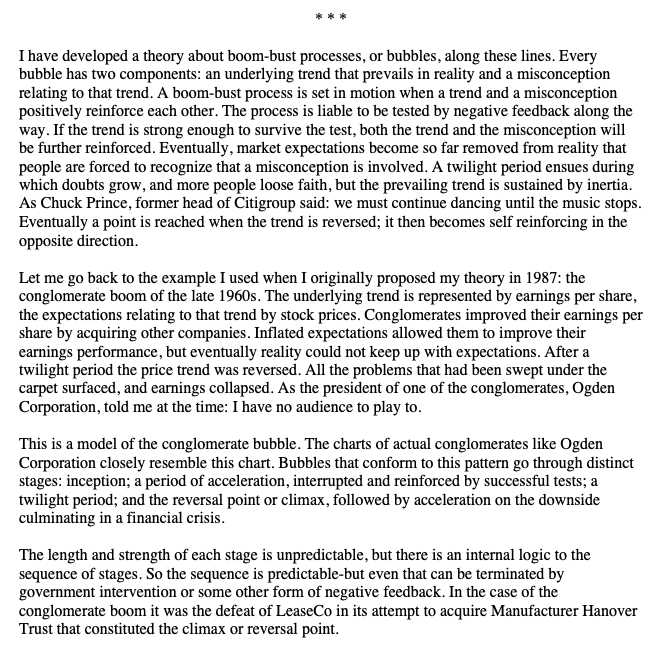
George Soros’s theory on how stock market bubbles are formed and popped states, “Every bubble has two components: an underlying trend that prevails in reality and a misconception relating to that trend.”
The Basic Materials Sector Takes The Week
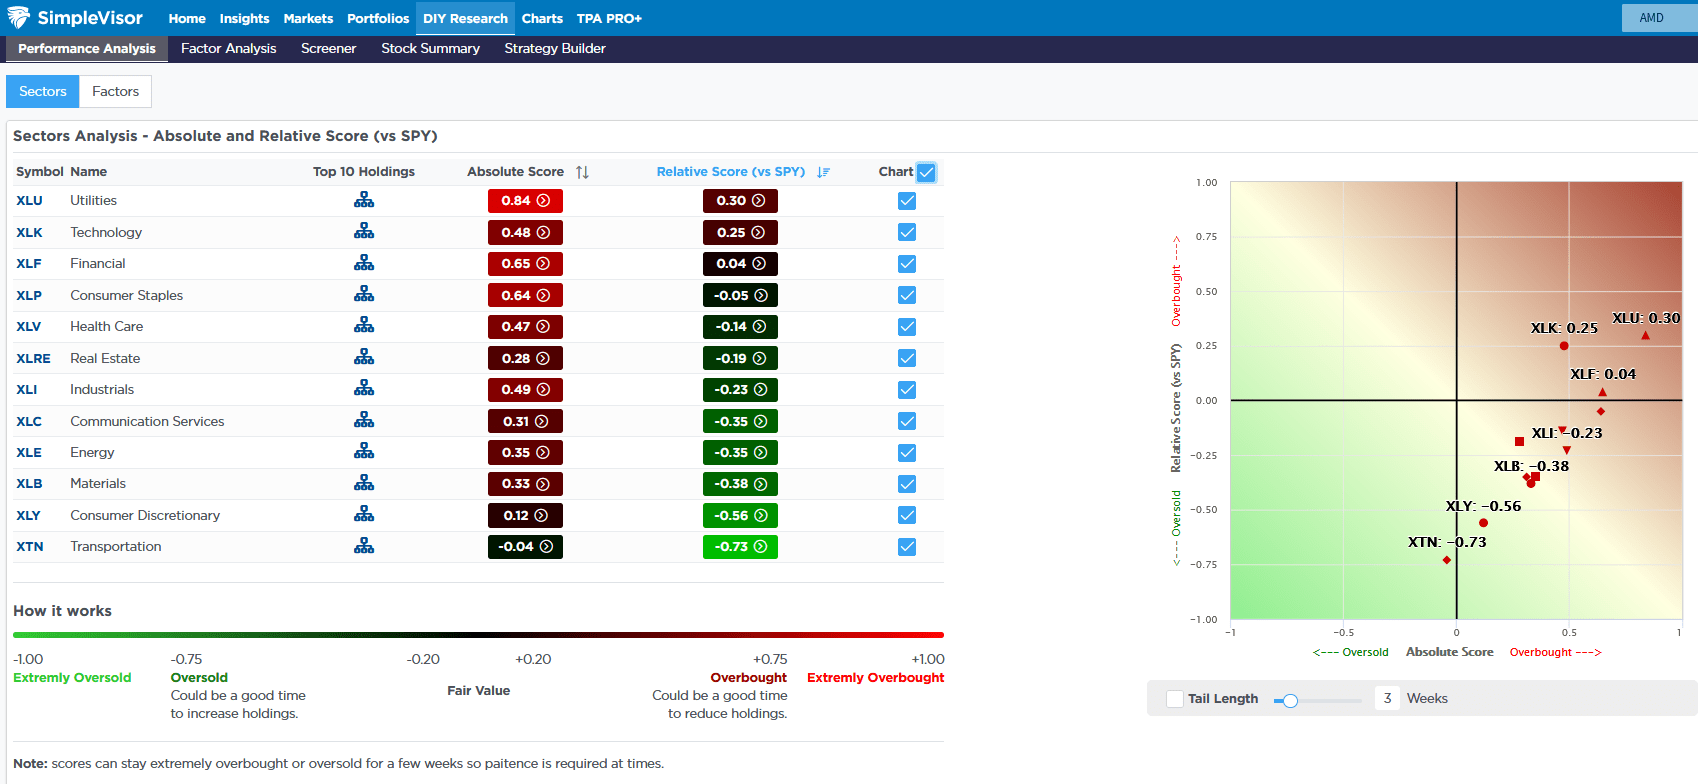
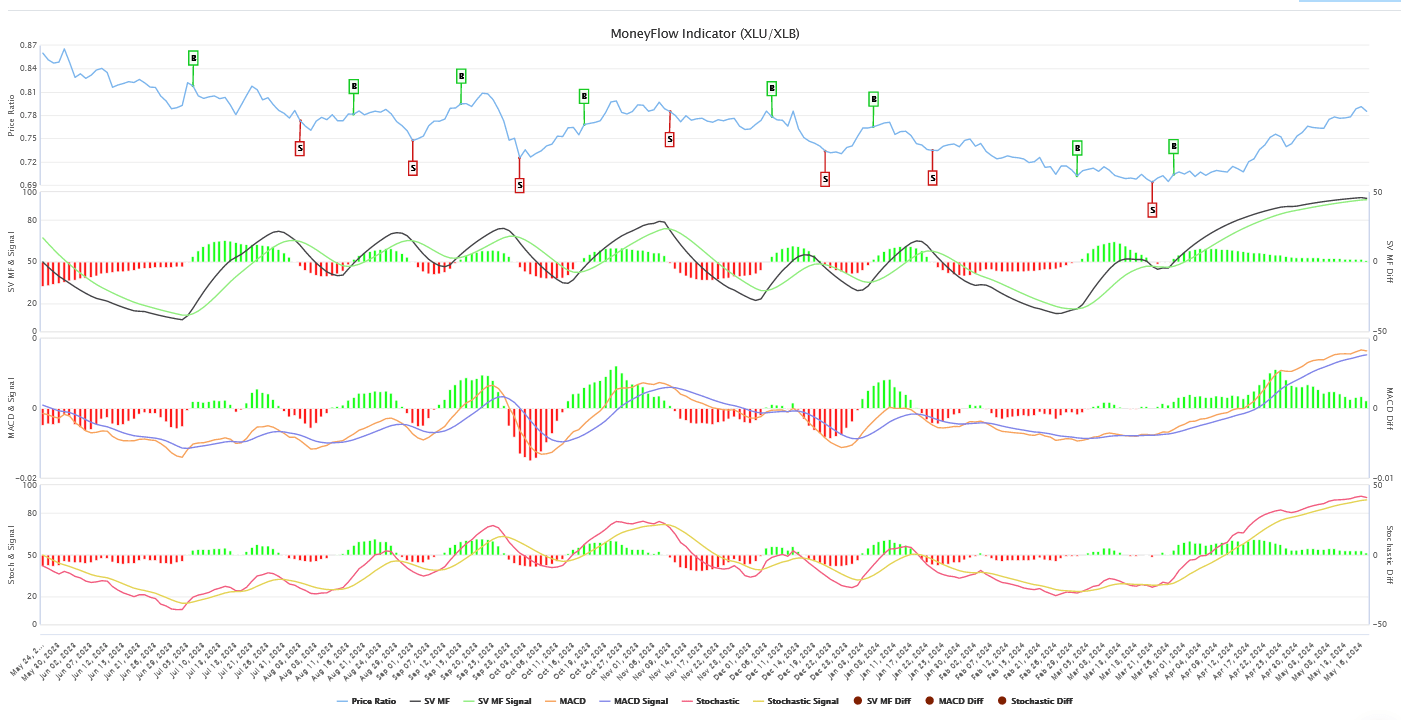
As the first graph below shows, basic materials led the week up over 3%. Despite the outperformance, the sector remains oversold, as shown in the second graphic, courtesy of SimpleVisor. Utilities remain the most overbought sector. SimpleVisor allows us to compare utilities to the materials sector to see if a new rotation, away from utilities toward materials, may be at hand. The top graph in the third graphic shows the price ratio of utilities to materials. The nearly year-long downtrend has recently broken higher as utilities have significantly outperformed materials over the last month.
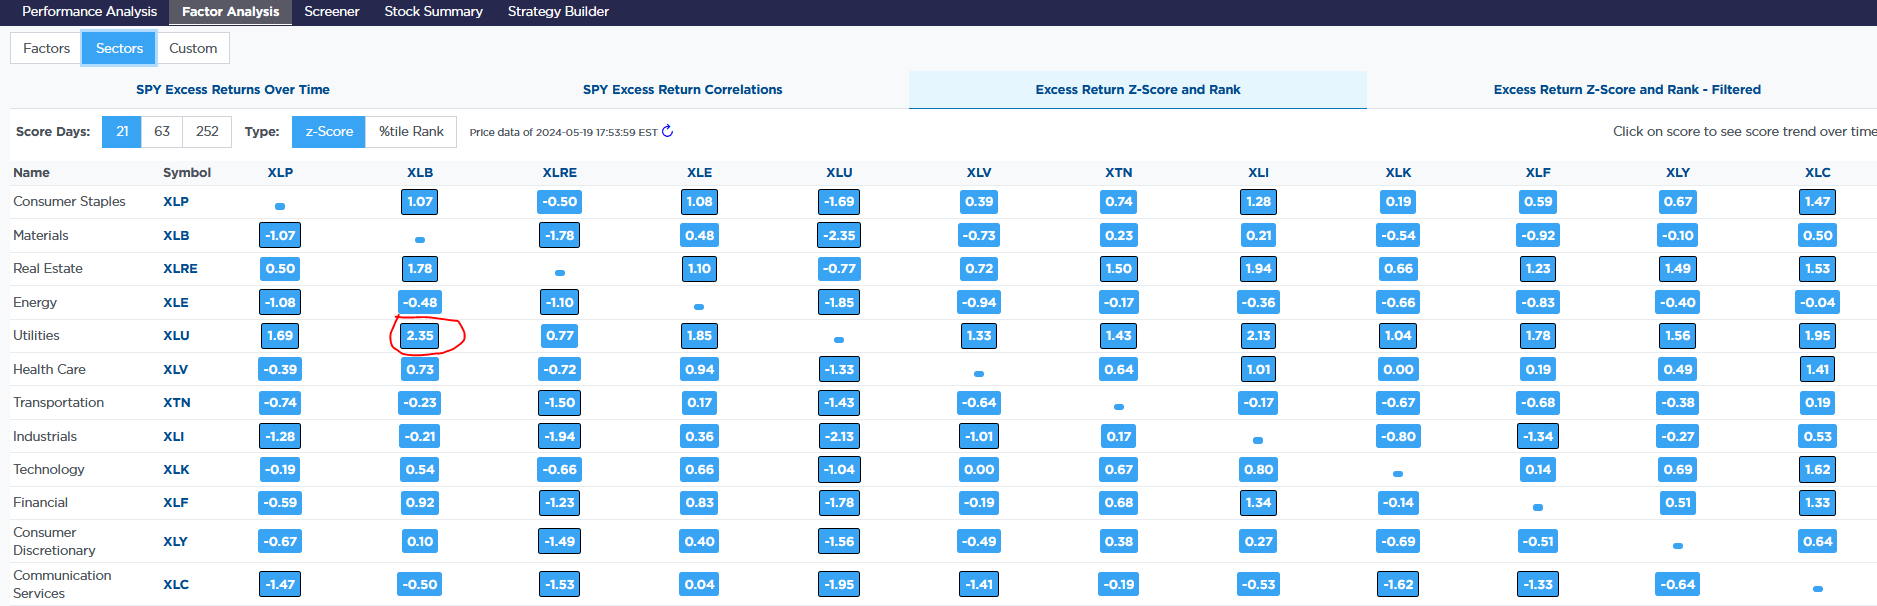
The relative outperformance may still have more room to run. Still, the technical indicators below the utilities materials ratio graph show the ratio will likely consolidate or trend lower in the coming weeks. The relative performance is now 2.35 standard deviations extended (fourth graphic below), which also argues for a break in the trend, even if temporary.

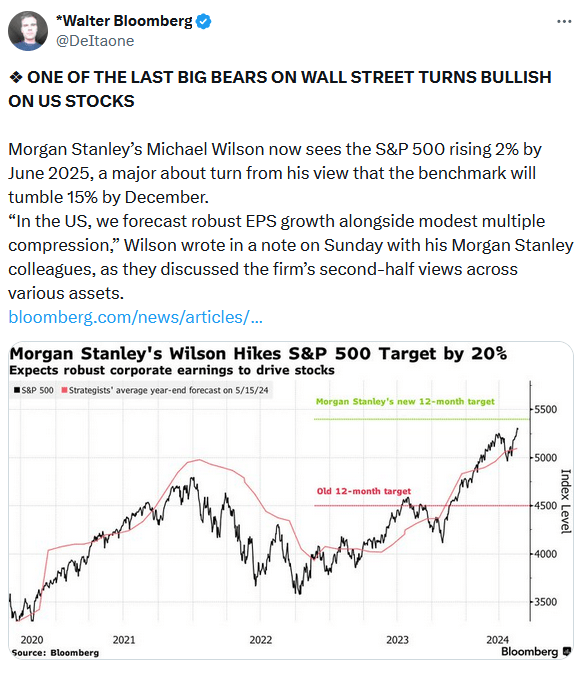
Tweet of the Day
“Want to achieve better long-term success in managing your portfolio? Here are our 15-trading rules for managing market risks.”
Please subscribe to the daily commentary to receive these updates every morning before the opening bell.
If you found this blog useful, please send it to someone else, share it on social media, or contact us to set up a meeting.

