
Yesterday’s commentary answered a question from a reader about our thoughts on owning gold or gold miners during a bull steepening period. Hours after publishing the commentary, we got a similar question asking how bitcoin might do when the Fed cuts rates. If bitcoin trades as a proxy of monetary policy and the dollar’s viability, then the question and answer are very important to grasp as the Fed embarks on a rate-cutting period. Bear in mind that we only have ten years of bitcoin data, so take the following analysis with some skepticism.
We separated the graph below charting Fed Funds and Bitcoin into the three Fed policy cycles: rate cutting, easing, and doing nothing. The two blue-shaded areas show mixed results when the Fed raises rates. In 2017-2018, bitcoin rose sharply but then gave up most of its gains. More recently, bitcoin fell as the Fed raised rates. The green bar shows one experience with rate cuts that was not friendly for Bitcoin holders. Its price was nearly cut in half during the period. However, what stands out most are the yellow circles highlighting periods when the Fed was doing nothing. Bitcoin surged in the three instances.
If bitcoin is indeed a proxy for rate policy, a rate cut should be good for it. However, our limited history argues otherwise.

What To Watch Today
Earnings
- No notable earnings releases today.
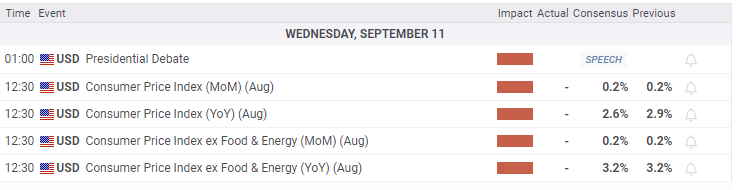
Economy
Market Trading Update
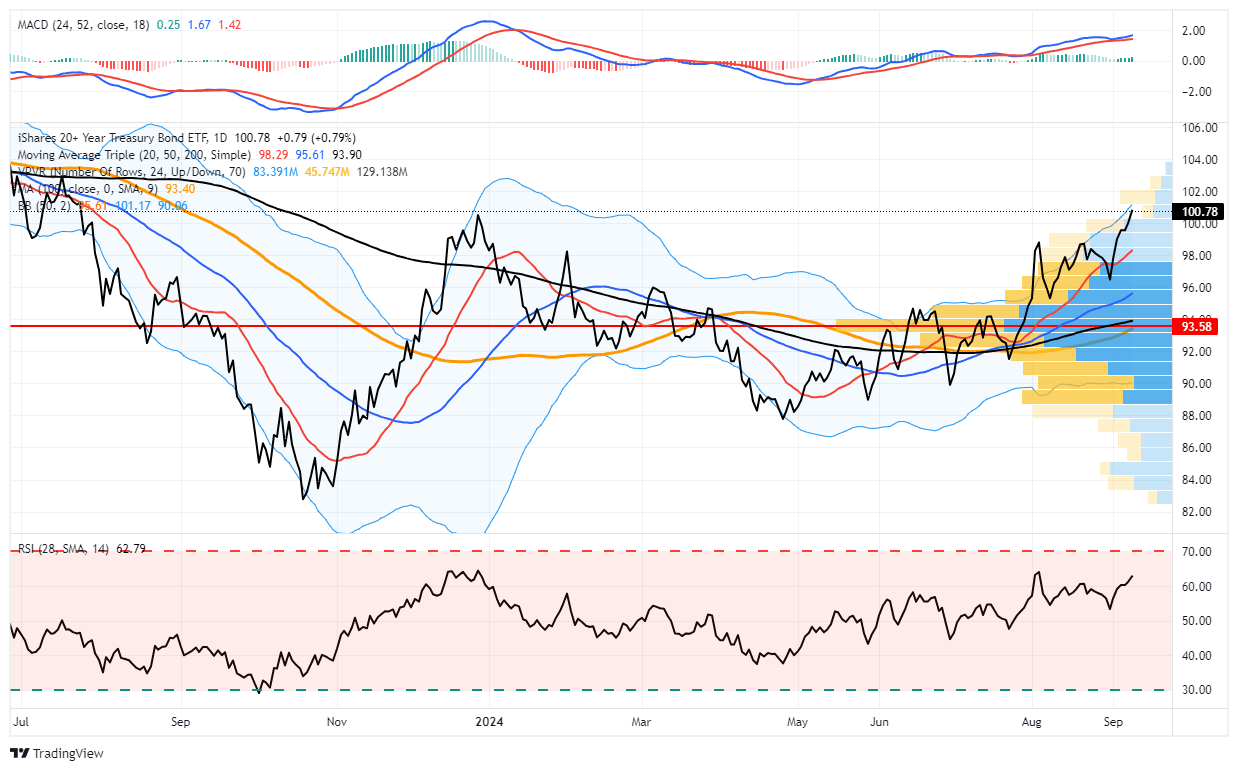
Yesterday, we discussed the initial test of the 100-DMA, which was held yesterday, but the 50-DMA currently provides decent overhead resistance for equities. However, Treasury bonds continue to extend their rally as anticipation for rate cuts builds and economic growth weakens. In August 2023, I discussed how I doubled down on my bond positions in anticipation of the coming bond rally despite arguments to the contrary from many mainstream analysts.
While our thesis was proven correct, bonds are now extremely overbought in the near term, with declining volume and deviating above the 50-DMA. For investors looking to add Treasury bond exposure at current levels, such will likely be painful as yields should retrace somewhat from current levels towards 4%. What causes such a retracement is unknown, but traders who were previously very short on Treasury bonds are now very long. Such positioning shifts often precede short-term retracements to previous support levels.
Using the 20-Year Duration Treasury Bond ETF (TLT) as a proxy for bond prices, I will become much more interested in increasing current exposure between 95 and 96. While prices could increase in the near term, waiting for an eventual correction to build positions will likely yield better long-term results.

NFIB Disappoints Again
The NFIB – Small Business Optimism Index continues to show small business owners are under a lot of strain and have a dim outlook on the future. The optimism index fell to 91.2 from 93.6. Hiring plans decreased. Only 4% of those surveyed said it was a good time to expand. In addition, the uncertainty Index, at 92, is the highest since October 2020. Moreover, positive profit trends are down a seasonally adjusted net -37%, -7% lower than last month, and now lower than the early months of the pandemic, as shown below.
So, the question is, what might help improve the outlook of small business owners and ultimately boost their businesses? The election is clearly hampering the outlook for many. The election in November will likely improve the outlook for some and worsen it for others. That said, policies by the new president to help small businesses could improve the outlook for business owners of both political parties.
The Fed may have the most sway regarding profit concerns. Small businesses are typically heavy users of debt. Furthermore, their interest rates tend to be much higher than those of larger companies. Therefore, lower interest rates will reduce their interest expenses and potentially lift their pessimism.

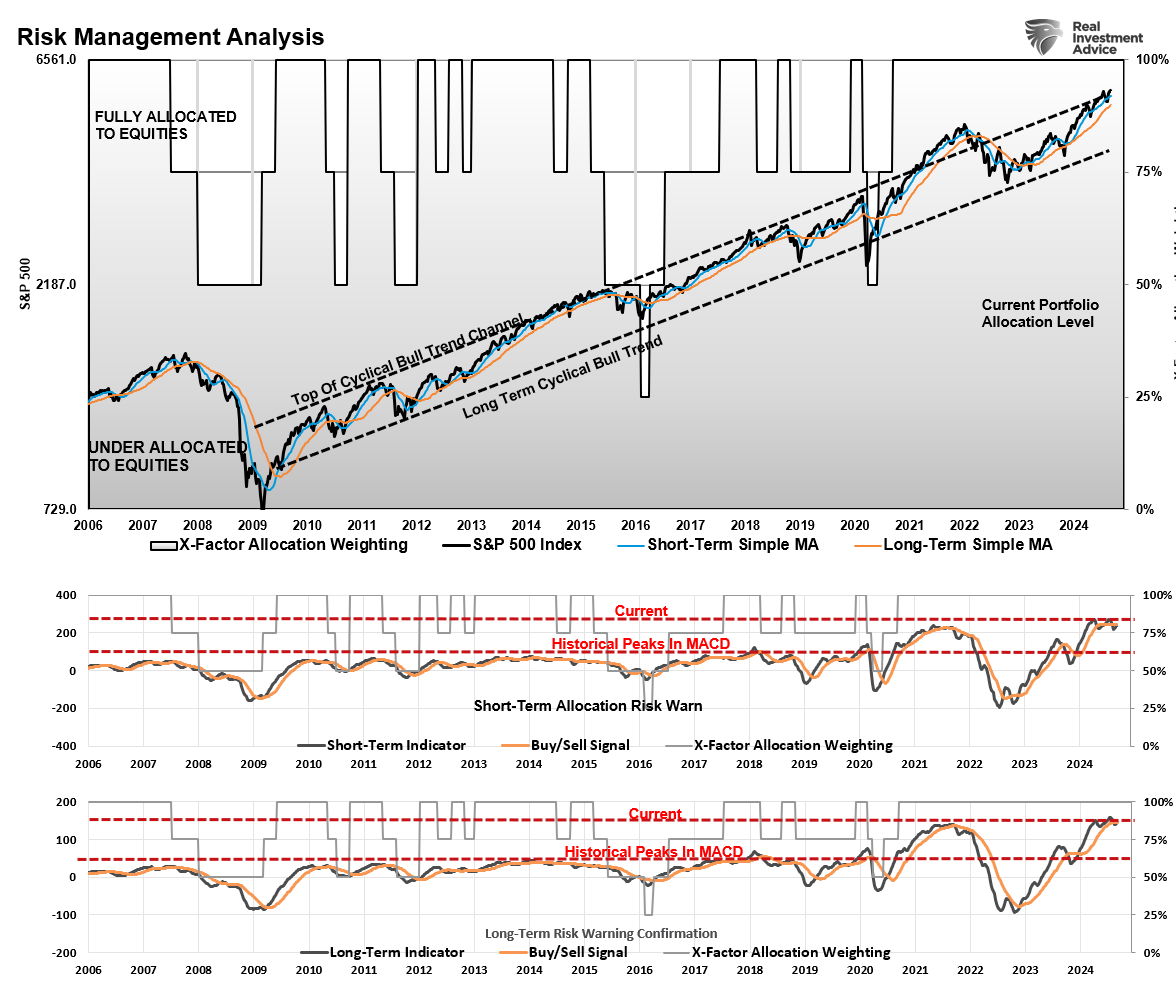
S&P 500 – A Bullish and Bearish Analysis
The S&P 500’s technical landscape presents both opportunities and challenges. Bullish indicators such as support at the 200-day moving average and oversold RSI levels suggest a “buy the dip” opportunity could be on the horizon. However, bearish patterns like lower highs and weakening volume during rallies warn of further downside risks.
We don’t know what will happen next, nor does anyone else. Therefore, we suggest a regular diet of risk management and portfolio rebalancing to navigate periods of elevated uncertainty.
Tweet of the Day

“Want to achieve better long-term success in managing your portfolio? Here are our 15-trading rules for managing market risks.”
Please subscribe to the daily commentary to receive these updates every morning before the opening bell.
If you found this blog useful, please send it to someone else, share it on social media, or contact us to set up a meeting.

