
In the Trolley Car Problem – The Fed’s Predicament, we laid out how the Fed may likely choose to fight inflation at the expense of triggering a recession.
“Jerome Powell can tackle inflation but risk a recession and lower stock prices. Or he can try to avoid a recession and risk persistently high inflation.”
On May 4, 2022, the FOMC policy statement stated, “the committee is highly attentive to inflation risks.” Additional comments from Jerome Powell’s post-FOMC press conference further warned the Fed was choosing to tame inflation even if it put the economy in a recession.
Some investors were paying attention to the changes in the Fed’s tone on May 4th and the hawkish anti-inflation rhetoric in the following weeks. They sensed the Fed decided how to handle their trolley car problem.
How do we know this? The price relationship between growth and cyclical stocks changed a few weeks after that meeting. Further, bond yields reversed course. These subtle market changes alerted us that the market’s inflation concerns were taking a back seat to recession fears.
Assuming its durability, such a change in sentiment can have significant implications for managing portfolio risk and maximizing returns. To help appreciate the market’s message, we must first discuss the primary factors driving growth and cyclical stocks.
Growth Stocks and Discount Rates
Growth stock investors often pay a high premium for companies that are losing money or have negligible earnings. Simply, they value earnings potential, not recent earnings trends.
Determining the price of a company with plenty of potential relies on growth forecasts. Equally important is converting growth forecasts or cash flows to a price today. This is done with the present value formula. The formula discounts each future year’s expected earnings or cash flows back to today based on an acceptable rate of return, known as the discount rate.
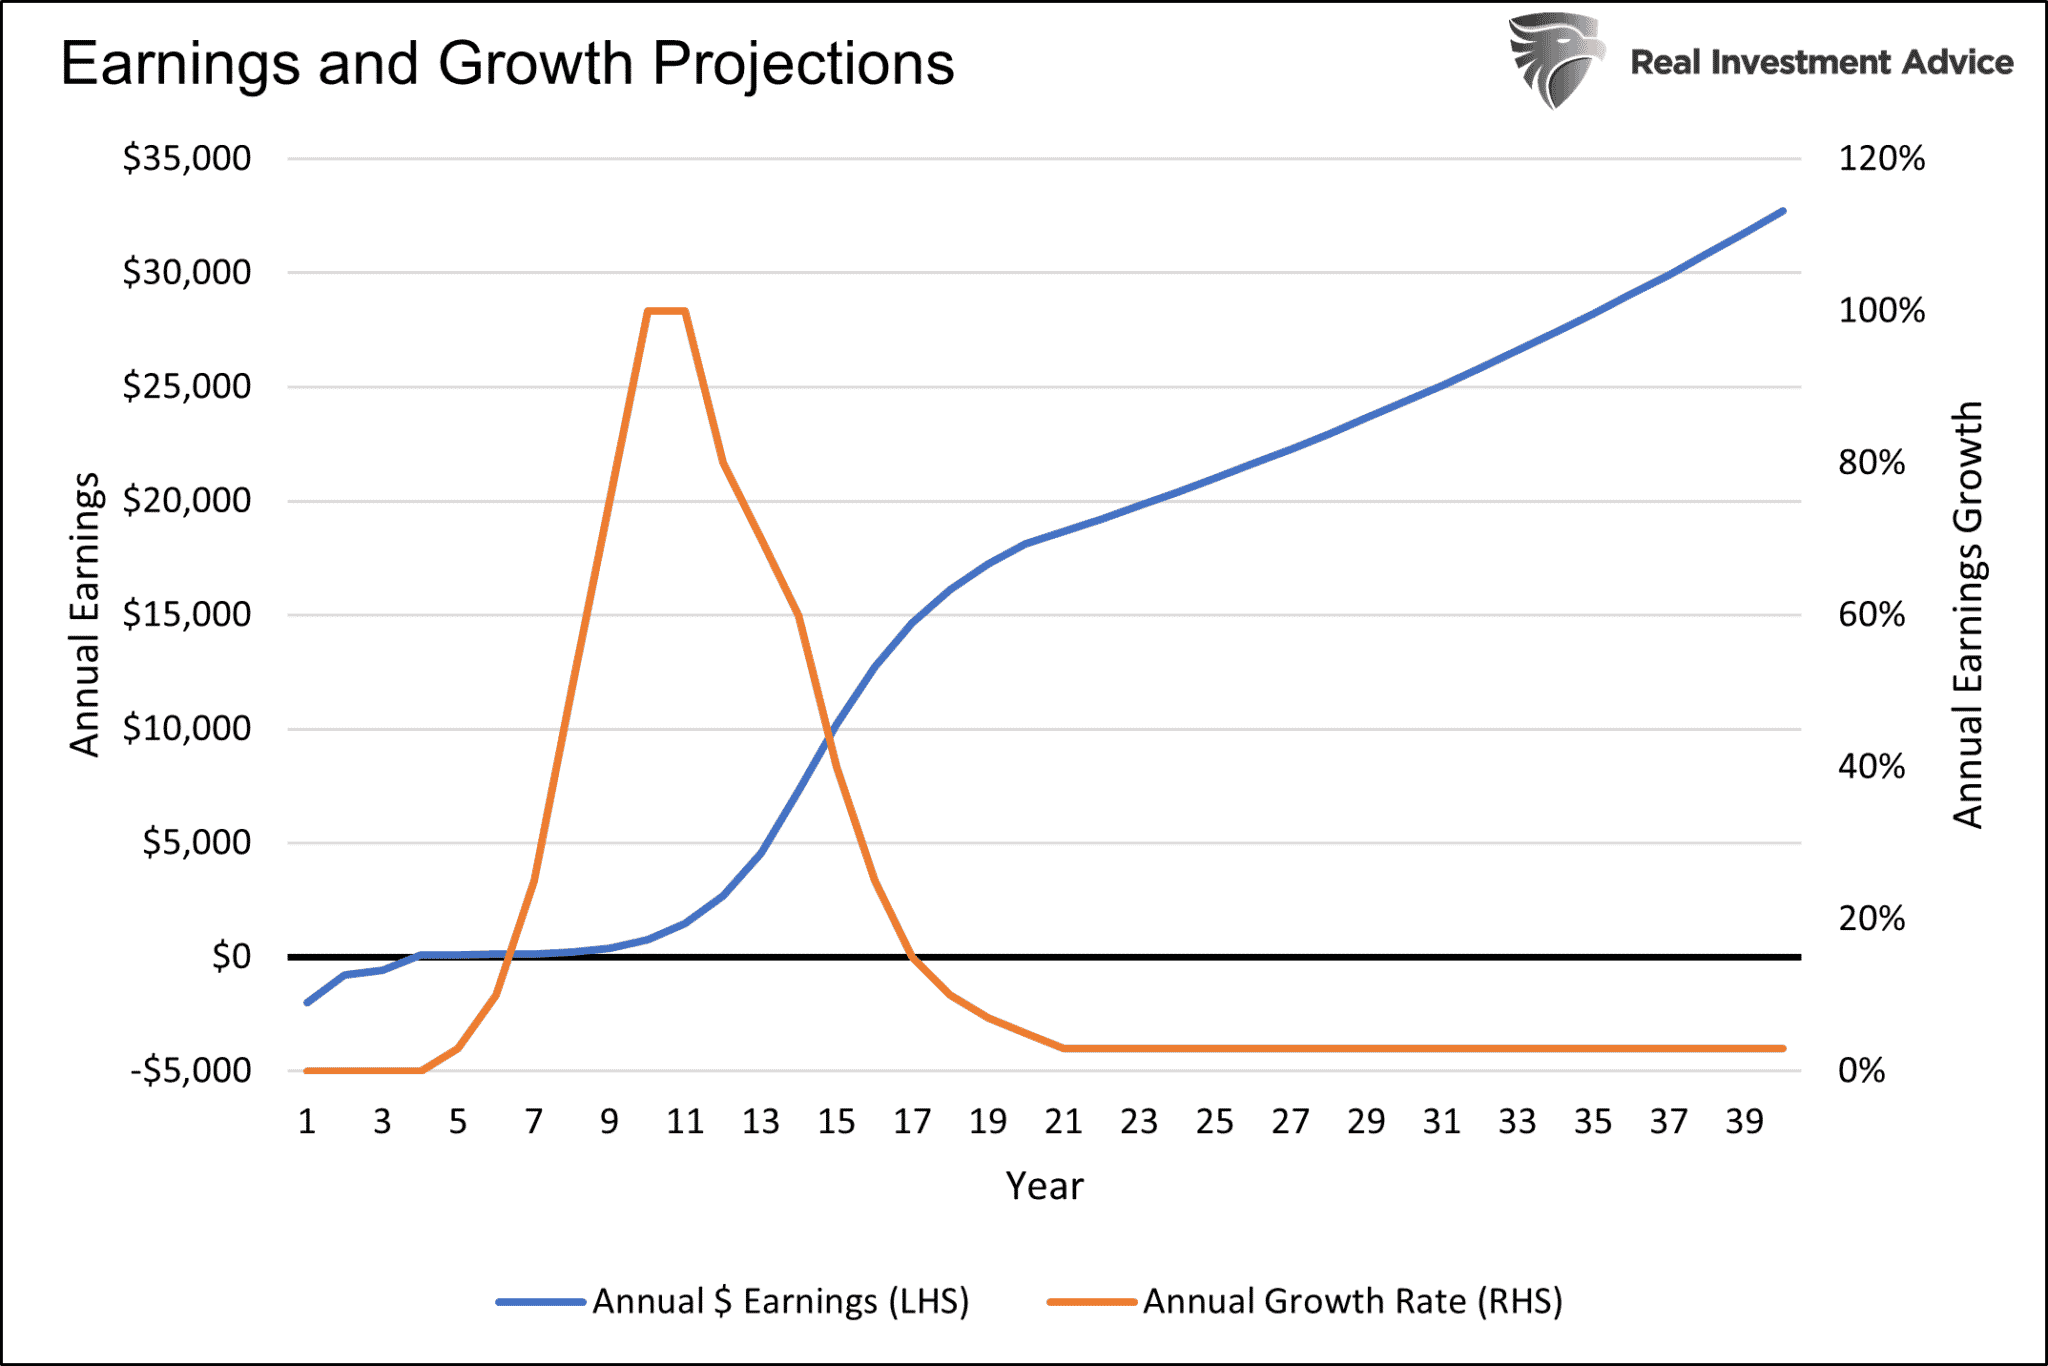
The discount rate is derived from market interest rates or rates of return of comparable investment options. To emphasize the importance of the discount rate in determining the present value, we create hypothetical cash flows. As we show below, our company loses money in first three years but grows substantially until year 11. At that point, growth is strong, but it begins to moderate. By year 21, the company has met significant competition, and growth rates flatline with overall economic growth rates.
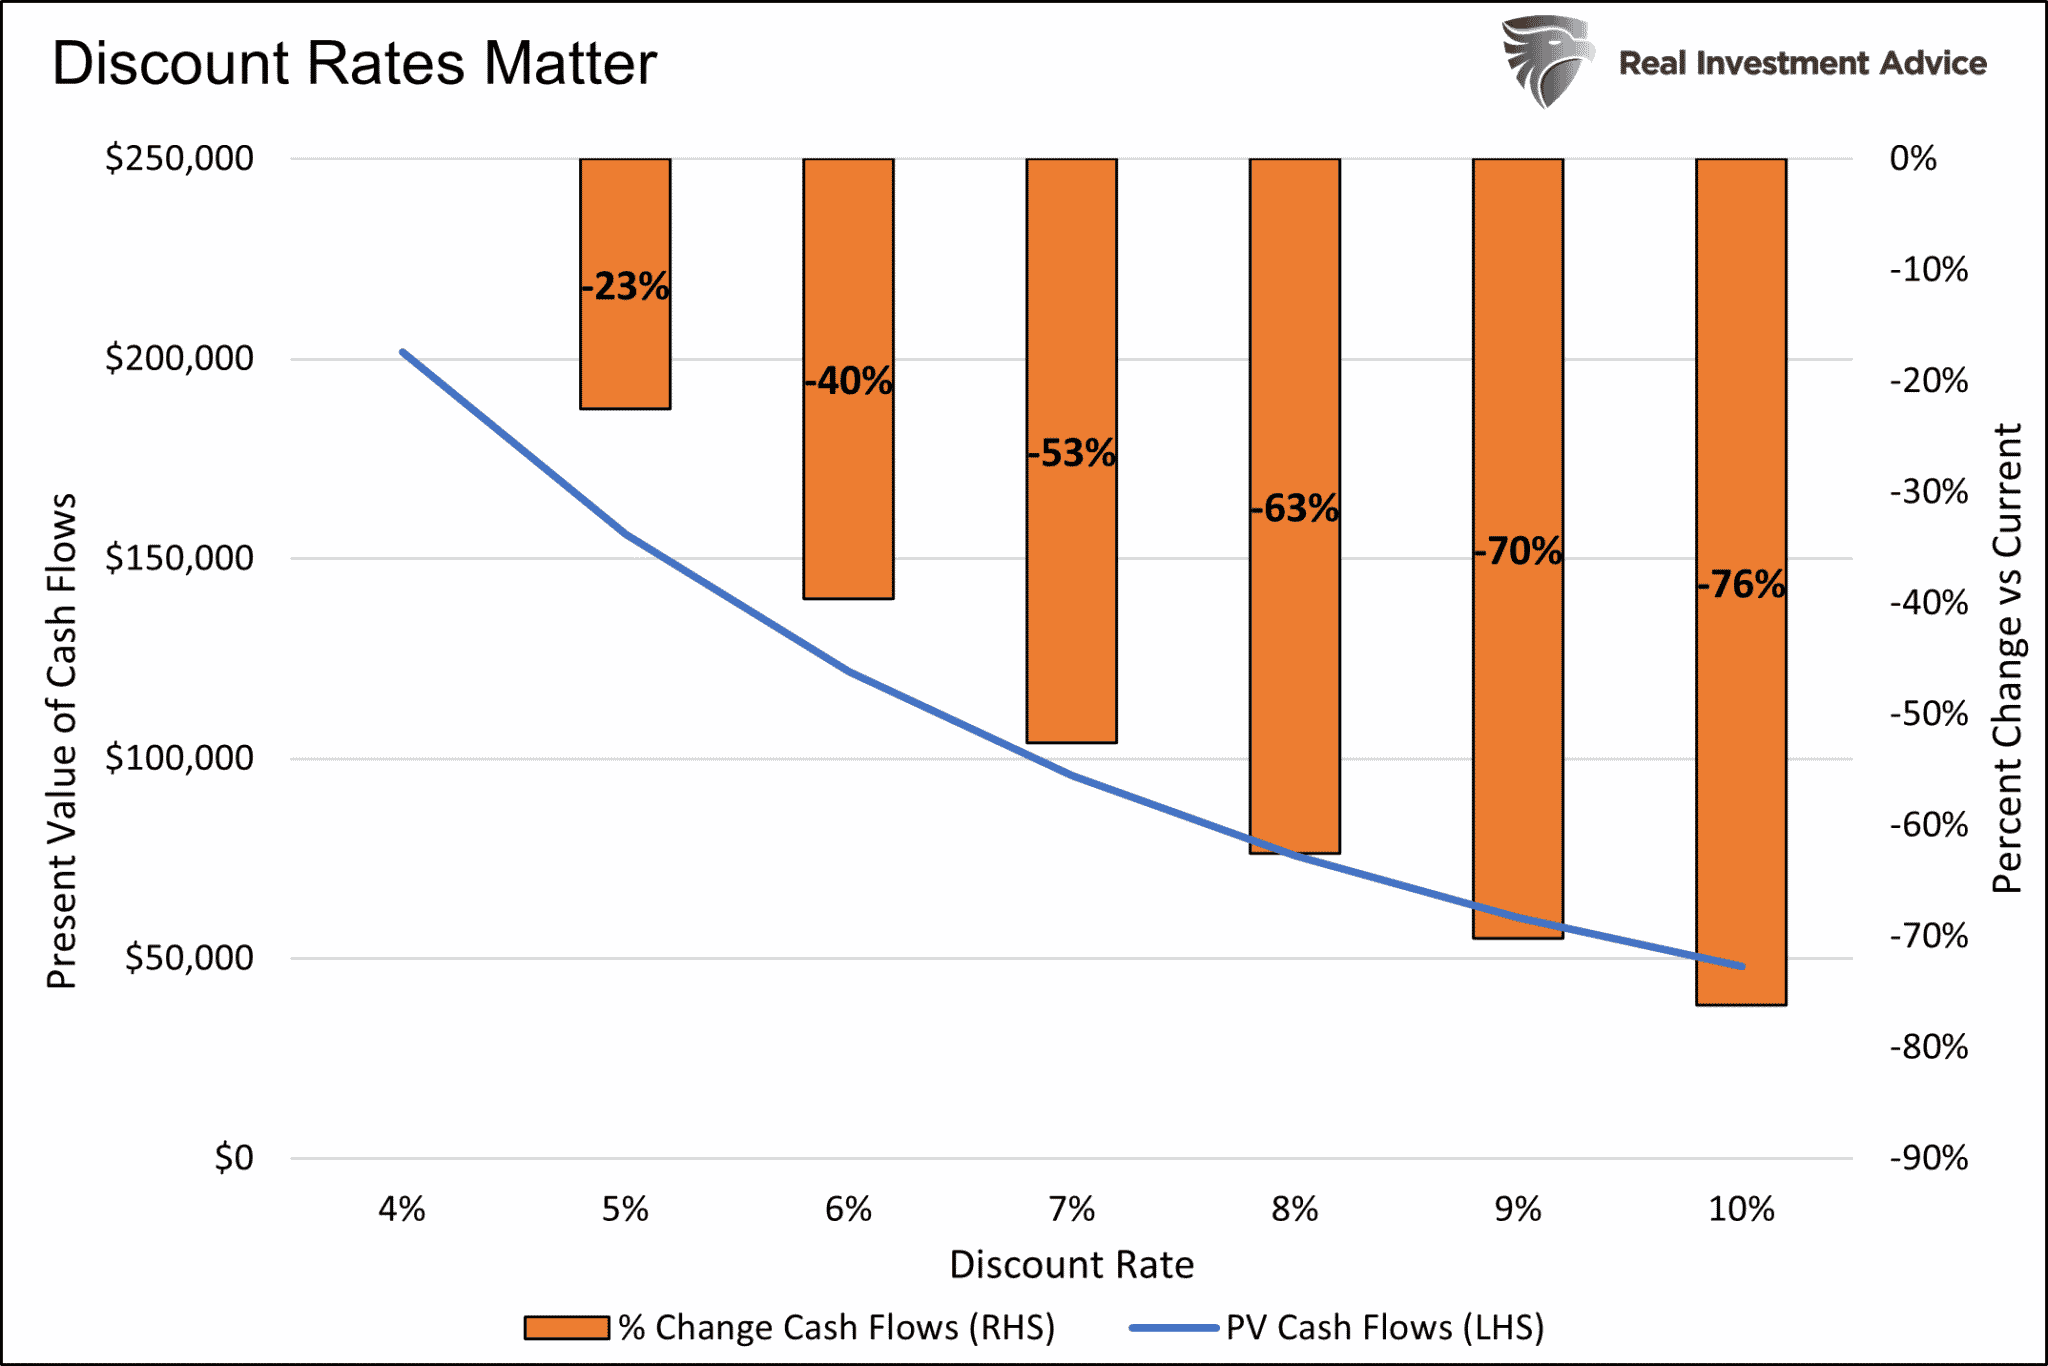
The following graph shows how the present value of those expected cash flows fluctuate as interest rates change. In our example, an increase in the discount rate from 4% to 5% reduces the present value of the cash flows by 23%.
To appreciate how the recent surge in interest rates affects the discounting process, consider that in just the first six months of 2022, the ten-year UST yield has risen by 1.5%. Present value discount rates likely rose by an equal or greater amount. Any wonder why high growth stocks led the market lower in the first half of the year?
Side Point on Growth Companies
As an aside, earnings streams for different companies can widely vary. Apple, for example, is a mature growth company with relatively weak earnings growth. Accordingly, it has less sensitivity to discount rates than our hypothetical company. On the other hand, many disruptive technology companies with high growth potential, like those held in ARK’s Disruptive Technology ETF (ARKK) are very sensitive to changes in interest rates.

Cyclical Stocks and Economic Activity
Unlike high-growth companies, which depend on discount rates and product-specific growth forecasts, cyclical stocks tend to fluctuate with economic activity and recent earnings trends.
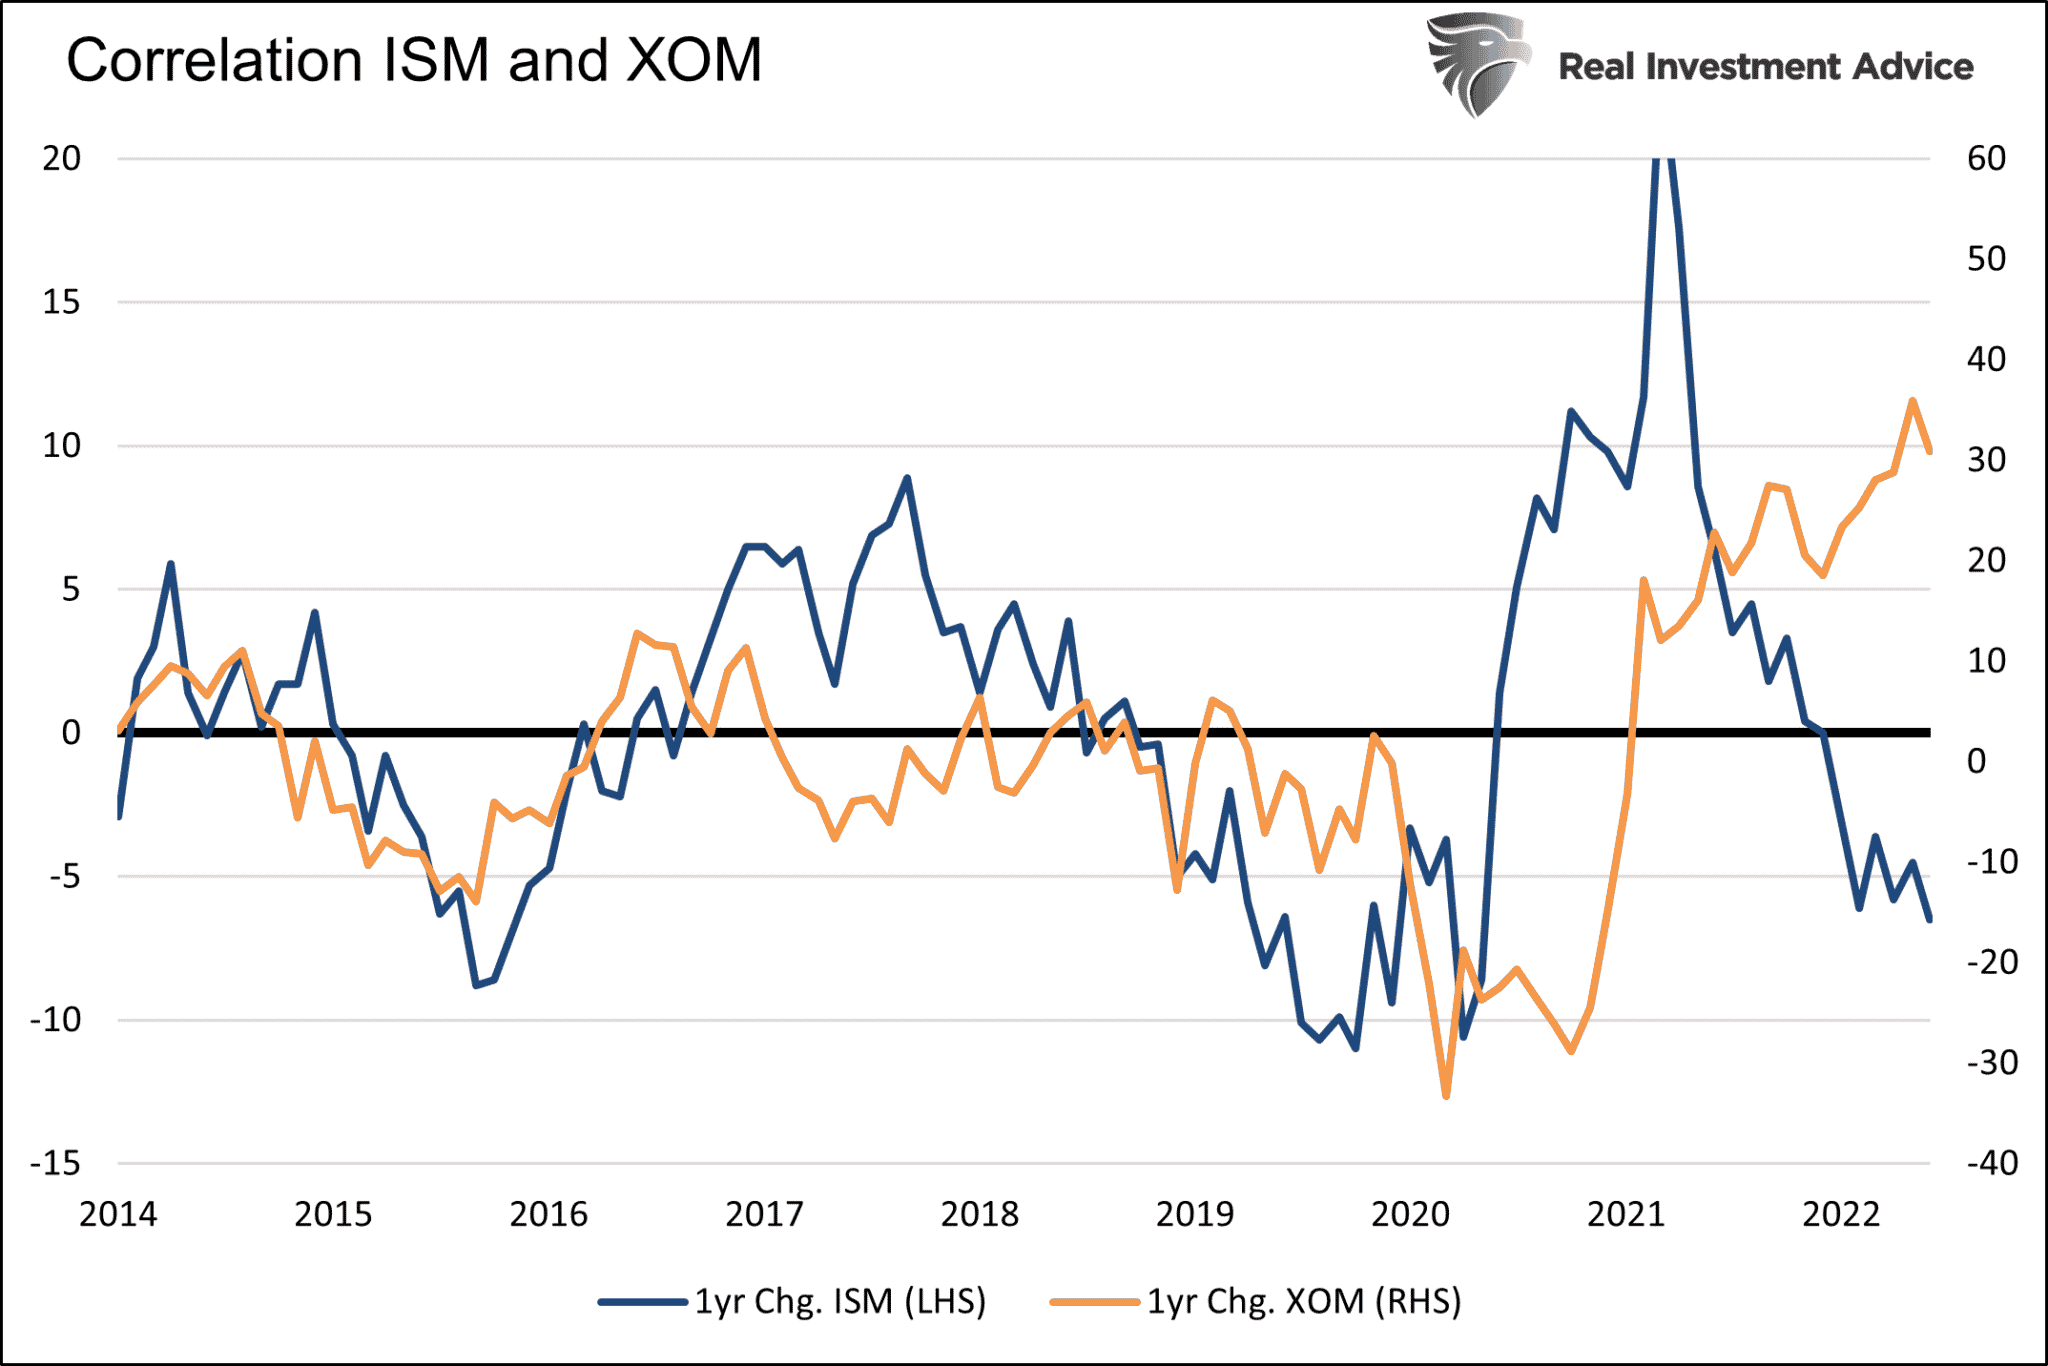
As a simple example, Exxon shares often correlate with oil prices. Like most goods, the cost of oil is a function of its supply and demand. Oil demand tends to fluctuate with the ebbs and flows of economic activity. The supply side of the equation also changes, but over more extended periods. Further, those changes are often predictable. The obvious caveat is one-off events like the last two years. Given the supply/demand construct, the demand for oil, thus economic activity, is the primary factor driving Exxon’s stock.
The chart below shows the correlation between the ISM Manufacturing Index and Exxon. ISM has an excellent track record of paralleling economic activity.
While each company is unique, many broad-based sector mutual funds and ETFs tend to have more concentrated growth or cyclical tendencies. In this vein, we can imply investor views on the economy and interest rates.

Shift From Inflation Fears to Recession Fears
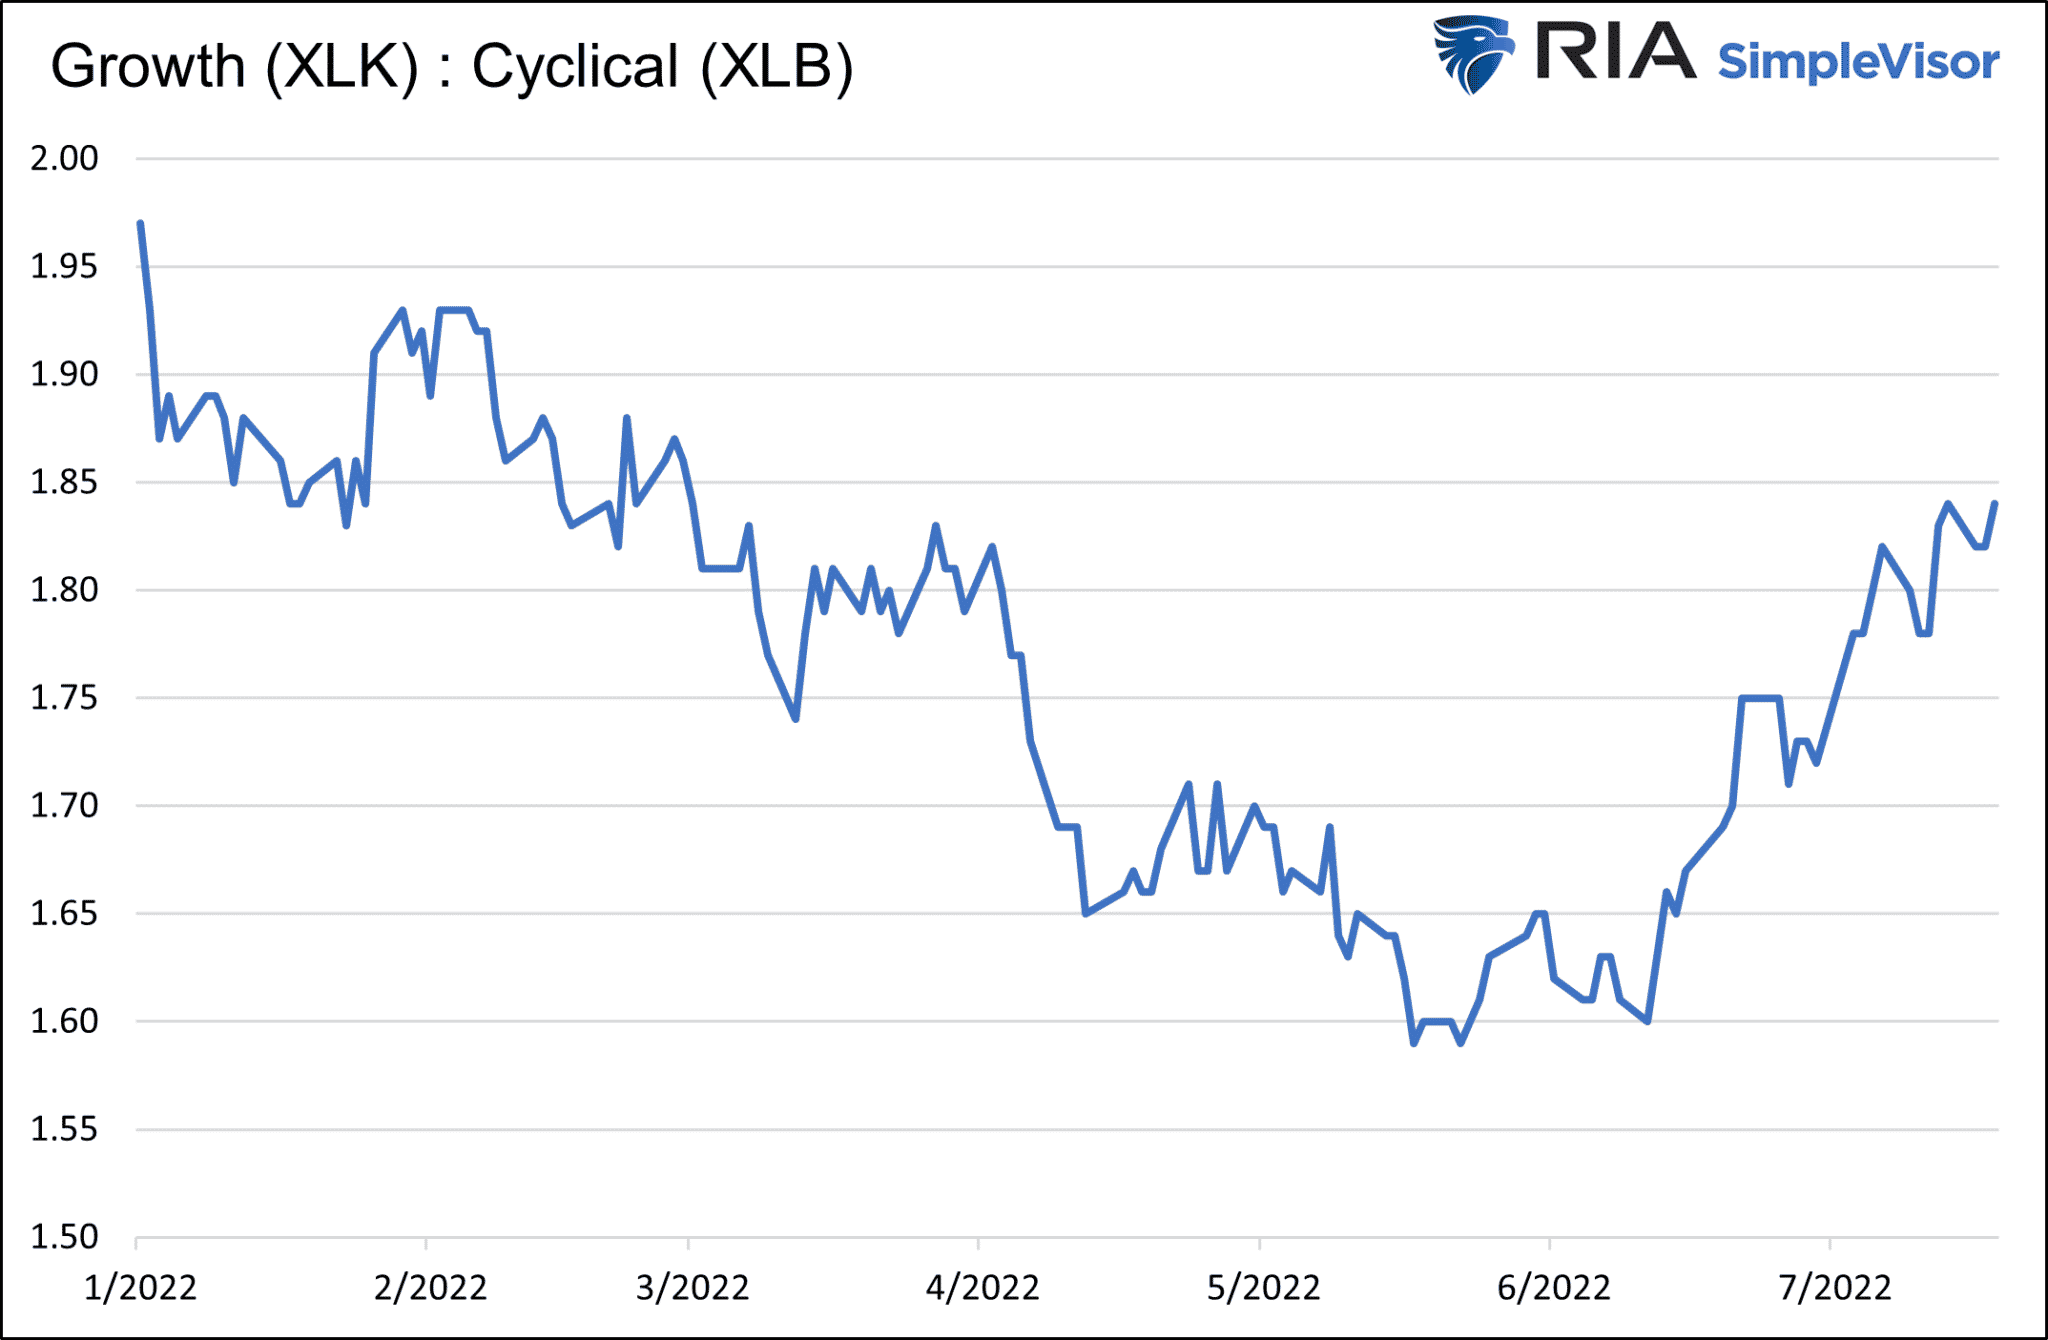
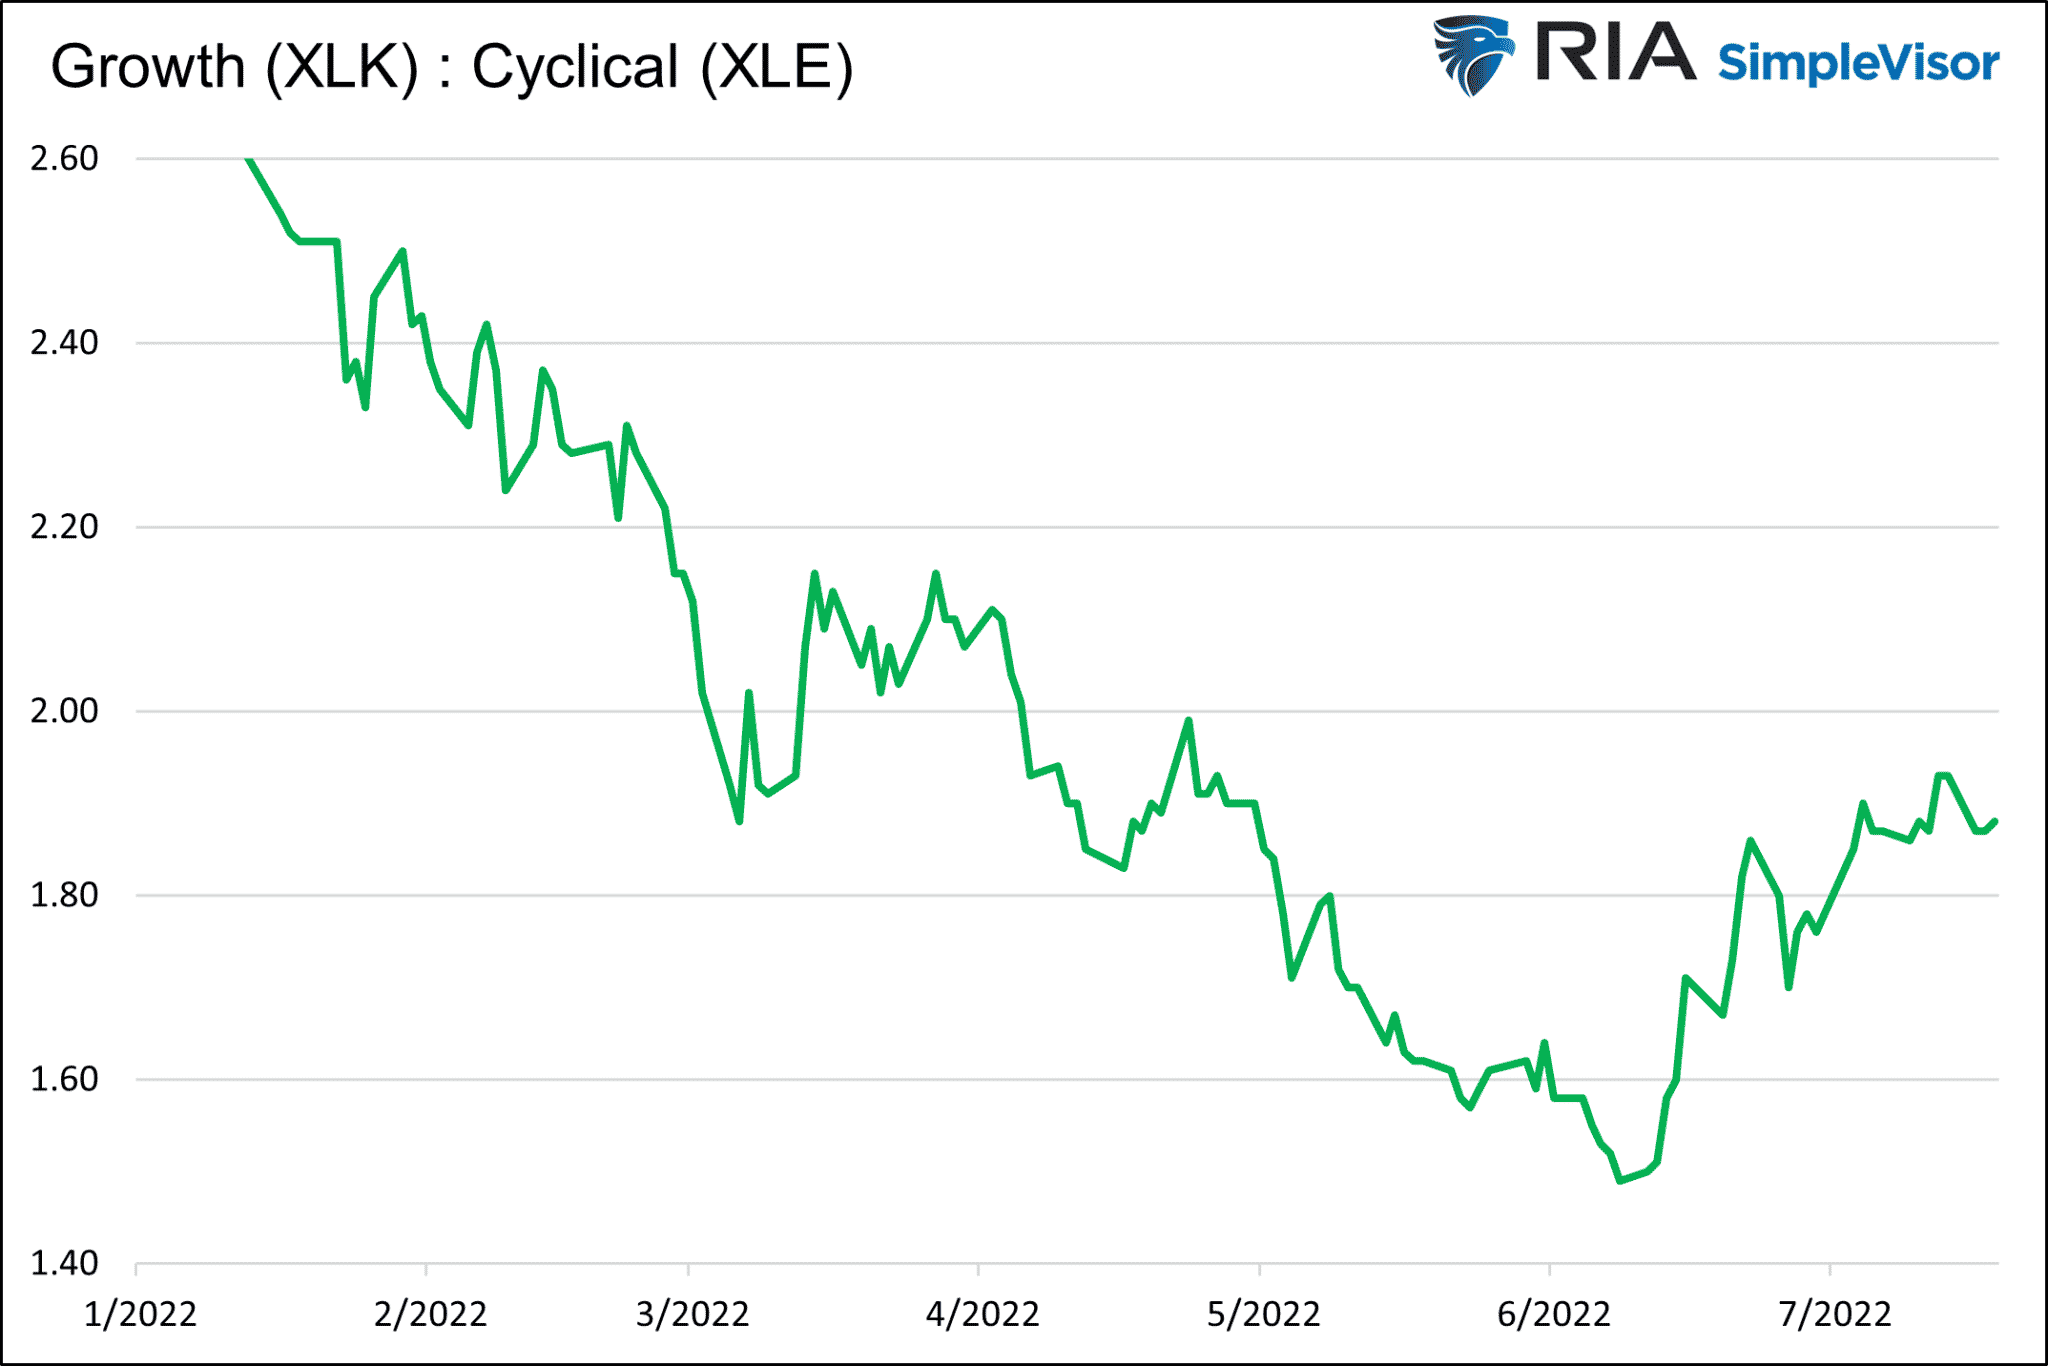
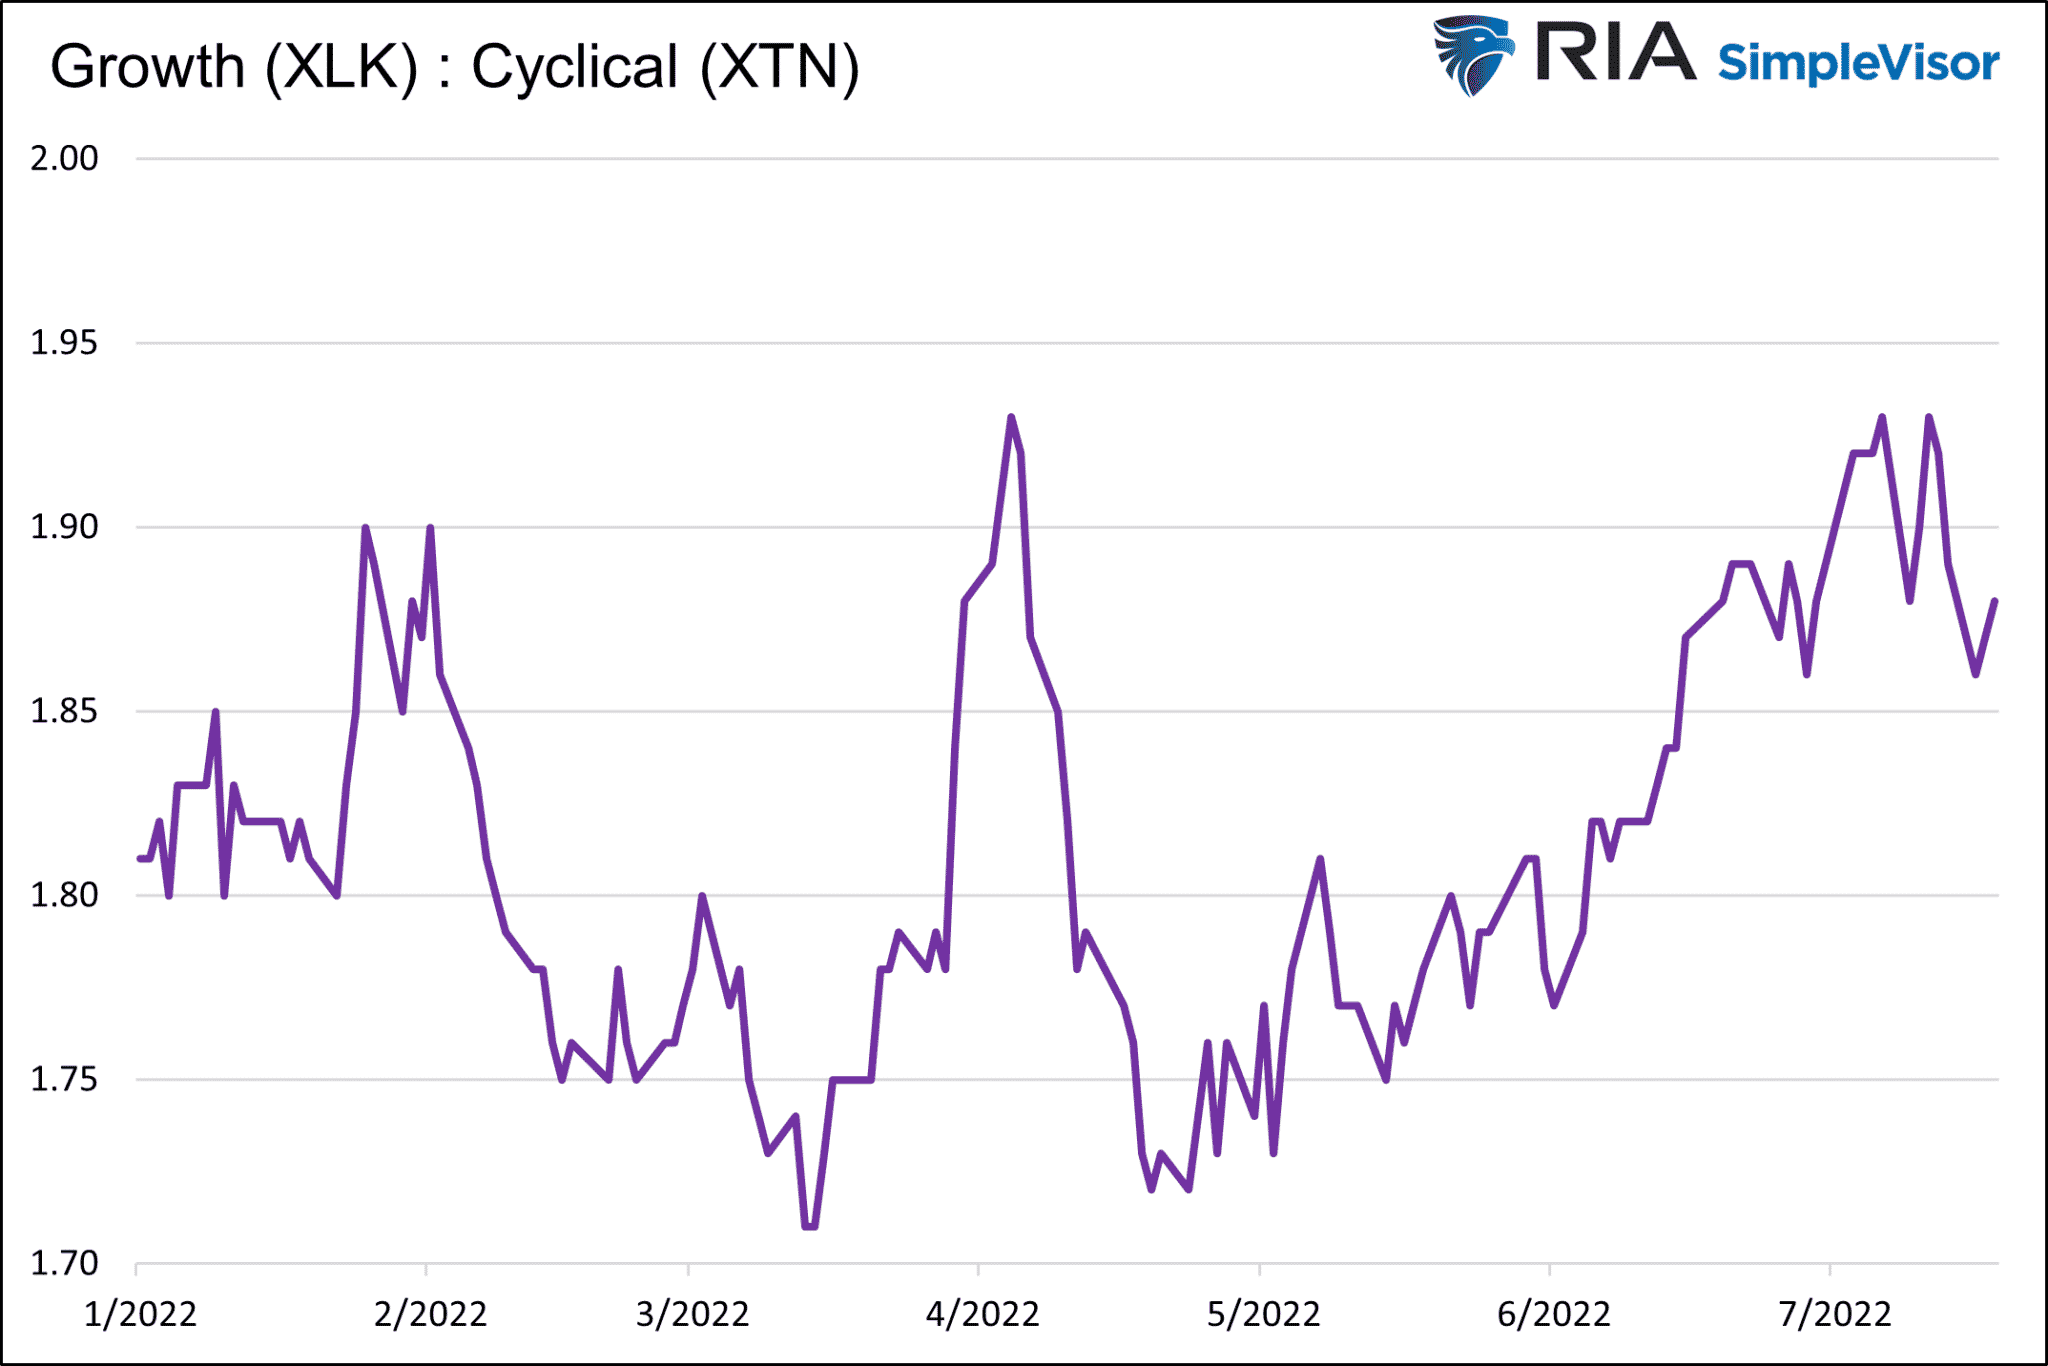
The graphs below compare the technology sector (XLK) representing growth stocks to four cyclical sectors, materials (XLB), industrials (XLI), energy (XLE), and transportation (XTN). While each graph is a little different, they show a downward trend from January into May as cyclical stocks outperformed technology stocks. Starting later in May or early June, technology began to outperform.
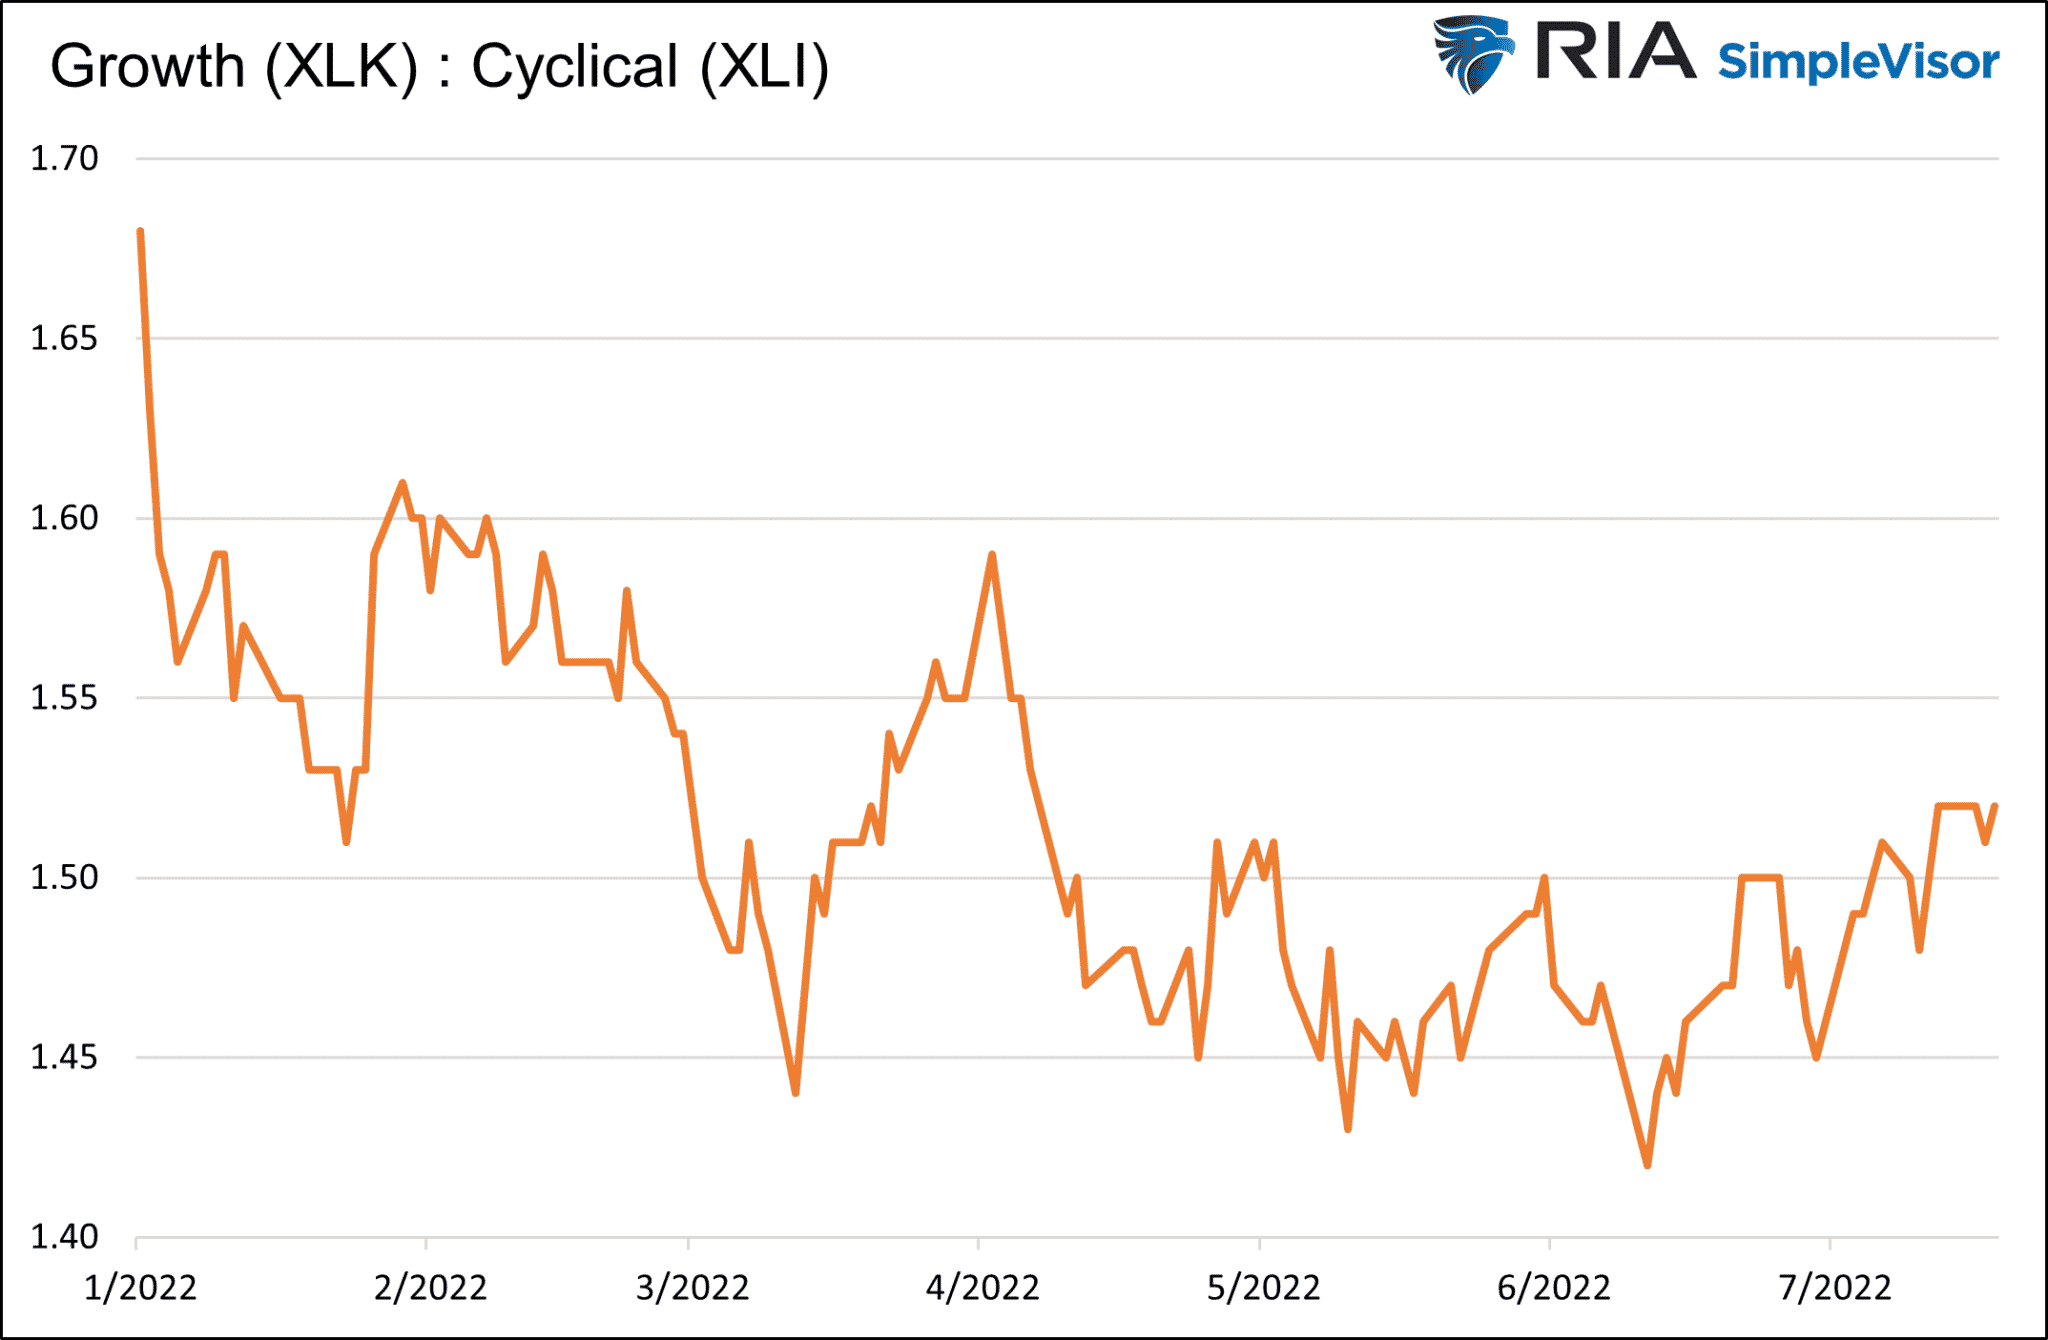
The Fed’s aggressive action and hawkish tone on May 4th combined with even stronger anti-inflation language in the following weeks, appear to have persuaded investors the Fed will tame inflation.
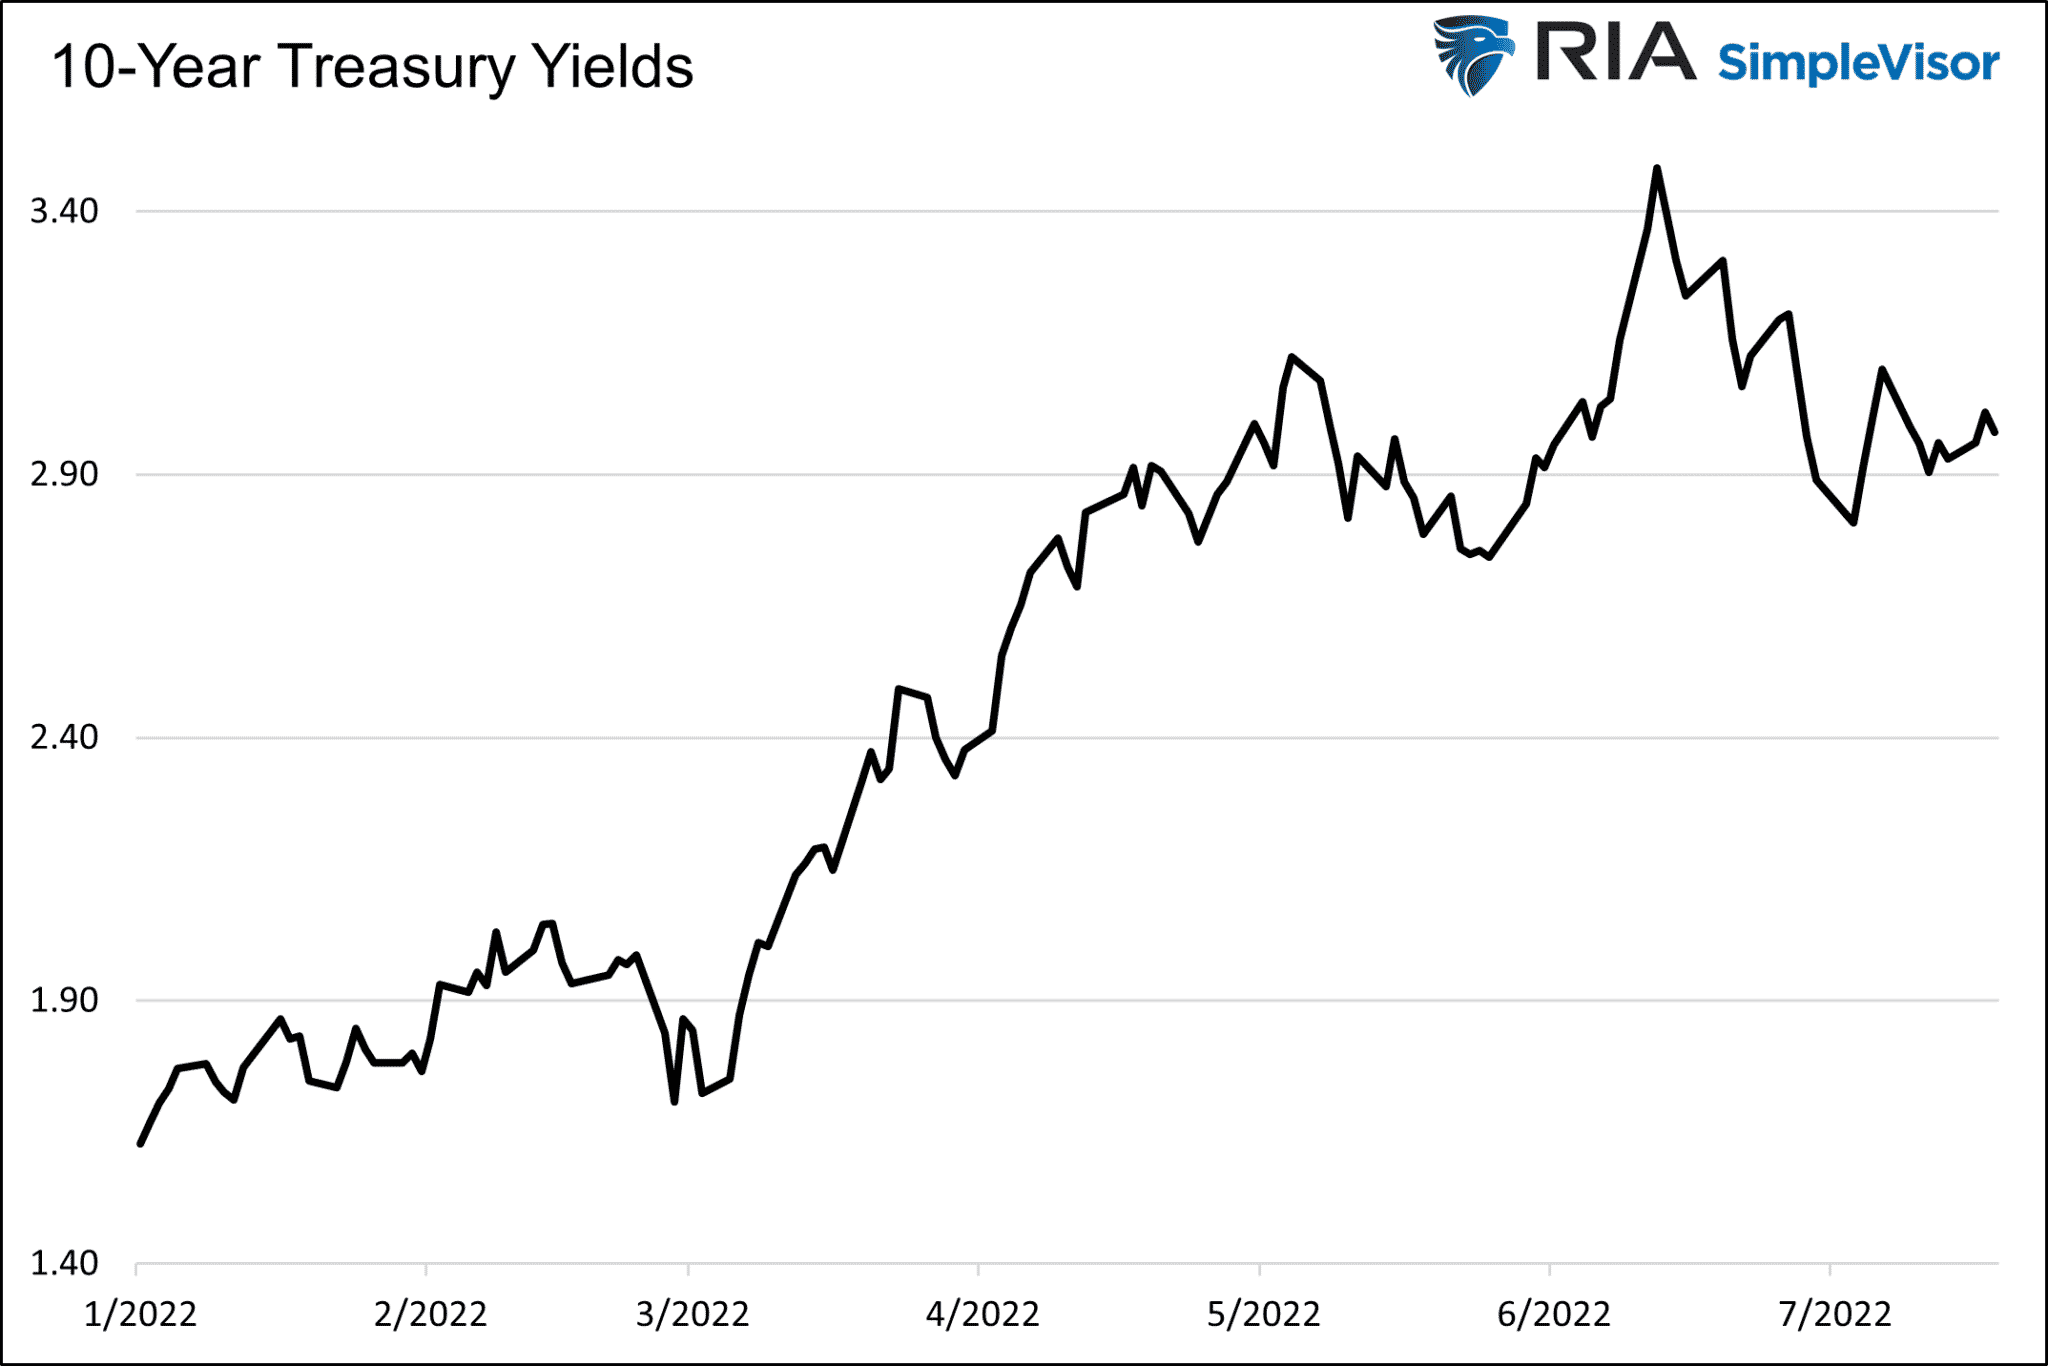
Bond investors are also finding solace in the Fed’s aggression toward inflation. As we share below, the yield on the 10-year Treasury Note may have peaked in mid-June. It has since fallen by half a percent.
Inflation Fears Out- Recession Fears In
Based on the graphs above, investors seem to be getting more comfortable the Fed will do its job and relinquish high inflation rates. At the same time, the market appears to be getting less comfortable with the consequences. Recession fears are on the rise.
Per Fortune:
On Tuesday, Bloomberg Economics attempted to provide some insight, announcing that the chance that a recession will occur sometime in the next 12 months is 38%, according to its economic model. That probability is up from 0% several months ago.

Why Investors Should Care
The shift of concern from inflation to the economy is essential to grasp. Assuming inflation does moderate, economic activity worsens, and the Fed maintains its fight against inflation, long-term bond yields should continue to decline. At the same time, interest rate-sensitive companies, like many growth stocks, may outperform cyclical companies that will fall victim to slowing economic activity.
Value stocks outperformed most other sectors in the first half. Technology and high growth may take the crown for the second half.
Summary
We are laser-focused on the tradeoff between inflation and recession. If the Fed’s resolve to fight inflation stays high and they continue to accept the economic cost of their actions, we will rotate to sectors and stocks that benefit from lower interest rates. Increasing bond exposure will also be appropriate.
The market will test the Fed’s resolve to fight inflation. If they flinch and investors think a stall or pivot is in the cards, cyclical stocks will likely outperform growth. Conversely, if they maintain their current determination, growth and technology will likely outperform.
Investors paying attention to the Fed and the market’s take on the Fed will be best situated to withstand what could be a volatile second half of the year.

