It’s Russia’s fault, cries the media. Others put the blame for recent stock declines at the feet of the Federal Reserve. Some fault Biden, the dollar, and OPEC. The financial media likes to have definitive explanations for every market gyration. We venture that in their current quest to explain this bear market, few media professionals realize that a simple Finance 101 formula accounts for about 90% of recent stock market losses. On the other hand, maybe they just don’t care. Biden, Russia, and OPEC garner many more viewers and advertising dollars than finance 101 basics.
This article explores finance’s discounted cash flow model (DCF) and the discount rate embedded within the formula. The DCF model provides critical insight into how interest rates affect stock prices. With an appreciation for how the recent surge in yields impacted stock prices, we can focus on the future path of interest rates and earnings to formulate a clearer picture of where stock prices may be heading. Accordingly, we use our knowledge to better assess how economic activity, inflation, and interest rates will drive stock prices.
Finance 101
Whether buying shares of Apple or a stake in a local grocery store, you are sacrificing current capital in exchange for future cash flows. Accordingly, our job as investors is to calculate a fair price for said cash flows. To do so, first, we need to forecast the cash flows. Then we need to calculate a present value for the cash flows using an appropriate discounting factor.
The discounted cash flow model (DCF), a staple in entry-level finance classes, allows us to formulate a present value of future cash flows. The following example helps us appreciate the model.
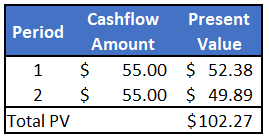
Someone approaches you with an opportunity to buy a $55 cash flow occurring this year and another $55 next year. How much would you pay?
The DCF model calculates how much money today, growing at the discount rate, equals the future cash flows. In our example below, we use a 5% discount rate to find the present value of the $55 cash flows. The sum of the present values of the two cash flows equals $102.27. If we aim to earn 5%, a price of $102.27 for the two cash flows is fair.

Variability in Discount Rates
We can use the same formula to help approximate how changing discount rates affect cash flow valuations. Keep in mind our example above was only two years. Valuing stocks entails much longer periods and with it, more variability based on changes to the discount rate.
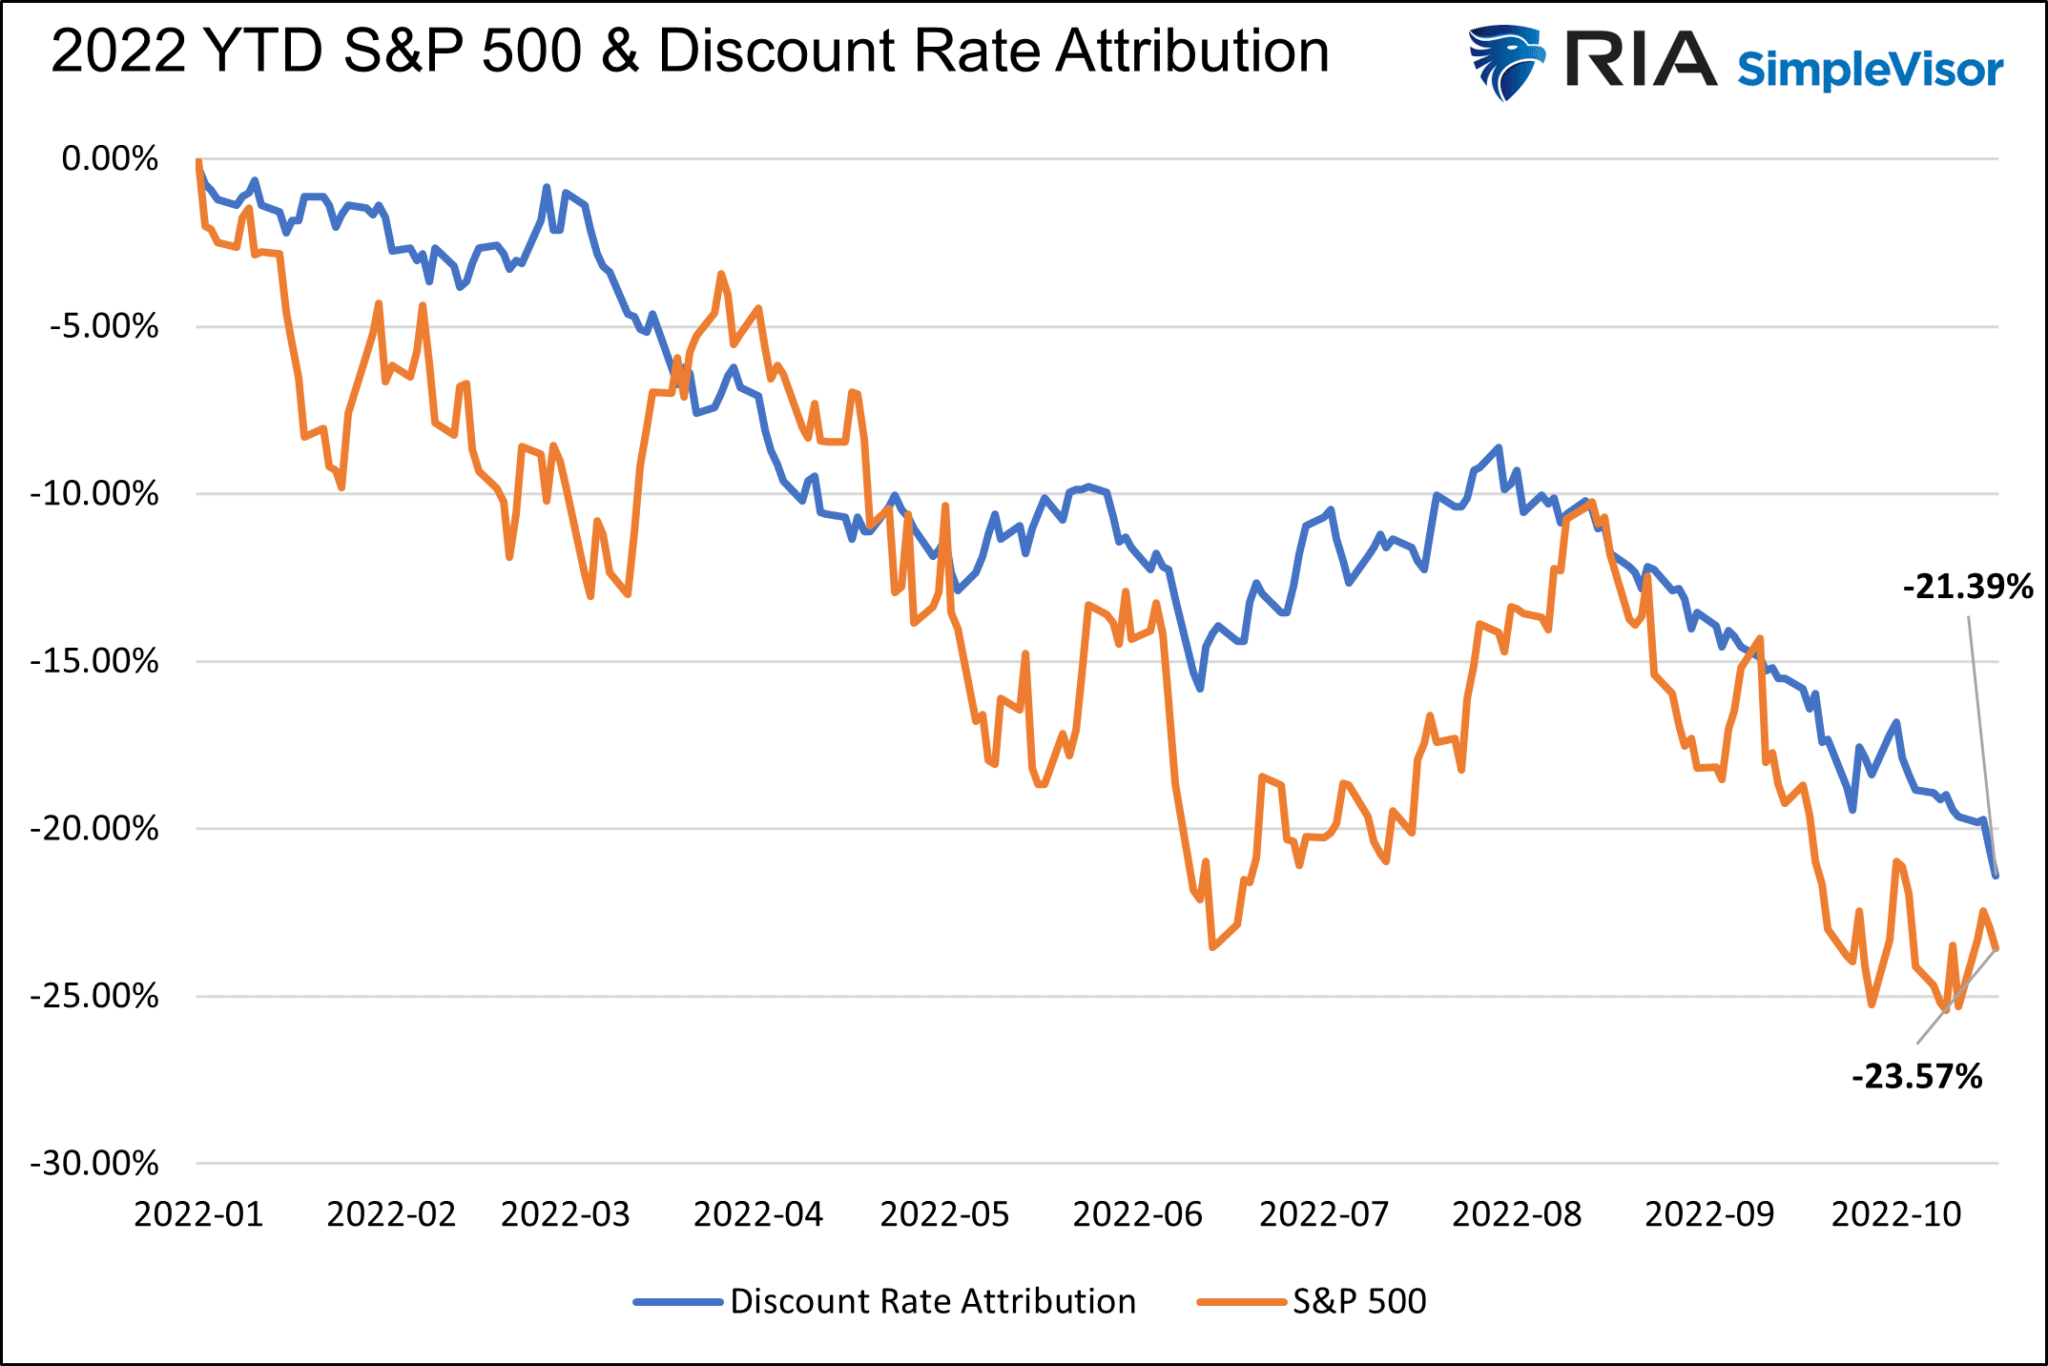
From January 1, 2022, through October, the ten-year U.S. Treasury yield has risen from 1.63% to 4.05%. Over the same period, the S&P 500 has fallen from 4,796 to 3,856. Coincidence? We share the graph below to help answer our question. It charts the S&P 500 and the running present value of a $100 cash flow expected ten years from each date on the x-axis. The discount rate to formulate the blue line equals the appropriate ten-year Treasury yield plus a constant 5.5% risk premium. The graph shows that about 90% of the S&P 500 loss is attributable to higher interest rates. Therefore, assigning blame for the stock market declines is not too difficult.
Given that surging interest rates accounted for a good deal of the price decline, what impact did earnings changes have on the price?

Valuation Contraction
S&P 500 earnings per share were 197.87 in the fourth quarter of 2021. Current expectations peg them at 190.91 at the end of the third quarter. The price-to-earnings multiple started the year at 24.09 and currently sits at 18.78. The multiple contracted by over five. The question worth pondering is how much of the contraction is due to earnings.
If we take the current EPS and solve for price assuming price to earnings didn’t change this year, the result equals the S&P 500 price change related solely to the decline in EPS.
The slight $6.96 decline in EPS only accounts for about 3.5% of the 20+% change in the S&P 500.
A large majority of the market decline is due to interest rates, and a marginal percentage is because of earnings.
What’s Next?
Understanding how interest rates (discount rates) and earnings influenced stock prices this year, we can now consider how they may change in the future to better form expectations.
Let’s start with earnings per share. Higher interest rates and the Fed’s QT program will likely result in a recession and weaker earnings.
The graph below shows the Fed’s favorite yield curve indicator of recessions, the 3-month/ 10-year yield curve, is negative. Typically, a recession doesn’t start until the yield curve troughs and then turns positive. From the trough in the yield curve, which likely hasn’t happened yet, to the start of a recession, it can take three months to over a year based on the prior four recessions.

Recessions and Earnings
How much may EPS decline if we enter a recession?
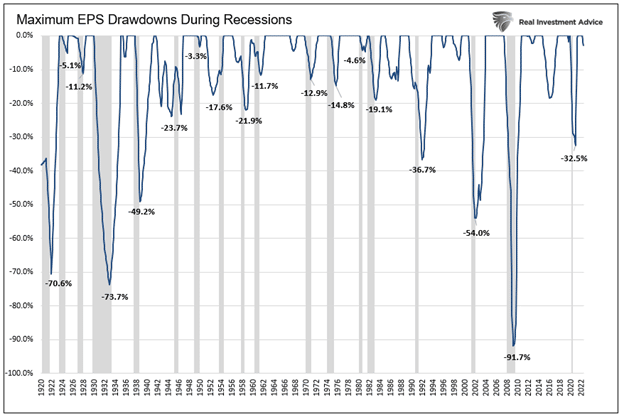
Since 1920 there have been 18 recessions. On average, EPS falls by 30.8% from its peak. The median decline is 20.5%, and the average of the last four is 53.7%.
The current P/E is close to the average of the last ten years. Assuming the P/E doesn’t decline further and conservatively assuming earnings fall by the median of 20.5%, we should expect another 20% decline in stock prices.
A more bearish scenario arises if we assume the P/E declines to 15 and earnings fall by 30.8%. In such a case, the S&P could dip as low as 1,981. An even worst-case scenario using single-digit P/E ratios and a 50+% drawdown in EPS would result in a dire outlook.
There is some good news to temper the bearish outlook. Interest rates will likely fall appreciably in a recession. Accordingly, a declining discount rate factor increases the present value of expected cash flows. If rates fall back to where they were at the start of the year, a positive 20% contribution to share prices is expected.
There are bullish scenarios in which the economy remains stable and earnings flat. At the same time, inflation normalizes, and interest rates fall. Such a scenario likely means a bottom in stock prices is very near if it hasn’t been reached already.

Summary
Value isn’t measured by the extent that prices have declined, but by the relationship between prices and properly discounted cash flows. – John Hussman
Higher interest rates have taken a toll on stock prices. The rate increases thus far will inevitably hamper economic activity and inflation, ultimately resulting in lower discount rates. The bad news is that reduced economic activity will weigh on profits which can easily counter the benefits of falling interest rates.
We have outlined the two most significant factors (interest rates and EPS) likely to explain forward returns. Finance 101 formulas may not be sexy rationales like Biden, OPEC, or Putin, but you should focus on them.

