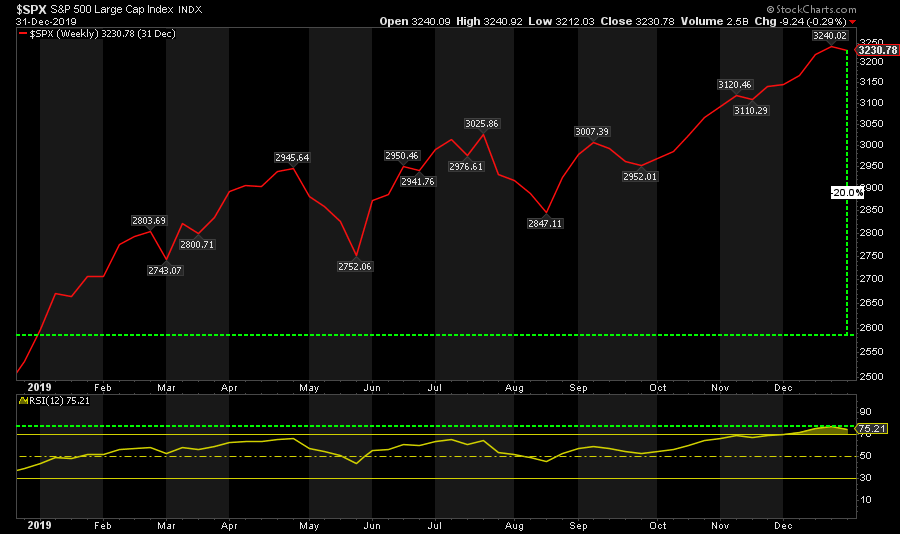
The bull market turned in an impressive gain of over 30% (on a total return basis) in 2019. While not a rarity in market history, it certainly falls into the “outlier” category. Not surprisingly, the media has been quick to jump on the story suggesting that if 2019 was strong, just wait until 2020. To wit:
“BTIG’s Julian Emanuel believes 2020 will be a milestone year. With the major indexes kicking off Christmas week at fresh all-time highs, he’s not ruling out a 22% surge in the S&P 500.
The reason: Most investors don’t trust the record rally.”
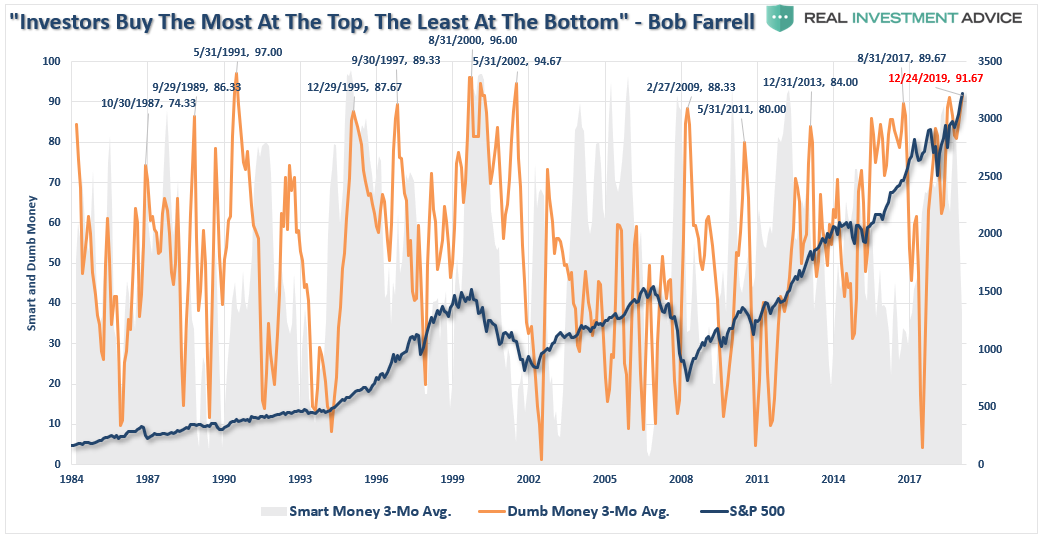
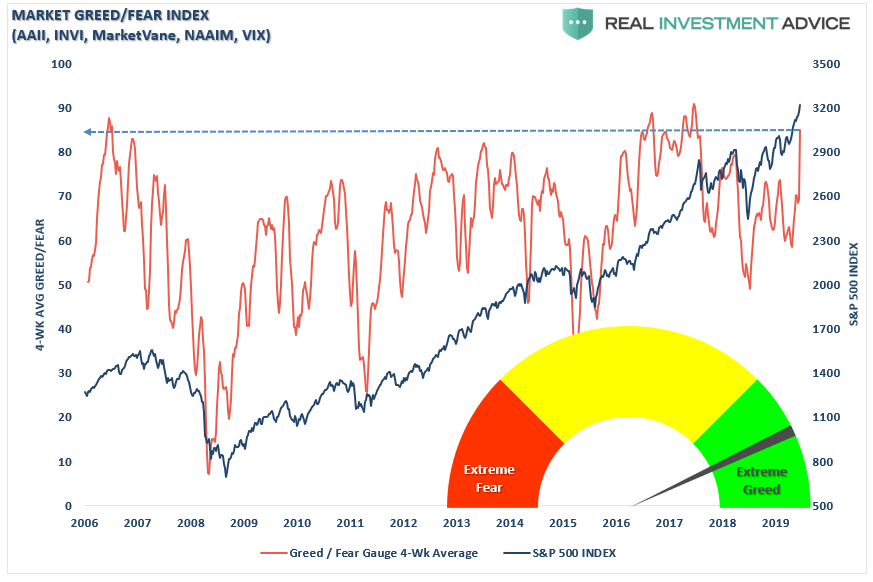
I am not sure such is the case judging by both our “Smart/Dumb Money” and “Investor Positioning Fear/Greed” indices.
One of the primary tenants of investing, other than “buy low and sell high,” is always analyzing BOTH sides of every argument to avoid confirmation bias. Therefore, while many are making the case for being invested in the market, we should at least question the possibility of what could go wrong?
With the S&P 500’s stellar gain for 2019, the case for raising some cash is comprised of three primary issues:
-
- The impact of reversions,
- Historical length of economic recoveries, and;
- Historical returns following years of 30% market returns.
The Impact Of Reversions
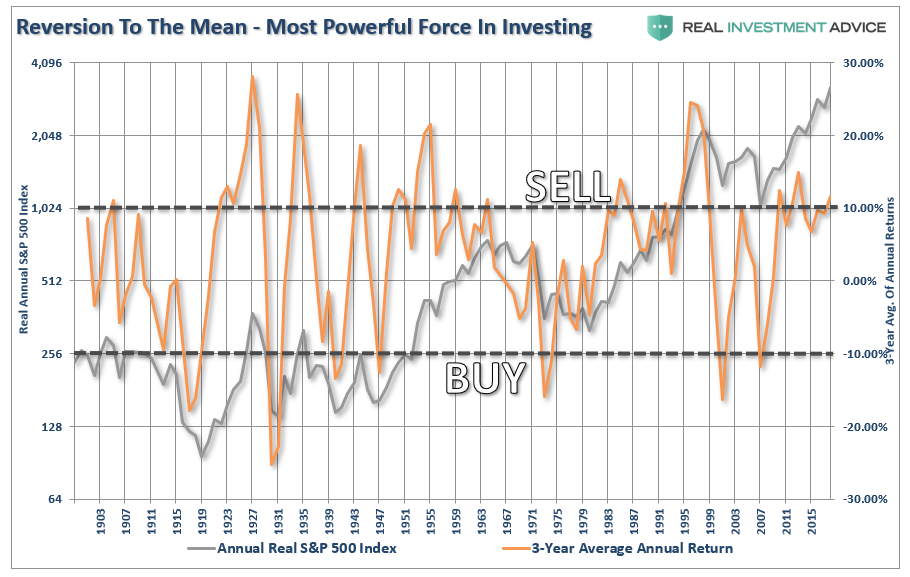
There have been numerous studies and discussions on the historical impact to returns due to “reversions to the mean.” However, the impact of reversions remains lost on most individuals as the emotion of “greed” overtakes rationality during strong market advances.
One of the biggest mistakes that individuals make when investing is “not doing the math.” Let’s assume that the S&P 500 is trading at 3000 (nice round number for easy math purposes). If the market advances 30% it would then be trading at 3900 (3000 x 1.3).
However, the “risk,” and inherently the reality for the majority of investors, is that individuals would not “sell out” of their portfolios at the next market peak and would suffer the next 20% decline.
“So what, I am still up 10%.”
That is where the flaw in “the math” comes in. A 20% decline, following a 30% advance, does not leave you holding a 10% gain. In reality, the 30% gain is reduced to just 4%, as the market reverts back to 2600.
In other words, if a 20% correction occurs at any point in the next year, your previous gain would be almost entirely wiped out, not to mention the emotional strain of the decline.
The impact of reversions are devastating to long term portfolio returns, particularly when individuals, as opposed to financial markets, have a finite period within which to save and invest before needing those savings for retirement.
Economic Recoveries & Subsequent Market Returns
However, the real issue is the market is unlikely to correct “just 20%.” The next major market correction will very likely coincide with the next economic recession. (Of course, by simply writing the “R” word, this article will be summarily dismissed by the ‘financial illuminati’ who continue to marvel at the day to day levitation of the market with the inherent belief ‘trees can grow to the sky'”). However, all economic recoveries will eventually contract. The chart below shows every post-recession economic recovery from 1879 to the present.
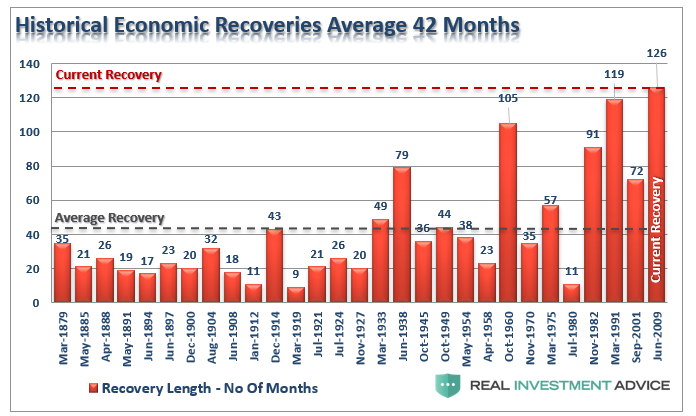
The statistics are quite interesting:
- Number of economic recoveries = 29
- Average number of months per recovery = 42
- Current economic recovery = 126 months
- Number of economic recoveries that lasted longer than current = 0
- Percentage of economic recoveries lasting 60 months or longer = 20.6%
Think about this for a moment. We are currently experiencing the longest economic recovery in history, with most analysts and economists giving no consideration for a recession in the near future. This is important because, as stated above, major market corrections occur during economic recessions, and those “reversions” tend to be much larger than 20%. The chart shows each of the past economic recoveries and the subsequent market correction during the inevitable contraction.

The statistics are equally interesting:
- Average number of months of contraction: 14
- Average market declines during all contractions: -29.13%
- Average market decline following top seven economic recoveries: -36%
With these statistics, it is somewhat easy to assess the risk/reward of remaining invested in the markets currently in hopes of further advances. If we assume that the markets reach our target of 3300 before the onset of the next economic contraction, the resulting decline, using the historical average of -36%, would push the markets back down to 2100ish.
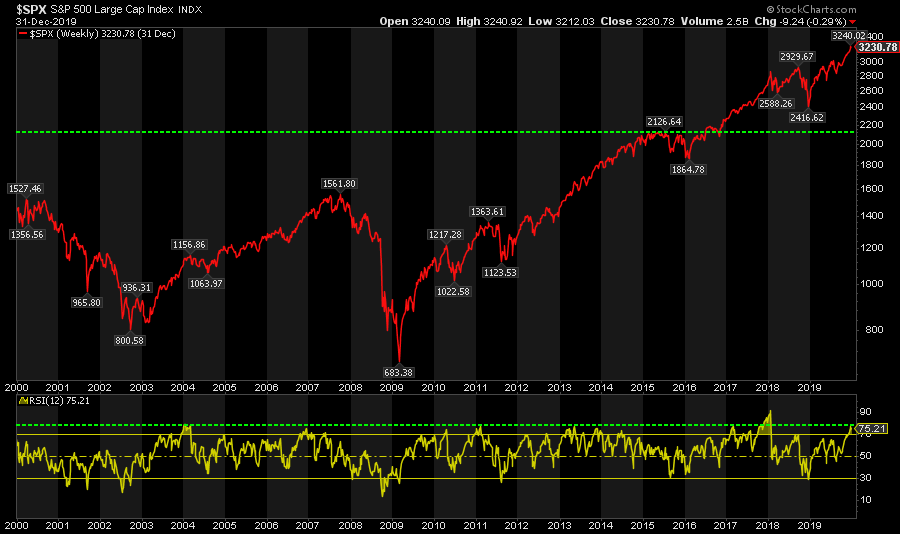
In other words, all your gains since 2015 would be wiped away.
30% Gains And Sideways Markets
The following chart shows the annual real returns (capital appreciation only) using monthly data for the S&P 500. The purple bars are years of gains 29% or greater. I then showed the subsequent years following that 30% gain and the P/E cycle (expansion or contraction) they were contained in.
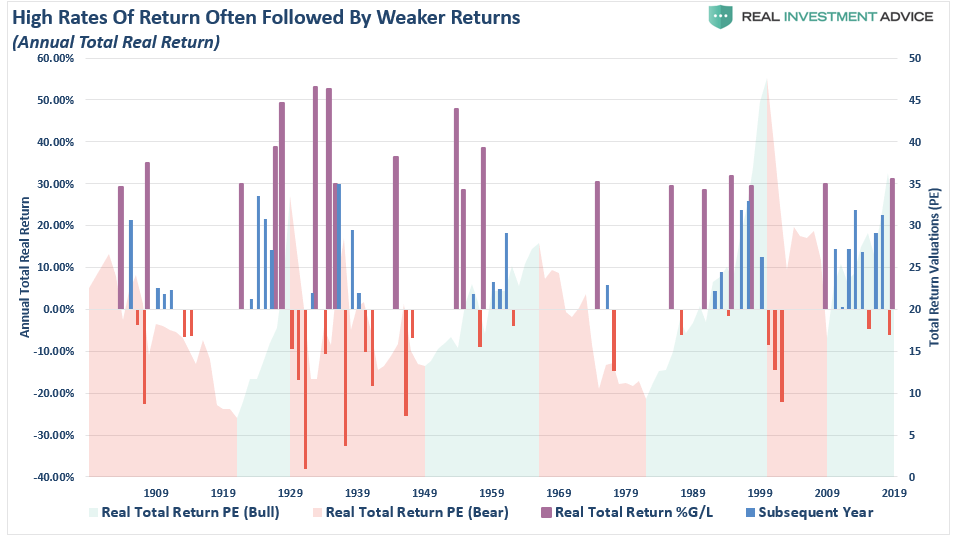
Here are the statistics:
- Number of years the market gained 29% or more: 19
- Average return of 19 markets: 35.65%
- Number of total subsequent years measured: 53
- Average return in subsequent years following a 30% year: 1.48%
What you should notice is that 29%+ return years tended to mark the beginning of a period of both declining rates of annualized returns and typically sideways markets. It is also essential to notice that some of the biggest negative annual returns eventually followed 30% up years.
While it is entirely possible that the markets could “melt up” another 20% from current levels due to the ongoing monetary interventions; history suggests that forward returns not only decline, but bad things have eventually happened.
Go To Cash Now?
I want to be clear that I am not advocating that anyone should go to cash today. The problem with this analysis, unfortunately, is while individuals are unlikely to sell at the top of the market; they are just as unlikely to buy at the bottom. History is replete with market booms and busts and the devastation of individuals along the way.
This is why chasing an all equity benchmark is inherently flawed. Benchmark indexes are riddled with issues that you can not replicate in your portfolio which I discussed in detail in “Active vs. Passive & The Simple Reasons You Can’t Beat An Index:”
The reason that individuals are plagued by these emotional behaviors is due to well-meaning articles espousing stock ownership at cyclical valuation peaks.
Sure, it is entirely possible the current cyclical bull market is not over yet.
Momentum driven markets are hard to kill in the latter stages, particularly as exuberance builds. However, they do eventually end. That is unless the Fed has truly figured out a way to repeal economic and business cycles altogether. As we enter into the next decade, we are likely closer to the next contraction than not. This is particularly the case as the Federal Reserve continues to build a bigger economic void in the future by pulling forward consumption through its monetary policies.
Will the market likely be higher in another decade from now? Maybe. However, if interest rates or inflation rise sharply, the economy moves through a normal recessionary cycle, or if Jack Bogle is right – then things could be much more disappointing. As Seth Klarman from Baupost Capital once stated:
“Can we say when it will end? No. Can we say that it will end? Yes. And when it ends and the trend reverses, here is what we can say for sure. Few will be ready. Few will be prepared.”
We saw much of the same mainstream analysis at the peak of the markets in 1999, and again in 2007. New valuation metrics, IPO’s of negligible companies, valuation dismissals as “this time was different,” and a building exuberance were all common themes. Unfortunately, the outcomes were always the same.
“History repeats itself all the time on Wall Street” – Edwin Lefevre

