
Part One of this series highlights how the government’s fixation with full employment and the Fed’s belief in the faulty Phillips Curve model from 1965 to 1982 fueled multiple bouts of inflation. We also touched on that fateful day in 1971 when President Nixon removed the fiscal and monetary shackles, essentially giving the government and the Fed more power to alter the economy and stoke inflation.
We start Part Two with more on the Fed and the nation’s money supply in that era. While the Fed and government played a significant role in generating inflation fifty years ago, there were other factors.
Lastly, the Fed may have started and strengthened the inflation fire, but the same Fed under Paul Volcker also helped extinguish it. We will examine the change in mindset at the Fed in the mid- to late 1970s.
To repeat ourselves from Part One, inflation is a critical component in assessing future stock and bond performance. To better evaluate the odds that high inflation creeps up again, as it did in the 70s, we must understand what happened then and appreciate the similarities and differences from today.

More On the Fed and Milton Friedman
As we did in Part One, we let the Fed summarize its errors during the Authur Burns era at the Fed (1970-1978). The following section from The Burns Disinflation of 1974, was written by Thomas Lubik, Christian Matthes, and Tim Sablik of the Richmond Fed.
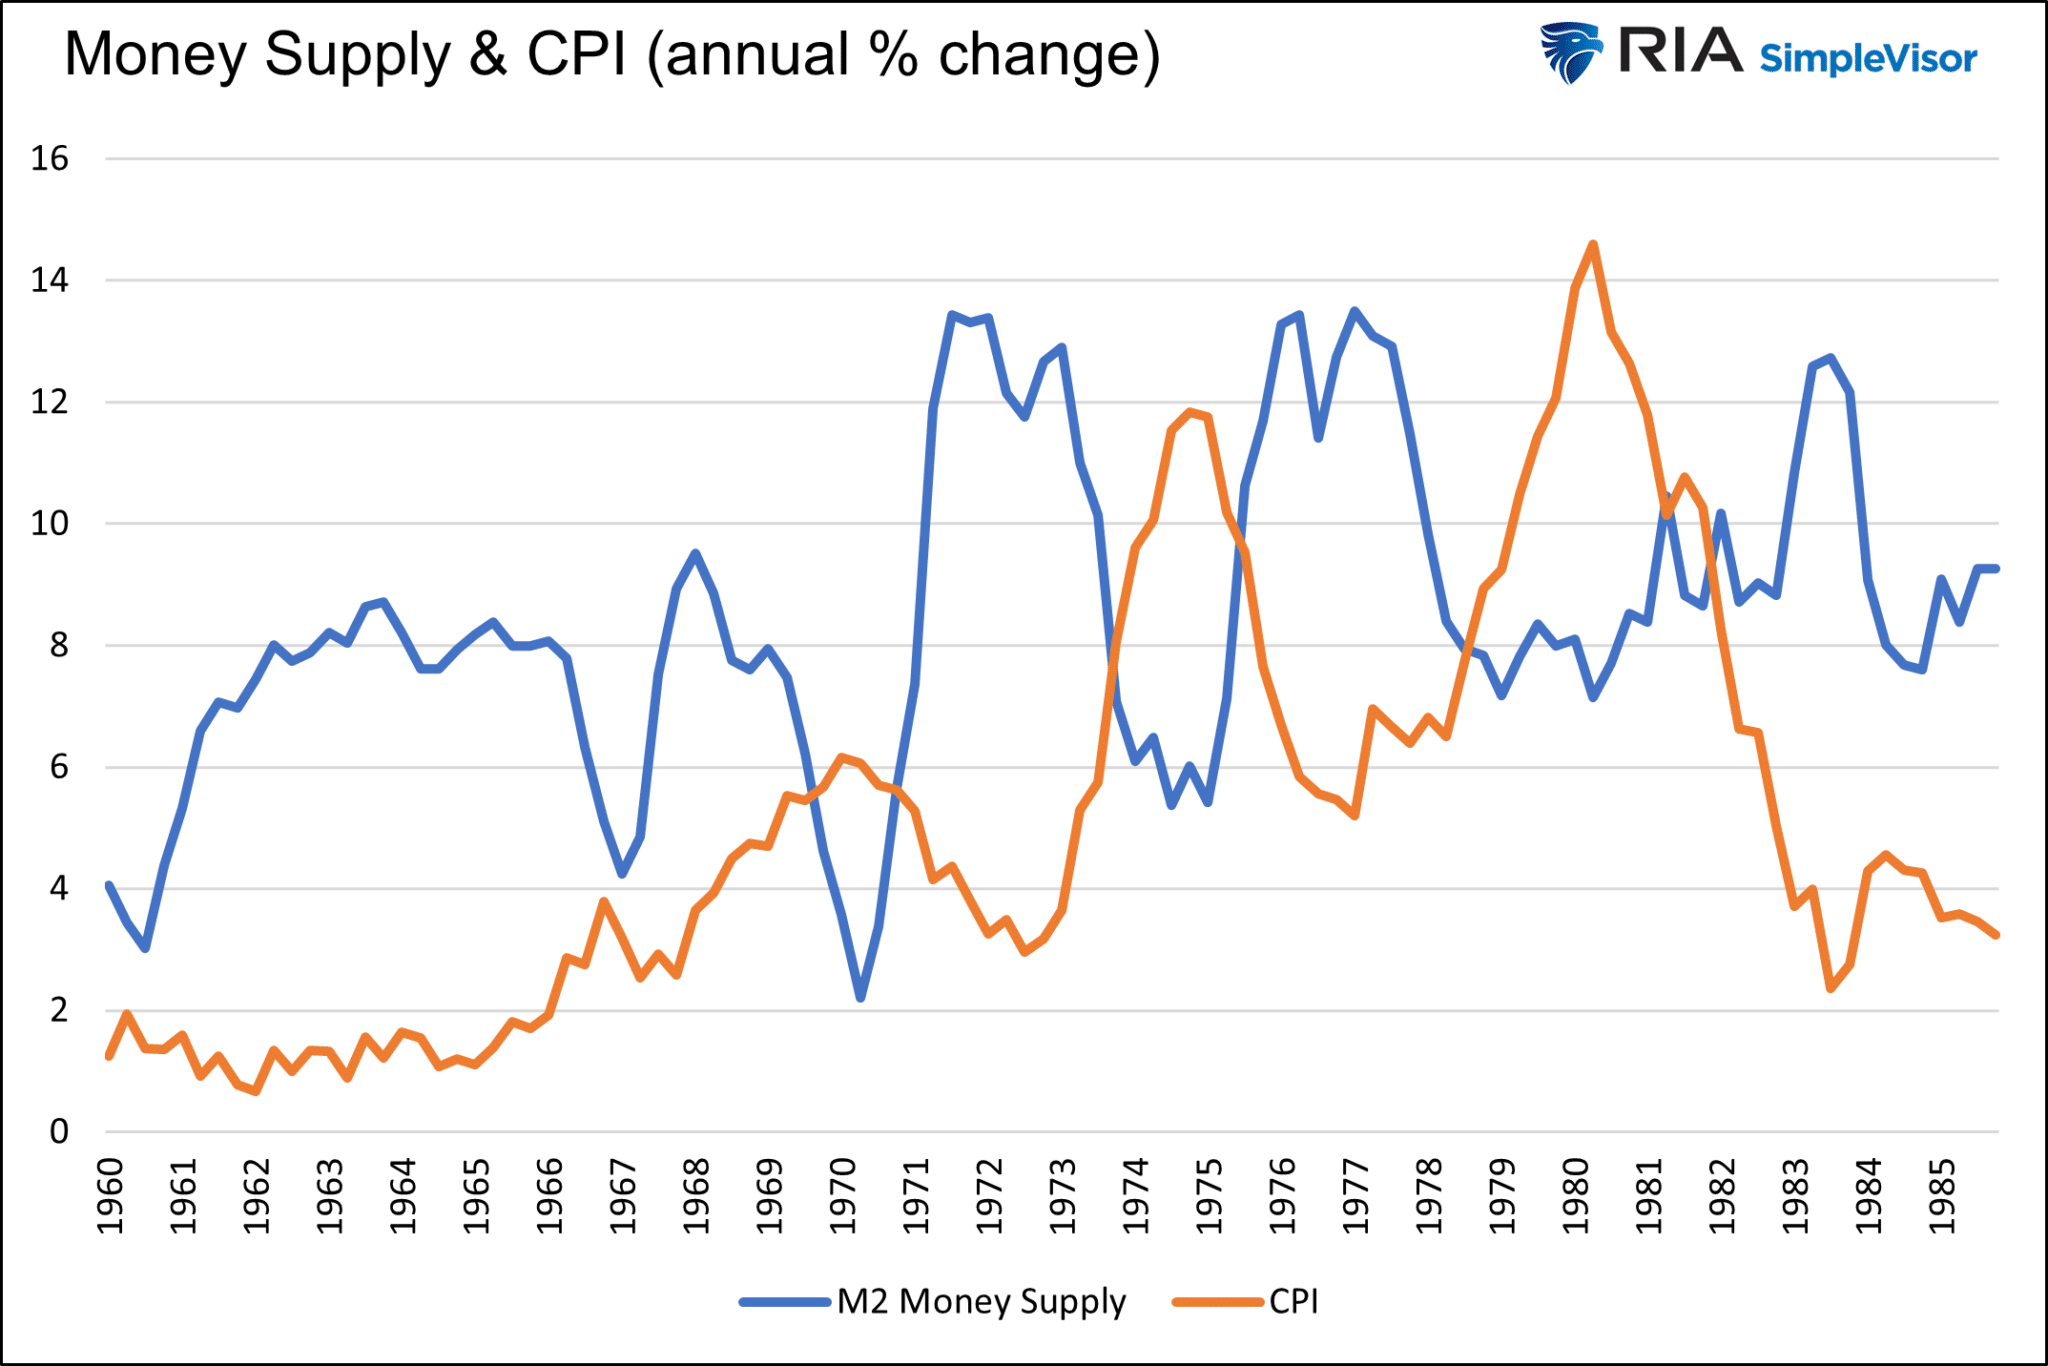
Milton Friedman famously said that “inflation is always and everywhere a monetary phenomenon.” It is hardly surprising, then, that economists have long viewed the Fed as central to understanding what caused the Great Inflation and what prompted the shift to the Great Moderation. Indeed, the conventional narrative is that the Fed, under Chairman Arthur Burns, pursued what has often been called “stop-go” monetary policy, meaning it targeted lower inflation but reversed course whenever employment looked weak and vice versa. This approach contributed to inflation’s volatility and encouraged expectations of higher future inflation because the Fed was seen as opportunistically pursuing short-term goals at the expense of longer-term stability.
The paragraph starts with a legendary quote from economist Milton Friedman. Friedman implies that inflation and money supply are tied at the hip. The graph below shows Friedman was onto something. Spurts in money supply growth preceded the three peaks of high inflation.
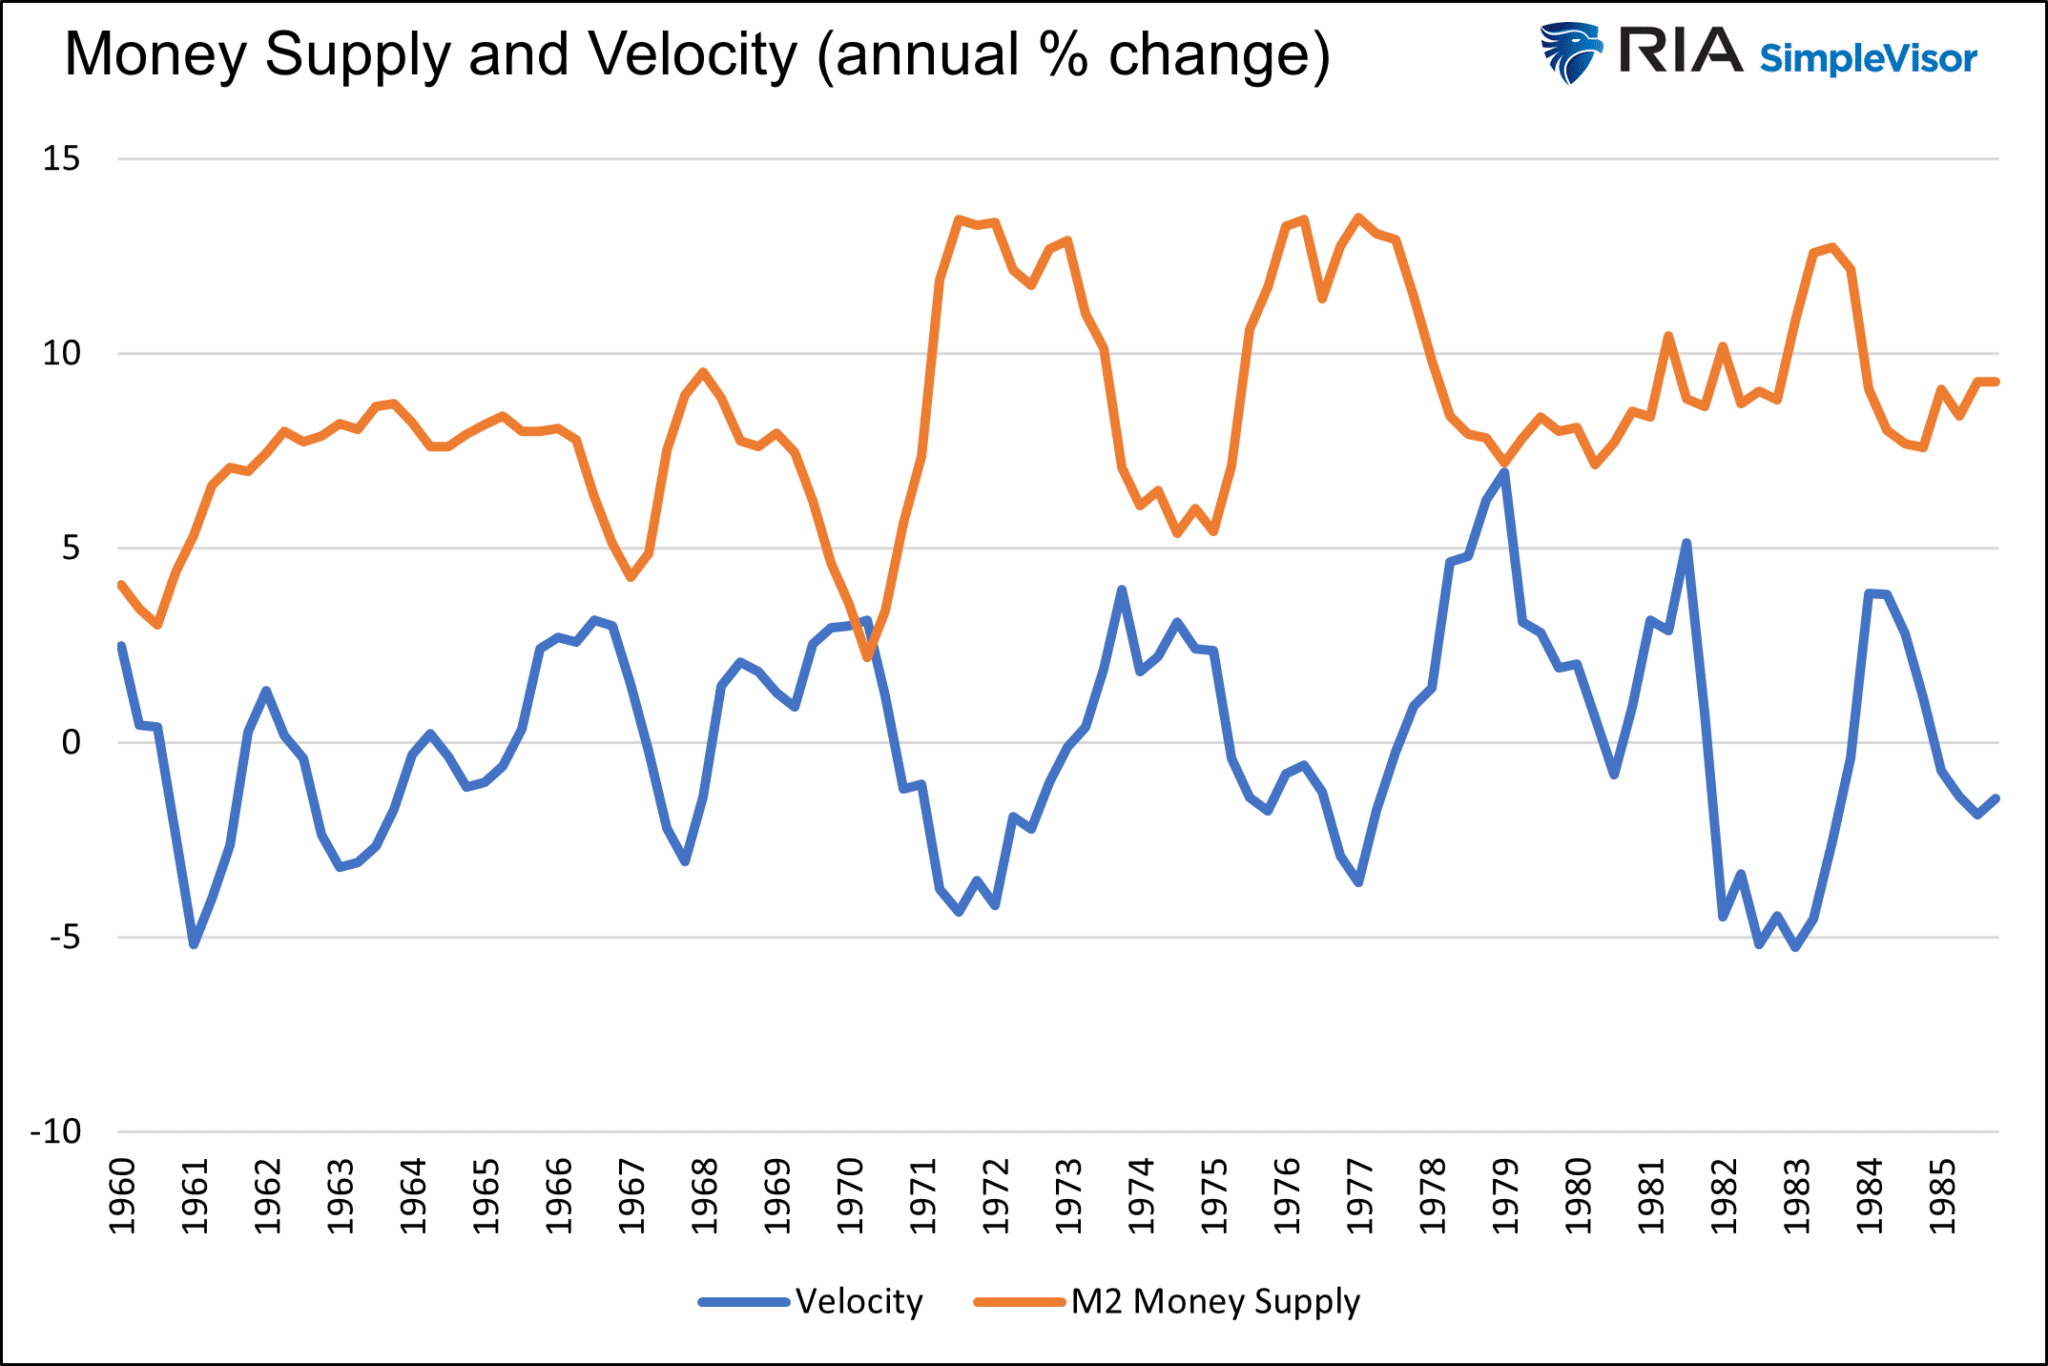
Contrary to Friedman’s popular theory, inflation is also a function of monetary velocity. Velocity measures how often money circulates throughout the economy. The inflationary effect is negligible if money is printed recklessly but not spent. Conversely, inflation will increase if the velocity of money increases despite a stagnant money supply.
The graph below compares the annual change in the money supply and its velocity. As you can see, they are most often negatively correlated. The graph may lead one to believe that inflation should have been benign in the 70s because money supply and velocity largely offset each other. But a little math shows that there were periods in which significant money supply growth outstripped declines in velocity and periods where both money and velocity grew at the same time. The second graph shows the net growth of money supply and velocity was positive through the 1960 to 1980 era and largely trended higher.

If high money supply growth was a critical culprit causing high inflation, as we and most others agree, the Fed is guilty of never taking its foot off the gas pedal.
Oil Price Shocks
Inflation was not solely due to fiscal and monetary folly. Two oil price shocks in the 1970s contributed significantly to inflation. Per the Washington Post:
The line of cars stretches for blocks. Pumps run dry. Newspapers warn of a great “gas crunch.” The president urges calm. Panicked motorists turn on one another.
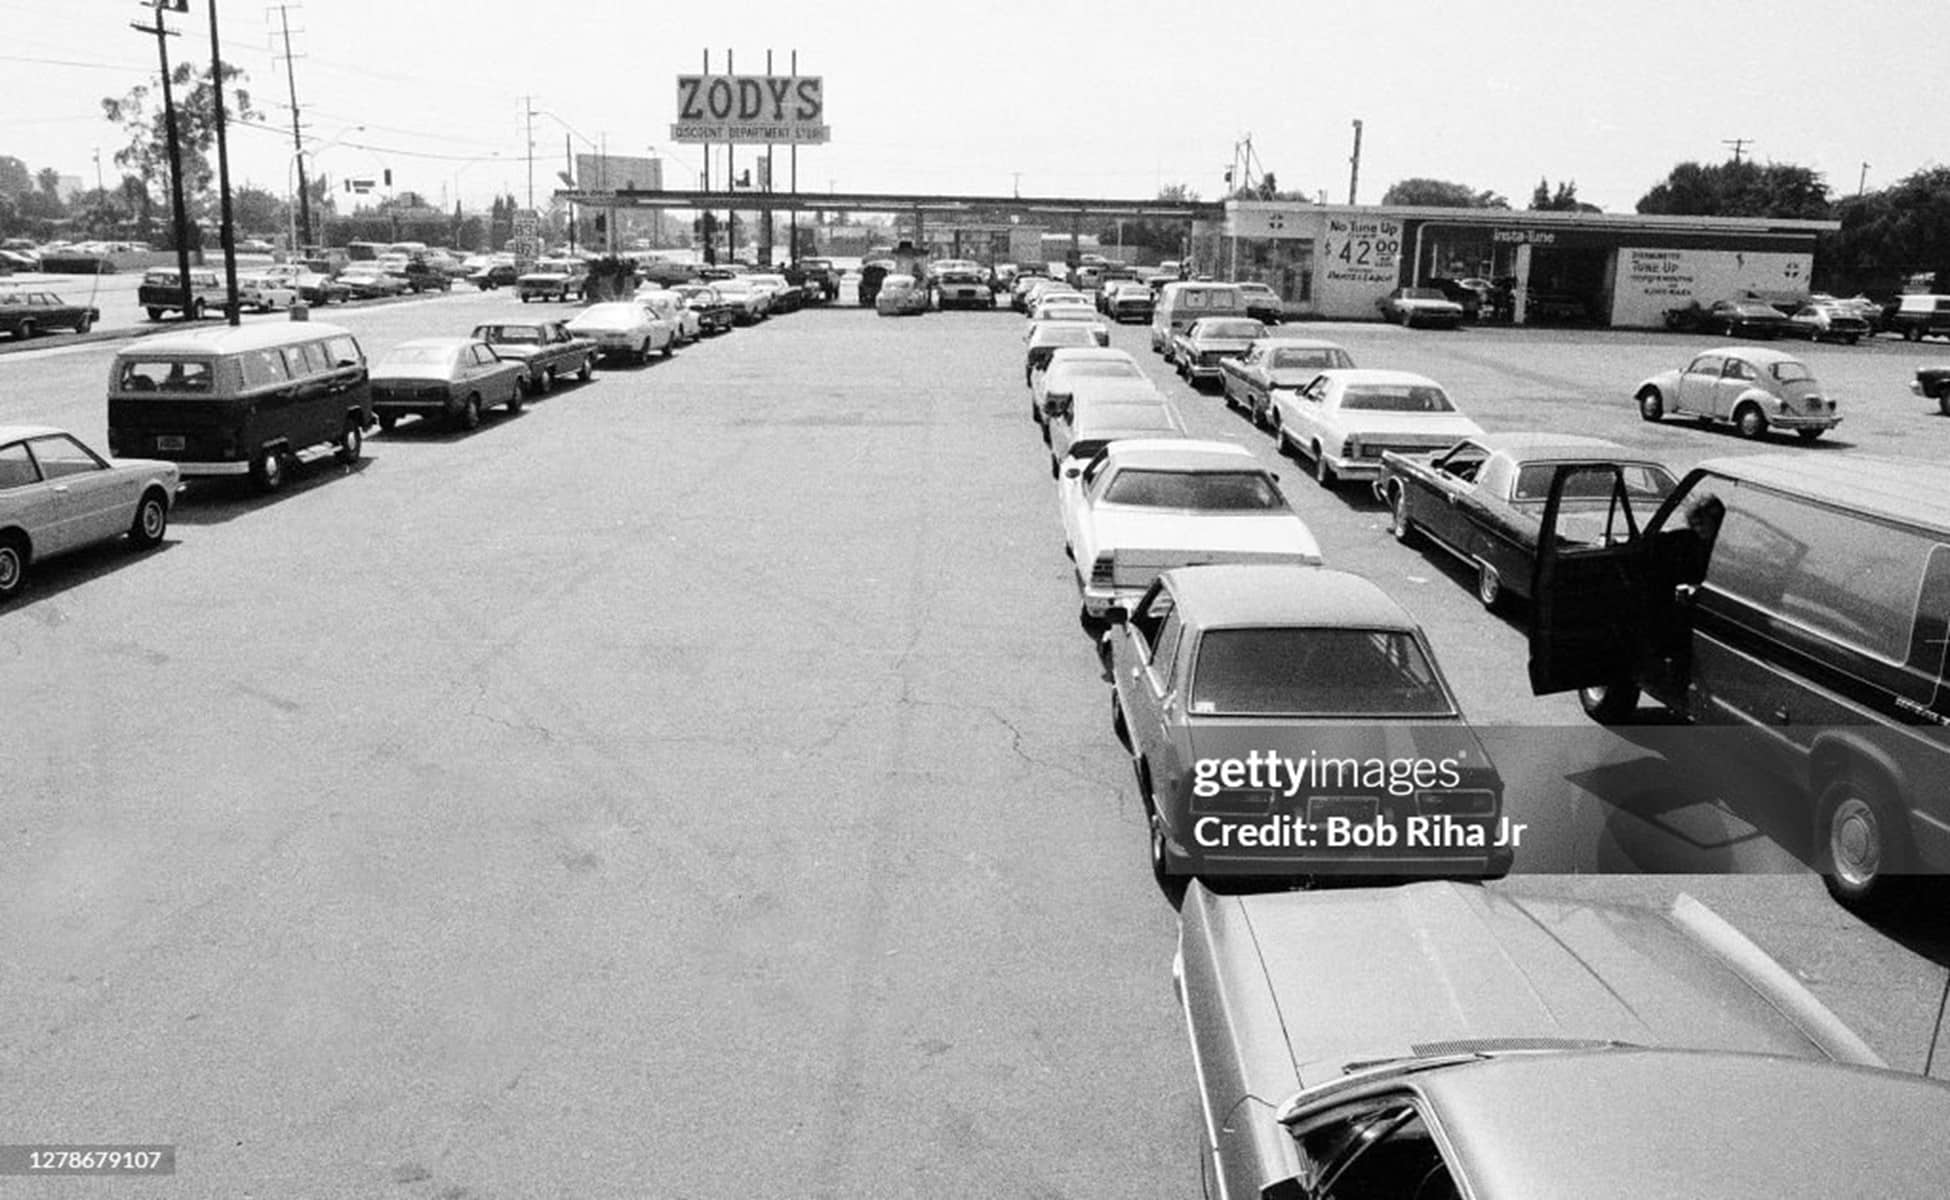
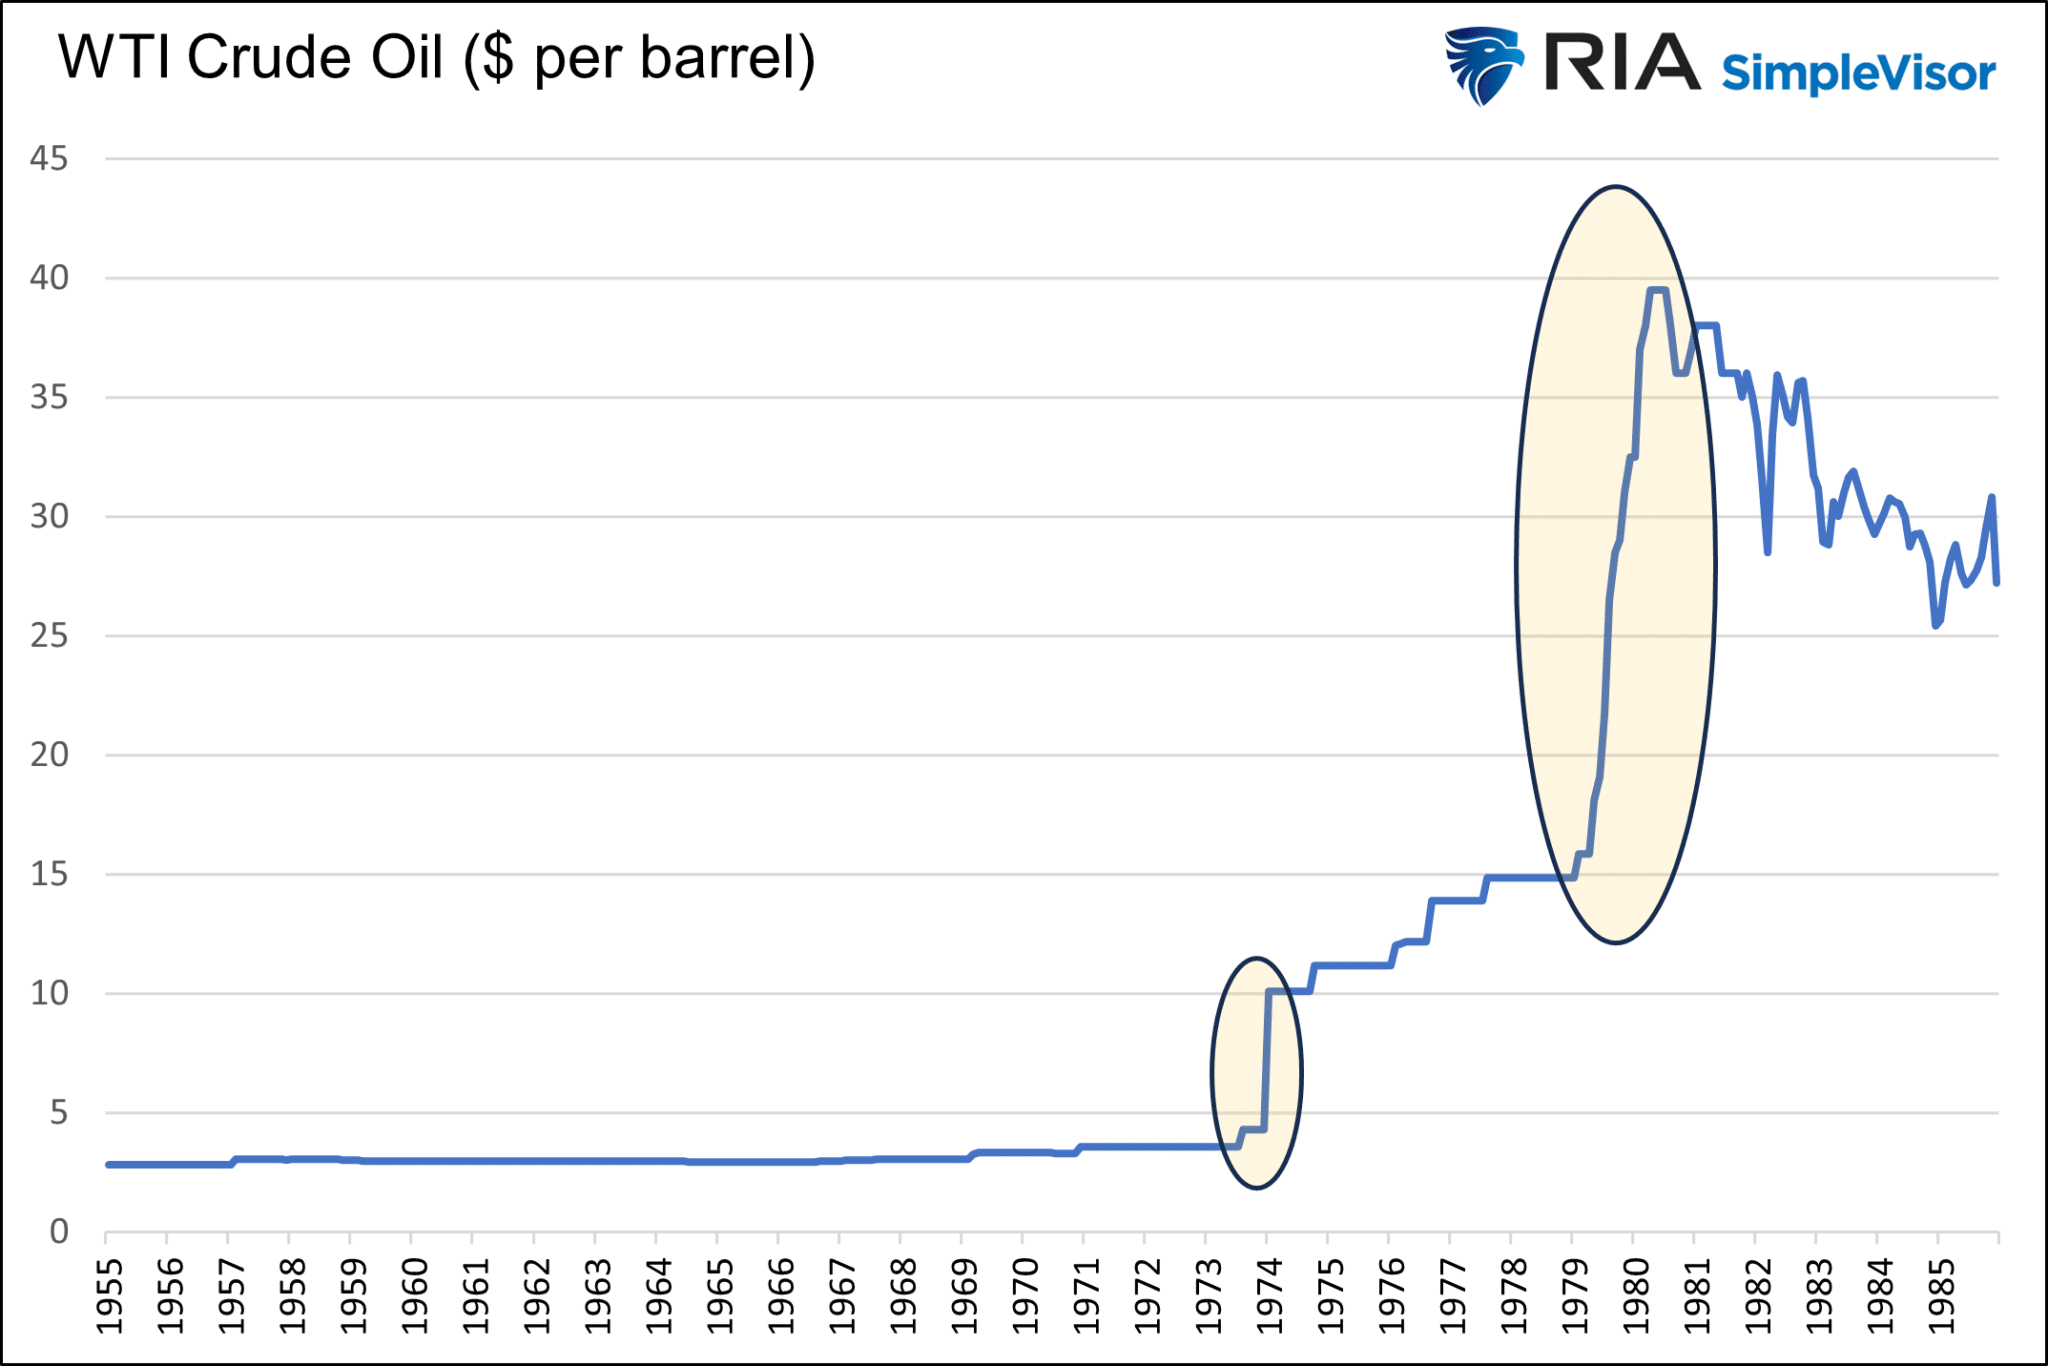
In 1973, the price of crude oil doubled when the Organization of Arab Petroleum Exporting Countries (OAPEC) declared an oil embargo against the U.S. and other countries supporting Israel during the Yom Kippur War.
Six years later, in 1979, the Iranian Revolution disrupted the oil flow to America, resulting in an additional tripling of oil prices.
It wasn’t just the impact of higher oil prices on the government’s CPI calculations that contributed to higher inflation. As energy prices rose appreciably, businesses faced higher transportation and production costs. The prices of plastics, clothes, toothpaste, and many other goods made with oil escalated with oil prices.
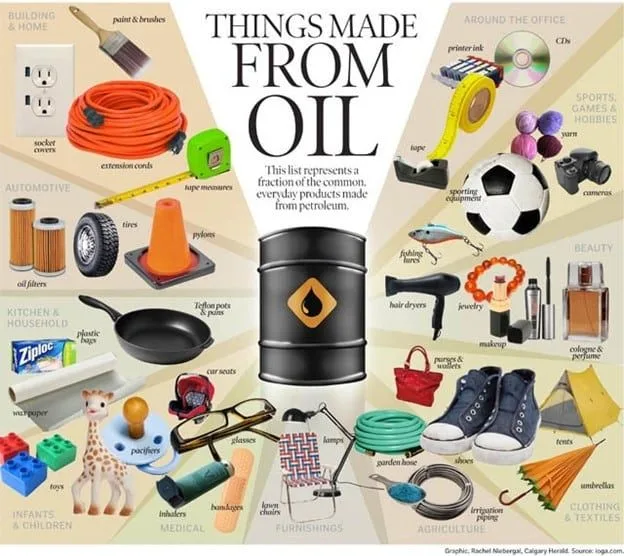
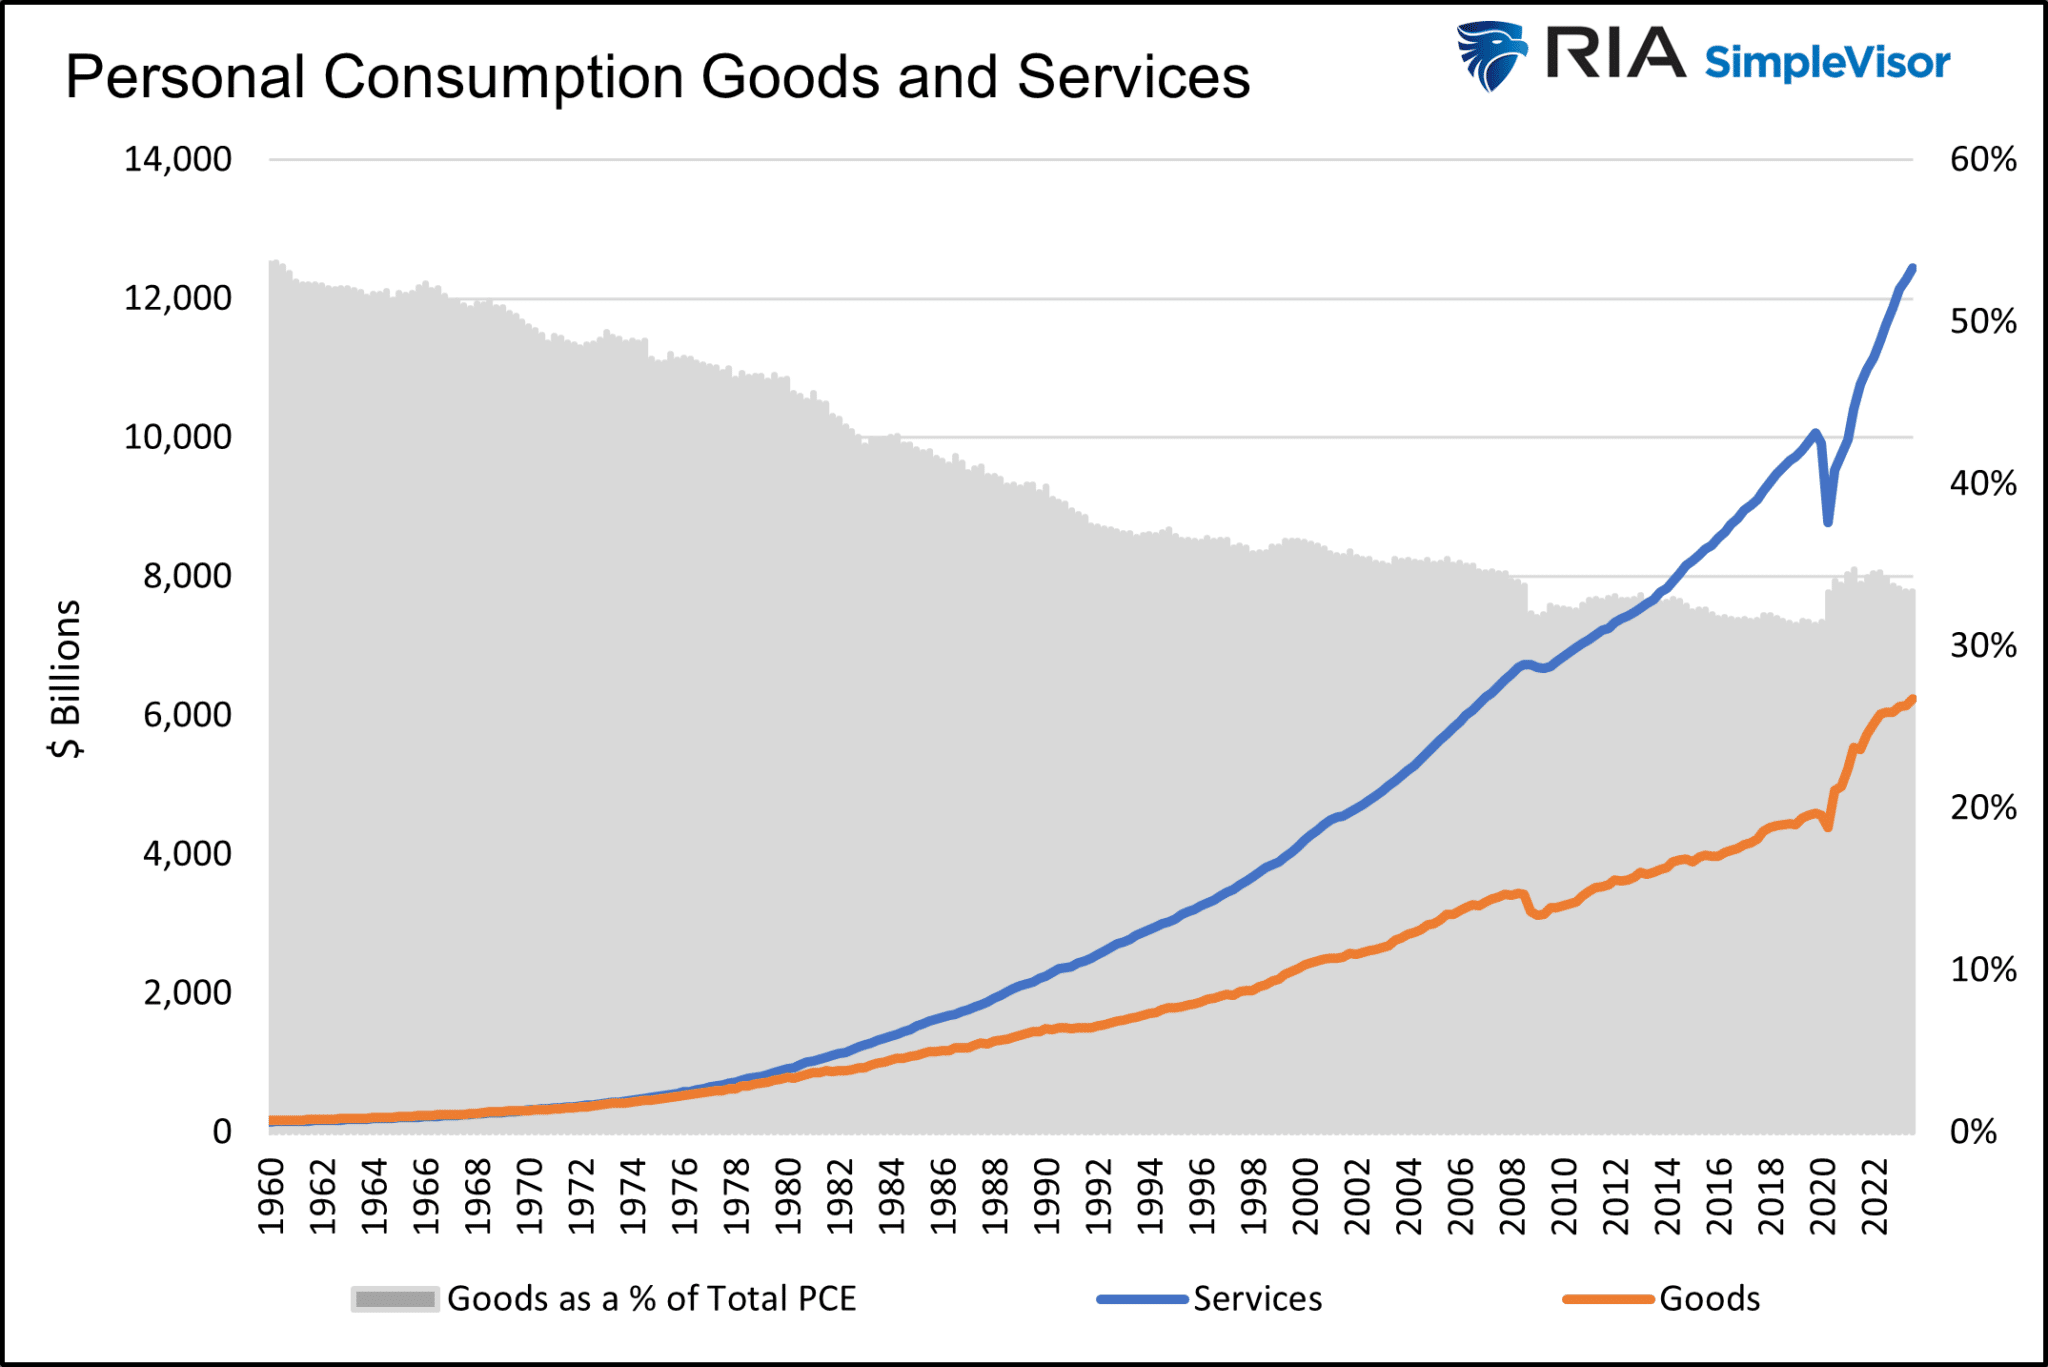
The higher costs of production and transportation were passed on to consumers. As we share below, goods represented nearly half of personal consumption in the 1970s. Today, they only account for about a third of total consumption. Therefore, higher oil prices impacted inflation more than they would today.
Additionally, the U.S. depended more on imported oil from OPEC and other countries than it does now. Consider that in 1978, the U.S. imported 8,363,000 barrels of oil per day. The latest data point, albeit a year old, was 8,329,000 barrels per day. But today’s GDP is more than 10 times larger, and domestic consumption of petroleum products has doubled since 1960.
While domestic and global oil prices are a function of global supply and demand, the effect of an embargo today would be much less impactful than in the 70s.

Price-Wage Spiral
In the 1970s, workers demanded higher wages to offset the rising cost of living. Simultaneously, business owners, having to pay higher salaries, responded by increasing prices. The cycle resulted in a self-reinforcing loop, which further amplified inflationary pressures.
In 2022, Jerome Powell frequently harkened back to the 1970s, recalling how the circular relationship between prices and wages fed inflation. Such a feedback loop is called a price-wage spiral. Powell and the Fed were intent on returning inflation to its target before such a loop could intensify inflationary pressures.
Unlike today, unions were much more prevalent and stronger in the 1970s. Accordingly, they had much more success negotiating more lucrative wages and benefit increases for their members. In 1983, 20% of U.S. workers were union members. That is more than twice today’s membership.
Strike Two for Nixon- Wage And Price Controls
As we share in Part One, in August 1971, President Nixon took the U.S. off the gold standard, unleashing the government’s and Fed’s powers. At the same time, he imposed wage and price controls.
By freezing wages and prices, the government dislocated fundamental market mechanisms that usually allow the economy to adjust for changes in the supply and demand of goods. For instance, businesses facing increased costs could not push higher prices through to their customers. As a result, they reduced output, resulting in shortages in some cases. Additionally, the controls discouraged investment and innovation. Many businesses were hamstrung to respond to changing economic conditions.
While wage and price controls limited inflation temporarily, the longer-term impact of Nixon’s actions exacerbated inflationary pressures and weakened economic activity.

Paul Volcker To The Rescue
As the 1970s marched on, the Fed, economists, and politicians became painfully aware the Phillips Curve was faulty. It turns out that high unemployment and high inflation are not mutually exclusive. Additionally, managing the nation’s money supply has broad economic and inflation ramifications.
In 1978, government and Fed policy were recodified via the Full Employment and Balanced Growth Act. Unlike the Employment Act of 1946, this act required that fiscal and monetary policy focus on full employment and price stability. Additionally, it required the Fed to establish targets for the growth of the money supply.
Armed with new legislation and economic theories, Paul Volcker became the Chairman of the Fed in 1979. One of his first actions was to target bank reserve growth rather than Fed Funds. Bank reserves allow banks to create money. Therefore, managing reserve growth indirectly allowed the Fed to control the money supply better. The Fed Funds rate is much less effective at managing the money supply.
Restricted reserve growth coupled with high-interest rates gave banks little incentive to lend and, by default, create money. By the mid-1980s, Volcker and the Fed tamed the recurrent spikes of high inflation. From that point forward, the balanced approach toward managing employment and inflation while focusing on the money supply has generally kept inflation low and stable.
Summary Part Two
Parts One and Two highlight the complexity and pitfalls of government intervention. Bad policies and faulty theories led to the initial burst of inflation in the 1960s and subsequent higher inflation levels.
In rehashing that period 50 years ago compared to today, we see that the government and Fed are bound to make mistakes. However, as we will show in Part Three, recent experiences differ greatly from the 1970s. While grave fiscal and monetary mistakes were made during the Pandemic, their faults were realized, and actions were taken to reverse, not accentuate, inflation.

